KEY DETERMINANTS OF INVESTMENT IN NIGERIA
Pat Donwa Department of Accounting
University of Benin, Benin City, Edo State E-mail: [email protected]
Osaro Agbontaen.
Department of Economics and Statistics University of Benin, Benin City, Edo State
E-mail: [email protected]
Abstract
This paper analyzes the key determinants of investment in Nigeria by adopting a co-integration and error correction mechanism. The model captures the dependent variable, investment with the values of gross fixed capital formation in the economy, while performance, profitability, capital performance, economic growth, political stability, macroeconomic stability, international financial risk and infrastructural development were independent variables in the model. These variables reveal relative levels of statistical significance. Results of the long-run and short-run estimates show that industrial performance, capital performance, and low levels of economic growth discourage investment in Nigeria. While profitability encourages investments, financial risk captured by exchange rate volatility strongly opposes them. Infrastructural development represented by government expenditure spending and macroeconomic stability disclose mix, show result, which implies uncertainty in policies associated with increase in investment.
1 Introduction
Economic empirical literatures on investment and related theories are often not conclusive in analyzing the determinants of investment in an economy. This is basically due to the fact that there are numerous determinants of investment and this depends on the perspective of the analyst decision to follow any related economic theory (Blonigen, 2005).
It is the purpose of this paper to consider uncertainties in accordance with the real economic variables linked to investment, in order to enhance the relevance of factors that go beyond the standard assumptions of neoclassical theory and to consider their associated impact on the levels of domestic investment in the Nigeria economy.
This paper attempts to specify the determinants of gross fixed capital formation in the Nigerian economy in order to understand the key determinants of investment in Nigeria and how crucial this is to understanding the main sources of fluctuations in aggregate demand in the economy.
2. Literature
in line with the level of growth in the proposed sector of the economy where the investor wishes to invest. This view reveals that the decision to invest is founded on the investors’ expectations about the value of these variables for the various alternatives available.
Therefore, to invest the rational investor considers his expected revenue and cost. Thus one can consider the main variables for rational investors’ investment decision as prospecting anticipated profit outcomes. It is necessary to recall that investors decision within imperfect markets, seeks to improve their revenue streams in several ways. They consider specific advantages in the market to have an edge over other competitors in the market, and to compensate for the additional cost of investing in the market. This includes innovation in technology, scale economies, marketing and improved sales skills, better and cheaper access to capital and other forms of government induced distortions (Ietto-Gillies, 2005).
Empirically, Abu (2009) evaluates the long-run determinants of private investment in Nigeria with the use of the error technique and found that growth of real income, increase in public investment, exchange rate and openness of the economy and higher savings have a positive effect on private investment. But credit to private sector, rising inflation, high lending rate impede private investment in Nigeria.
Benoit, Frank and Philip (2009) find out that those changes in users cost of capital, which in turn are affected by interest rates have both statistical and economical significant effect on investment, and that average interest rate on debt is generally higher for small firms than for large firms. These disclosures imply little evidence that the effects of monetary policies on small firms are enormous.
3.1 Theoretical Framework
In order to provide a quantitative assessment of the key determinants of investments in Nigeria in the short-run and long-run, we considered a simple theoretical framework that states the neoclassical theory of investment which proposes that on the long-run, it is necessary that a stable relationship exist between an economy’s capital stock, the level of real output and the real user cost of capital performance. In this light, we consider real growth in the economy as economic performance and capital stock performance in order to analyze the view that these relationships exist among the levels of investment and market size amidst high levels of economic risk represented in the model by exchange rate volatility and the levels of uncertainty captured by political stability and macroeconomic stability in the model (Ghura and Barry, 2000; Akkina and Mehmet, 2002; Naqvl, 2002; Pelgrim and Sevastian, 2002).
The model adopted in this study is a co-integration equations model. We designed models that express investment as gross fixed capital formation (GFCFI) as a function of GDP growth (UG), Market size (MZR), Political stability (NG), exchange rate volatility (EXV), profitability (Ox), macroeconomic stability (MES), Labour efficiency (LEI) and capital performance (Cw).
3.1
= Various slope coefficientsU1tand U2t= Impulses
0
A predicted consequence of the model is that firms invest more when there is less uncertainty. This is why the model introduces variables such as political stability, exchange rate volatility and macroeconomic stability. If this is confirmed, it indicates the relevance of uncertainty in investing and the need to rethink a new theory to complement the neoclassical ideology of investment. Then, the possible impact of investors’ analysis on the improved value of the investment must establish a risk and financial analysis undertaken to evaluate human resource inputs in the light of labour efficiency.
This co-integration equation model is built on a prototype macroeconomic model with a specific insight into investment and associated economic uncertainties prevalent in the Nigeria economy in order to analyze the major determinants of investment in Nigeria.
The model is unique since it gives the value of relative investment movements as a function of exogenous variables that include macroeconomic stability and exchange rate volatility which represents a set of policy instruments used in the country over the observation. Further, it allows for the direct estimation of the effect of these basic policy instruments on aggregate domestic investment, measured by gross fixed capital formation. This means, that the model avoids the danger of attributing too much influence to any variable which may limit the desired component of investment and it simply disperses uncontrollable channeled funds within the domestic economy such that they no longer have effect on total capital movements.
3.2 Model Specification
The formulation of a reliable investment equation taking into consideration the level of economic activities in Nigeria is an enormous process, since very little could be found in theoretical literature in line with the contemporary relationship between investment, market size, labour efficiency and other key macro economical variables.
The co-integration equation model adopted in this study seeks to explain investment in relation to its key determinants such as exchange rate volatility, macroeconomic stability, credit performance, GDP growth, macroeconomic stability, market size, profitability etc. This is so because for this model to explain the apparent perpetuation of disequilibria in investment in Nigeria, it has to include endogenous reaction functions of the monetary sector. Also, this model took into consideration the structural economic, policy changes and economic reforms in Nigeria through the periods of the research.
In functional forms this can be represented as:
3.2
GFCF = Gross Fixed Capital Formation, INDP = Industrial Performance, PRFT = Profitability,
GEXP = Government Expenditure, CAPF = Capital Performance, POLS = Political Stability, MACRSB = Macroeconomic Stability, GDPG = Gross Domestic Product Growth rate, EXRVL = Exchange Rate Volatility,
o= Intercept,
1,
2,
3,
4,
5,
6,
7and
8 = Various slope coefficients, U1tand U2t= Impulses The presumptive (a priori) signs are:0
The data used in this study were extracted form the Annual Report and Statement of Accounts of the Central Bank of Nigeria (CBN), for the period 1970 to 2008.
4.1 Unit Root Test for the Variables
To test for the presence of the co-integrating relationships among the variables specified in the model, we begin by considering the characteristics of the time series data employed in the study. This is achieved by considering the order of integration of each series using the Dickey Fuller (DF) and Augmented Dick Fuller set of unit root test.
Table 4.1
Ratios from ADF unit root test on the time series in the model in equation 3.1
DF/ADF Tests including an intercept and not a trend
DF/ADF Tests including intercepts and a trend
Regressors Test Levels 1st Diff. Levels 1st Diff.
GFCF DF Critical value -2.9422 -2.9422 -3.5348 -3.5348 Source: Microfit 4.1, March 2010.
*Critical values for the Dickey Fuller Test is at 95% confidence interval.
It can be inferred from the results that all the variables were virtually non-stationary at their levels. Only the GDPG, MACSB, CAPF and the GEXP variables were noticed to be stationary. This means that they are of the I(1) series. Differentiating the variables once shows that most of all the variables are stationary, which means they are mostly of the I(0) series. This is because the computed statistics are greater than the critical values of 3.5348 and -2.9422 respectively.
Table 4.2
The unit root tests of the residuals of DGFCF on the Regressors
Variables Dickey
Source: Microfit 4.0 January 2010
Table 4.3 presents the result of the unit root test for the residuals. The Dickey Fuller Test (DF) and the Augmented Dickey Fuller Test (ADF) shows that there is a long-term equilibrium relationship between changes in DGFCF and its arguments i.e. DINDP, DPRFT, DGEXP, DPOLS, DEXRVL, DCAPF, DMACSB and DGDPG with there associated lags at their first difference. Consequently, an error correction representation for the selected ARDL model was specified and estimated.
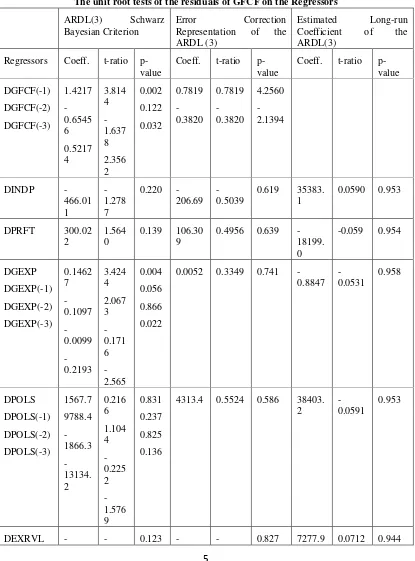
Table 4.3
The unit root tests of the residuals of GFCF on the Regressors
ARDL(3) Schwarz Bayesian Criterion
Error Correction Representation of the ARDL (3)
Estimated Long-run Coefficient of the ARDL(3)
Regressors Coeff. t-ratio p-value
Coeff. t-ratio p-value
Coeff. t-ratio p-value
0.4956 0.639 -18199.
0.0052 0.3349 0.741 -0.8847
4313.4 0.5524 0.586 38403. 2
-0.0591
0.953
355.07
0.861 0.1092 0.0540 1
0.944 2788.4 0.0532 0.955
INTR
-Source:Micofit 4.1 March 2010
Note:*Critical values for the Dickey Fuller Test is at 95% confidence interval.
Based on the ARDL (3), which was selected on the basis of Schwarz Bayesian criterion, the result of the long-run equation, and the short-run parsimonious DGFCF model estimate are reported in Table 4.3.
In order to obtain a better result the researcher probe further by seeking to find the ‘equilibrium error’ by tying the short-run behaviour of capital formation to its long-run value and relating the changes in capital formation to changes in the DINDP, DPRFT, DGEXP, DPOLS, DEXRVL, DCAPF, DMACSB and DGDPG ‘equilibrating error’ in the previous periods.
Therefore, the result shows that the short-run changes in DGFCF has a significant positive effect on the variables in the model and about 0.054 of the discrepancy between the actual and long-run or equilibrium value of investment is eliminated and corrected each year.
4.3 Empirical Analysis
The impact of DINDP (industrial performance) variable on the levels of investment measured by the changes in the economy shows a negative effect on the present levels of investment in the economy, but passes the test of individual statistical significance at the ten percent level of statistical significance. This implies that uncertainties in industrial performance influence the level of progress in investment in an economy negatively.
Profitability in investment in the economy has positive impact on the levels of investment in Nigeria. This variable was individually statistically significant at the 10 percent level, suggesting that as much as firms in investing in the Nigeria economy make increasing levels of profit, investors will be encouraged to invest in such sectors of the economy.
Relatively, the DGEXP variable used to capture the levels of infrastructural development in the economy has misleading result. The DGEXP at its present value has positive impact on the levels of investment in Nigeria but previous levels of infrastructural development has negative effects on the levels of investment in the economy and this was worse at the second lag. Revealing that previous levels of infrastructural development in did not encourage the levels of investment in the economy. It is necessary to note that these variables pass the test of individual statistical significance at the one and five percent levels, exposing the fact that previous levels of infrastructural development and formally guided policies discourage the investors’ prospecting intentions in Nigeria, but present policies are in focus and have the tendencies to encourage investments.
The DPOLS variable which captures political stability reveals a positive effect on its present and one period lag levels, but negative impacts at the second and third lags on the levels of investment during the period under review. The DPOLS variables pass the test of individual statistical significance at the 5 percent level. This suggests that to a reasonable degree, in the case of Nigeria, as revealed empirically, DPOLS is an impediment to the progress of investment.
Also, the DEXRVL variable which captures the relative levels of external financial risk as opposed to the levels of investment in the economy, reveals negative impacts on the level of investment in the Nigeria, but this variable was statistically significant at the 10 percent level. Suggesting that present rates of exchange do not encourage investment in Nigeria.
The DMASB variable shows that there is a strong negative relationship between macroeconomic stability and level of investment in the economy. The first and second lags values and its associated lags show misleading results. This variable was only statistically significant at its present level and at the first lag but its second and third lag was not statistically significant. Suggesting that the macro-economy is highly unstable and macro-economy policies put in place in the period of this study do not encourage the level of investment in the economy. This implies that some elements of positive effect were noticed despite distortions in the existing and previous macro-economic policies that made the levels of DMASB exert negative effects on investment during the period under review. This shows that previous macro-economic policies put in place to redirect DMASB performance and improve investment growth fundamentals, although reacts slowly, were in the right direction while present values are most likely worse of.
The DCAPF variable was noticed to have a negative impact on investment at its present levels. This variable pass the test of individual statistical significance at the one percent level, it reveals that capital performance influence distortions in the processes put in place to improve the levels of investment in the economy.
Subsequently, economic growth (DGDPG) shows a negative impact on the levels of investment. This reveal that the effect of pervious fiscal policies in line with the levels of growth in the economy put in place by government had a reasonable minimal control on investment to improve its present margin. This fact remains unassertive since the variable did not pass the statistical test of individual significance at either the one or five percent level
The Error Correction Mechanism (ecm) coefficient had the expected negative sign and this shows that the model easily passed the test of statistical significance at the 10 percent level. Therefore, the error correction mechanism in the economy as shown by the ecm coefficient is quite fast, taking about 54 months. This implies that it is likely that investment reverts back to its long-run equilibrium path quickly.
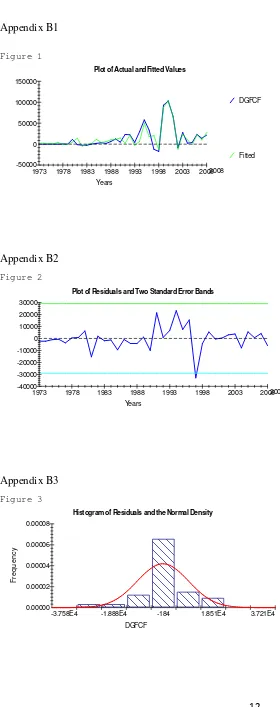
The result of the summary statistic shows that the model has a perfect fit. The R2value of 0.88 shows that over 88 percent systematic variation in investment can be explained by the model, leaving out only 12 percent to the error term.
In support of the R2 value is the F-statistics value of 5.25 which easily passed the test at the 1 percent level of statistical significance. This shows that all the slope coefficients are simultaneously significantly different from zero.
The D.W statistic value of 2.18 which is approximately 2 shows the model is free from the presence of first order serial correlation. Overall, the model has a very good fit and can be used to draw serious conclusions on the effect of DGFCF on other key macroeconomic variables in the Nigeria economy, taking into consideration the DINDP, DPRFT, DGEXP, DPOLS, DEXRVL, DMACSB and DGDPG in the economy in the period under investigation.
5 Recommendations and Conclusions 5.1 Recommendations
Government should integrate financial policies and investment policies such that both can interact freely and the stated outlined financial policies can determine the credit quality of the firms. This should also create an avenue for alternative finance mechanism such as a properly developed equity market, better deals to obtain straight debt and hybrid debt, all of which should be determined by the investing firms value and growth possibilities (Erwan and Clifford, 2002). Although this act will require government to monitor firms operations closely, it will reduce investment associated risk and the magnitude of distortions in investment policy associated with its financing possibilities.
Government should put innovation policies in place to study and develop “innovation strategy” in order to enhance the prospects of different types of investments. This may involve some levels of training and monitoring of small innovation projects. On this view, Eurria (2007) states that “macroeconomic stability is not enough to achieve vigorous growth with development”, and suggests other social economic challenges that will improve human capital; curtail poverty and enhance the well fair of the poor, monitoring economic and social performance.
Government can compensate for the impact of political and policy inconsistencies on all forms of investment that endangers economic growth by setting up mechanisms that will closely monitor and subsidize all forms of investment in the economy. This should correct all forms of policy inconsistency shocks by allowing the investment rate of return depend on the output prices while the existing level of subsidy should be maintained under high output prices (Hassett and Gilbert, 1999; Cherian and Enrico, 1999).
Also, Abu (2009) declares that government should adopt policies that will facilitate the growth of national income, increase public investment, saving and enhance foreign trade and investment. Employ policies to check rising inflation, lending rates, strengthen democratic institutions in order to sustain the current political stability and strengthen the mechanisms and increase funding for the anticorruption agencies to check corrupt practices.
5.2 Conclusions
This study analyzes the key determinants of investment in Nigeria using a co-integration model of gross fixed capital formation, industrial performance, infrastructural development, profitability, political stability, exchange rate volatility, capital performance, macroeconomic stability and economic growth of the Nigeria economy, 1970-2008. Empirical test results suggest that the model achieved established standards of statistical adequacy. We estimate the model’s error correction mechanism and examined the long and short run effect of the model in the period under study.
basically statistically significant, their impacts have a number of implications for the Nigeria policy makers to formulate efficient policies. This suggests that so much has to be put in place as a matter of policy to enhance investment and encouraging growth in various sectors while prospecting for sustainable economic growth.
Reference
Abu, N. (2009). Modeling the Long-run Determinants of Private Investment in Nigeria, The IUP Journal of Financial Economics, vol. VII, 3 and 4, pp. 48-63, September and December, 2009.
Akkina, K. and Mehmet, C. (2002). “The Determinants of Private Fixed Investment and the Relationship between Public and Private Capital Accumulation in Turkey”, Pakistan Development Review.
Beneit, M., Frank, S. and Philip, V. (2009). Investment and Monetary Policy in the Euro Area, Journal of Banking and Finance, Forth Coming
Blonigen, B. (2005). A Review of the Empirical Literature on FDI determinants, NBER, Working Paper, nr. 11299.
Erwan, M. and Clifford, W. S. Jr. (2002). Investment Policy, Financial Policies, and the Control of Agency Conflicts, The Bradley Policy Research Center Financial Research and Policy Working Paper No. FR 02-16, October, William E. Simon Graduate School of Business Administration, University of Rochester, USA.
Eurria, A. (2007). Structural reforms for investment and growth: Contribution by the OECD, OECD Secretary General Business Round Table and General Assembly of the BIAC, June 14, Mexico City.
Ghura, D. and Barry, G. (2000). “Determinants of Private Investment: A Cross-Regional Empirical Investigation”, Applied Economics, vol. 32, pp. 1819-29.
Ietto-Gillies, G. (2005). Transnational Corporations and International Production: Concept, Theories and Effects, Edward Elgar, Cheltenham, UK.
Naqvl, N. (2002). “Crowding-In or Crowding-Out? Modeling the Relationship between Public and Private Fixed Capital Formation Using Co-integration Analysis: the case of Pakistan 1964 to 2000”, Pakistan Development Review, vol. 41, pp. 225-76.
Pelgrim, F., Sabastian, S. and Alain, S. (2002). “Increases in Business Investment Rates in OECD Countries in the 1990s: How much can Be Explained by Fundamentals?”, Economic Department, Paris: Organization for Economic Co-operation and Development, Working Paper No. 237.
Electronic Resource
Appendix A1
Autoregressive Distributed Lag Estimates ARDL(3) selected based on Schwarz Bayesian Criterion
******************************************************************************* Dependent variable is DGFCF
36 observations used for estimation from 1973 to 2008
******************************************************************************* Regressor Coefficient Standard Error T-Ratio[Prob] DGFCF(-1) 1.4217 .37272 3.8144[.002] DGFCF(-2) -.65456 .39966 -1.6378[.122] DGFCF(-3) .52174 .22143 2.3562[.032] DINDP -466.0105 364.4485 -1.2787[.220] DPRFT 330.0219 211.0139 1.5640[.139] DGEXP .14627 .042713 3.4244[.004] DGEXP(-1) .10968 .053054 2.0673[.056] DGEXP(-2) -.0099262 .057854 -.17157[.866] DGEXP(-3) -.21934 .085511 -2.5650[.022] DPOLS 1567.7 7237.7 .21660[.831] DPOLS(-1) 9788.4 8863.0 1.1044[.287] DPOLS(-2) -1866.3 8286.3 -.22522[.825] DPOLS(-3) -13134.2 8329.0 -1.5769[.136] DEXRVL -355.0696 217.1656 -1.6350[.123] DCAPF -.0073699 .0033713 -2.1861[.045] DMACSB -298.8076 139.3478 -2.1443[.049] DMACSB(-1) -98.2868 199.2220 -.49335[.629] DMACSB(-2) -82.2279 135.7476 -.60574[.554] DMACSB(-3) -115.6008 178.2236 -.64863[.526] DGDPG -121.7390 202.2435 -.60194[.556] INTP -9367.1 7214.2 -1.2984[.214] *******************************************************************************
R-Squared .87489 R-Bar-Squared .70807 S.E. of Regression 14548.0 F-stat. F( 20, 15) 5.2445[.001] Mean of Dependent Variable 14480.0 S.D. of Dependent Variable 26925.3 Residual Sum of Squares 3.17E+09 Equation Log-likelihood -380.3908 Akaike Info. Criterion -401.3908 Schwarz Bayesian Criterion -418.0178 DW-statistic 2.1773
*******************************************************************************
Diagnostic Tests
******************************************************************************* * Test Statistics * LM Version * F Version * *******************************************************************************
* * * *
* A:Serial Correlation*CHSQ( 1)= 5.3886[.020]*F( 1, 14)= 2.4644[.139]*
* * * *
* B:Functional Form *CHSQ( 1)= 8.4330[.004]*F( 1, 14)= 4.2827[.057]*
* * * *
* C:Normality *CHSQ( 2)= 19.7371[.000]* Not applicable *
* * * *
* D:Heteroscedasticity*CHSQ( 1)= .32678[.568]*F( 1, 34)= .31146[.580]* *******************************************************************************
A:Lagrange multiplier test of residual serial correlation B:Ramsey's RESET test using the square of the fitted values C:Based on a test of skewness and kurtosis of residuals
Appendix A2
Test of Serial Correlation of Residuals (OLS case)
******************************************************************************* Dependent variable is DGFCF
List of variables in OLS regression:
DGFCF(-1) DGFCF(-2) DGFCF(-3) DINDP DPRFT DGEXP DGEXP(-1) DGEXP(-2) DGEXP(-3) DPOLS DPOLS(-1) DPOLS(-2) DPOLS(-3) DEXRVL DCAPF DMACSB DMACSB(-1) DMACSB(-2) DMACSB(-3) DGDPG INTP
36 observations used for estimation from 1973 to 2008
******************************************************************************* Regressor Coefficient Standard Error T-Ratio[Prob] OLS RES(- 1) -1.5210 1.1890 -1.2792[.209] OLS RES(- 2) .076947 .79927 .096272[.924] *******************************************************************************
Lagrange Multiplier Statistic CHSQ( 2)= 5.4104[.067] F Statistic F( 2, 13)= 1.1497[.347]
*******************************************************************************
Appendix A3
Unit root tests for residuals
******************************************************************************* Based on ARDL regression of DGFCF on:
DGFCF(-1) DGFCF(-2) DGFCF(-3) DINDP DPRFT DGEXP DGEXP(-1) DGEXP(-2) DGEXP(-3) DPOLS DPOLS(-1) DPOLS(-2) DPOLS(-3) DEXRVL DCAPF DMACSB DMACSB(-1) DMACSB(-2) DMACSB(-3) DGDPG INTP
36 observations used for estimation from 1973 to 2008
******************************************************************************* Test Statistic LL AIC SBC HQC
DF -6.2123 -349.9073 -350.9073 -351.6556 -351.1591 ADF(1) -3.8495 -349.8313 -351.8313 -353.3278 -352.3348 ADF(2) -3.3071 -349.7751 -352.7751 -355.0199 -353.5304 *******************************************************************************
95% critical value for the Dickey-Fuller statistic = *NONE*
Appendix B1
Figure 1
Plot of Actual and Fitted Values
DGFCF
Fitted
Years -50000
0 50000 100000 150000
1973 1978 1983 1988 1993 1998 2003 20082008
Appendix B2
Figure 2
Plot of Residuals and Two Standard Error Bands
Years -10000
-20000 -30000 -40000 0 10000 20000 30000
1973 1978 1983 1988 1993 1998 2003 20082008
Appendix B3
Figure 3
Histogram of Residuals and the Normal Density
F
re
q
u
e
n
c
y
DGFCF 0.00000
0.00002 0.00004 0.00006 0.00008
Appendix C1
Estimated Long Run Coefficients using the ARDL Approach ARDL(3) selected based on Schwarz Bayesian Criterion
******************************************************************************* Dependent variable is GFCF
35 observations used for estimation from 1974 to 2008
Appendix C2
Error Correction Representation for the Selected ARDL Model ARDL(3) selected based on Schwarz Bayesian Criterion
******************************************************************************* Dependent variable is dGFCF
35 observations used for estimation from 1974 to 2008
******************************************************************************* Regressor Coefficient Standard Error T-Ratio[Prob] dGFCF1 .78190 .18372 4.2560[.000] dGFCF2 -.38998 .18228 -2.1394[.043] dINDP -206.6903 410.1849 -.50390[.619] dPRFT 106.3093 223.5479 .47555[.639] dGEXP .0051682 .015434 .33486[.741] dGDPG -16.2882 228.4606 -.071295[.944] dMACSB -311.1949 83.4990 -3.7269[.001] dCAPF -.6378E-3 .0036023 -.17706[.861] dPOLS 4313.4 7808.0 .55243[.586] dEXRVL -42.5141 192.8685 -.22043[.827] ecm(-1) .0058415 .095535 .061145[.952] *******************************************************************************
List of additional temporary variables created: dGFCF = GFCF-GFCF(-1)
dGFCF1 = GFCF(-1)-GFCF(-2) dGFCF2 = GFCF(-2)-GFCF(-3) dINDP = INDP-INDP(-1) dPRFT = PRFT-PRFT(-1) dGEXP = GEXP-GEXP(-1) dGDPG = GDPG-GDPG(-1) dMACSB = MACSB-MACSB(-1) dCAPF = CAPF-CAPF(-1) dPOLS = POLS-POLS(-1) dEXRVL = EXRVL-EXRVL(-1)
ecm = GFCF -35383.1*INDP + 18199.0*PRFT + .88474*GEXP -2788.4*GDPG -53 273.1*MACSB -.10918*CAPF + 738403.2*POLS -7277.9*EXRVL
******************************************************************************* R-Squared .59754 R-Bar-Squared .42985 S.E. of Regression 20540.3 F-stat. F( 10, 24) 3.5633[.005] Mean of Dependent Variable 14892.6 S.D. of Dependent Variable 27202.7 Residual Sum of Squares 1.01E+10 Equation Log-likelihood -390.6153 Akaike Info. Criterion -401.6153 Schwarz Bayesian Criterion -410.1697 DW-statistic 2.3920
******************************************************************************* R-Squared and R-Bar-Squared measures refer to the dependent variable