STACK NUMBER INFLUENCE ON THE ACCURACY OF ASTER GDEM (V2)
S. M. J. Mirzadeh b, A. Alizadeh Naeini a, *, S. B. Fatemi a
a University of Isfahan, Department of Geomatics Engineering, Faculty of Civil Engineering and Transportation, Isfahan, Iran - (a.alizadeh, sb.fatemi)@eng.ui.ac.ir
b K. N. TOOSI University of Technology, Faculty of Geodesy and Geomatics Engineering, Tehran, Iran - smjmirzadeh@mail.kntu.ac.ir
KEY WORDS: Accuracy Assessment, ASTER GDEM, Digital Elevation Model (DEM), Slope, Stack Number
ABSTRACT:
In this research, the influence of stack number (STKN) on the accuracy of Advanced Spaceborne Thermal Emission and Reflection Radiometer (ASTER) Global DEM (GDEM) has been investigated. For this purpose, two data sets of ASTER and Reference DEMs from two study areas with various topography (Bomehen and Tazehabad) were used. The Results show that in both study areas, STKN of 19 results in minimum error so that this minimum error has small difference with other STKN. The analysis of slope, STKN, and error values shows that there is no strong correlation between these parameters in both study areas. For example, the value of mean absolute error increase by changing the topography and the increase of slope values and height on cells but, the changes in STKN has no important effect on error values. Furthermore, according to high values of STKN, effect of slope on elevation accuracy has practically decreased. Also, there is no great correlation between the residual and STKN in ASTER GDEM.
* Corresponding author
1. INTRODUCTION
Nowadays, Digital Elevation Model (DEM) provides beneficial information about the Earth surface elevations and play a major role in many applications e.g., geophysics, hydrology, geology, InSAR applications, and geomorphology (Hooper, Zebker et al. 2004, Callow, Van Niel et al. 2007, Stearns and Hamilton 2007, Toutin 2008, Bolkas, Fotopoulos et al. 2016). Moreover, DEM is one of the crucial information used in many different spatial decisions of Geospatial Information System (GIS) (Zerger 2002, Chang, Parvathinathan et al. 2008). Accordingly, the accuracy of DEM influences on the accuracy of applications results. Developing the new remote sensing technology and the increase of the number of satellites increased DEM generation using the optic and radar satellite images with different characteristics, in addition to traditional surveying and using aerial photos. Also, the availability of optical and radar images with different spatial resolution has resulted in DEM generation with different spatial resolution and accuracy in the local and global scales. In recent years, Shuttle Radar Topography Mission (SRTM), Advanced Spaceborne Thermal Emission and Reflection Radiometer (ASTER) and ALOS World 3D (AW3D) DEMs which are in global scale and their spatial resolution is 30 meter, have been used in several researches related to various fields (Breit, Eineder et al. 2003, Hirano, Welch et al. 2003, Kato and Yamaguchi 2005, Rivera, Casassa et al. 2005, Sheng and Alsdorf 2005, Surazakov and Aizen 2006, Hubbard, Sheridan et al. 2007, Rennó, Nobre et al. 2008, Pareta and Pareta 2011, Choi, Oh et al. 2012).
ASTER GDEM developed jointly by the ministry of Economy, Trade and Industry (METI) of Japan and the NASA is available to use by researchers in various fields. It cover the land surfaces
between 83N and 83S, at 1 arc-second spatial resolution, with geographic coordinates referenced to WGS84/EGM96 geoid. The methodology used to produce the ASTER GDEM involved automated processing of the entire 1.5-million-scene ASTER archive which includes cloud masking, removing outliers and averaging these selected data to create final grid values. ASTER GDEM have two elements: 1) DEM data and 2) Stack Number (STKN) which specify the reliability of DEM values. In fact, a STKN file is supplied with each GDEM tile, so that the positive STKN values represent a number of individual ASTER GDEM scenes that contributed to determine the final GDEM elevation value for that corresponding pixel in the DEM file.
2. DATASETS AND STUDY AREAS
2.1 Study Areas
In this research, two different regions have been selected. First region is Bomehen in North East of Tehran, in Iran that consists of various landscapes such as mountainous and hilly regions, as well as some flat urban regions. Second region, which is named Tazehabad, is an area near west of Kermanshah, Iran that covers flat, hilly, and mountainous areas.
a
b
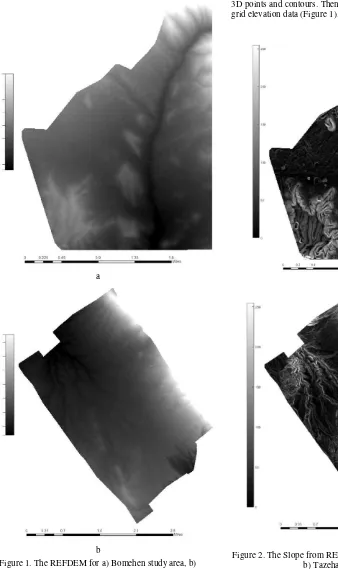
Figure 1. The REFDEM for a) Bomehen study area, b) Tazehabad study area
2.2 Datasets
In this research, the two ASTER version 2 GDEM in 30-meter spatial resolution and the REFDEM from two considered study areas are used. The most updated and enhanced version of this GDEM, ASTER GDEM2, was applied. In this version, 260000 additional stereo pairs have been used in order to improve the spatial coverage and to reduce the artifacts occurrence. A more accurate DEM was also generated from digitized 1:2000 maps for both regions. These reference DEMs (REFDEM) have been produced by a TIN (Triangulated irregular network) model from 3D points and contours. Then this model was converted into the grid elevation data (Figure 1).
a
b
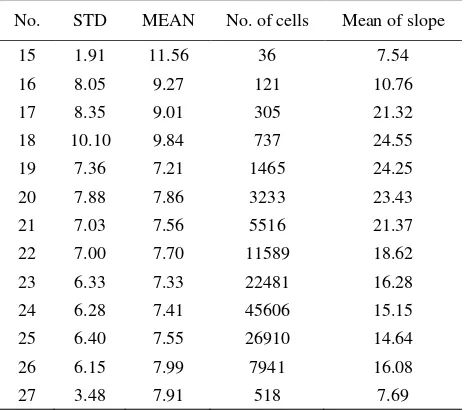
Also, the slope of REFDEM and STKN of ASTER GDEMs for both study areas are shown in Figures 2 and 3.
a
b
Figure 3. The STKN of ASTER GDEM in a) Bomehen study area, b) Tazehabad study area
3. RESULTS AND DISCUSSION
In this section, the analysis results of several parameters e. g., STKN, slope, residual and standard deviation of residual will be represented. To check the relationship among these parameters, for each STKN value in both study areas, the mean slope of cells, the number of cells, the mean absolute residual and the standard deviation of residual were calculated. These values are shown in Table 1 and 2.
According to the results of Tables 1 and 2, it is concluded that STKN of 24 and 17 with 36% and 34% of cells number, have the maximum frequency, respectively, in Bomehen and Tazehabad study areas. In these tables, the minimum value of mean absolute residual (7.2 and 5.72 m) happens in STKN of 19 in Bomehen and Tazehabad study areas, respectively. There is no exact relationship between the increase or decrease of STKN and the change of mean error values. For example, the maximum value of mean error belong to different STKN value (STKN of 15 in Bomehen and STKN of 14 in Tazehabad study areas). Mostly, due to Bomehen topographic condition, this area has more height error than that of Tazehabad. In Tazehabad, the flat area is dominant and so, it has less mean error than Bomehen. Also, the values of STKN in Bomehen (15-27) is higher than Tazehabad (10-19) when the area of Bomehen is less than (about 60%) the area of Tazehabad. So, to achieve more accurate height data, more height data (STKN) are
expected, although the error values in Bomehen are higher than their corresponding in Tazehabad. This analysis can be seen in Tables 1 and 2.
Table 1. The calculated parameters for Bomehen study area
No. STD MEAN No. of cells Mean of slope
Table 2. The calculated parameters for Tazehabad study area
No. STD MEAN No. of cells Mean of slope Tazehabad, respectively. The correlation coefficient between slope values and residuals are -0.08 and 0.16 in Bomehen and Tazehabad respectively. The small coefficient values show that the effect of slope on residuals, which has been proved in many researches, decreases due to the use the suitable number of STKN (at least 10 in this study). So, it is expected, the defined relationship between residual and cell slope is observed in both study areas.
slope of cells, when the mean absolute residuals of cells has no well-defined relationship with slope. Even, in STKN of 19 with minimum of mean absolute residual, there is one of maximum of mean slope.
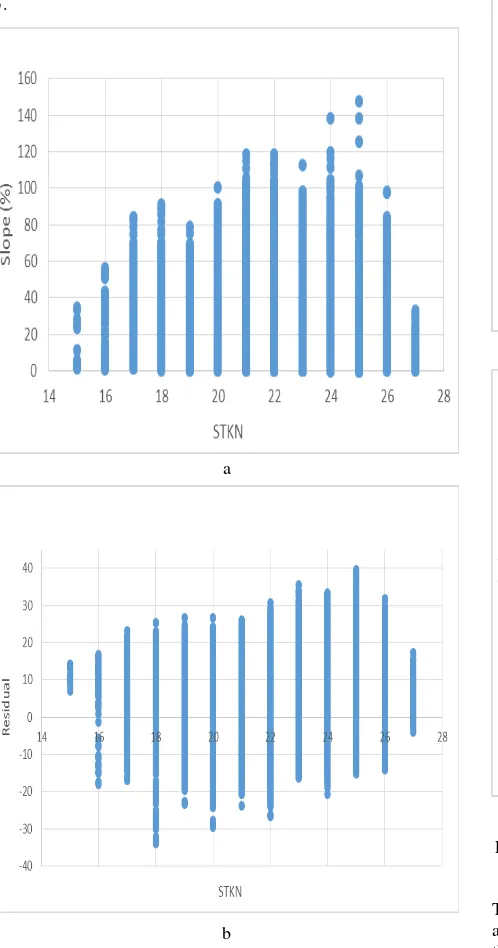
To investigate the relationship between slope and STKN, and also relationship between residual and STKN, the pairwise scatter plot of these parameters has been shown in Figures 4 and 5.
a
b
Figure 4. The scatter plot of a) Slope vs STKN, and b) Residual vs STKN in Bomehen study area
As seen in Figure 4, there are different slopes in all cells in both study areas, which their height has been estimated with different STKN. Of course, the range of slope values in various STKN is different. For example, in STKN of 10 and 11 in Tazehabad and in STKN of 15, 16, and 27 in Bomehen, the range of available slope is less than other STKN. So, regardless of few STKN, other STKN cover the range of slopes, which are very similar together, whereas the mean of slope and the number of cells are different for these STKN. Although this similarity in range of slope and difference in the mean of slopes have influenced on error values, it seems that availability of more observations of
STKN could somewhat control this issue. So, the chart of mean absolute errors doesn’t undulate.
a
b
Figure 5. The scatter plot of a) Slope vs STKN, and b) Residual vs STKN in Tazehabad study area
4. CONCLUSION
In this research, the relationship between three slope, STKN and the elevation error parameters upon ASTER GDEM was investigated in two study areas. Using the reference DEM gives us this ability to do cell by cell investigation. Thus, the high volume of information had be available for assessment. According to this analysis, the important matters are represented in the following:
Although the range of STKN is different in two study areas, the STKN of 19 has the minimum value of mean absolute error in both study areas. This minimum error has small difference with other STKN.
The value of mean absolute error increase by changing the topography and the increase of slope values and height on cells. Changing in STKN has no important effect on error values.
The effect of STKN has been applied, because in both study areas, the minimum value of STKN is 10. Also, higher value of STKN destroyed the robust correlation between the slope, STKN and error values.
Tazehabad study area has slightly height. The increase of STKN values in this region leads the error values to under-estimation. In Bomehen, this issue is vice versa so that, the over-estimation has happened. This subject is stronger than when the STKN increases.
In general, it can be concluded that the availability of STKN as an external data to estimate the height of cell in ASTER GDEM, had be mandatory to receive the acceptable result. Of course, by increasing STKN, the discipline of relationship between error value, STKN, and slope has been destroyed, and no high correlation coefficient between them are observed.
REFERENCES
Abrams, M., et al. (2015). "The advanced spaceborne thermal emission and reflection radiometer (ASTER) after fifteen years: review of global products." International Journal of Applied Earth Observation and Geoinformation 38: 292-301.
Bolkas, D., et al. (2016). "Assessing Digital Elevation Model Uncertainty Using GPS Survey Data." Journal of Surveying Engineering 142(3): 04016001.
Breit, H., et al. (2003). Traffic monitoring using SRTM along-track interferometry. Geoscience and Remote Sensing Symposium, 2003. IGARSS'03. Proceedings. 2003 IEEE International, IEEE.
Callow, J. N., et al. (2007). "How does modifying a DEM to reflect known hydrology affect subsequent terrain analysis?" Journal of Hydrology 332(1): 30-39.
Chang, N.-B., et al. (2008). "Combining GIS with fuzzy multicriteria decision-making for landfill siting in a fast-growing urban region." Journal of environmental management 87(1): 139-153.
Choi, J., et al. (2012). "Combining landslide susceptibility maps obtained from frequency ratio, logistic regression, and artificial neural network models using ASTER images and GIS." Engineering Geology 124: 12-23.
Hirano, A., et al. (2003). "Mapping from ASTER stereo image data: DEM validation and accuracy assessment." ISPRS Journal of Photogrammetry and Remote Sensing 57(5): 356-370.
Hooper, A., et al. (2004). "A new method for measuring deformation on volcanoes and other natural terrains using InSAR persistent scatterers." Geophysical Research Letters 31(23).
Hubbard, B. E., et al. (2007). "Comparative lahar hazard mapping at Volcan Citlaltépetl, Mexico using SRTM, ASTER and DTED-1 digital topographic data." Journal of Volcanology and Geothermal Research 160(1): 99-124.
Kato, S. and Y. Yamaguchi (2005). "Analysis of urban heat-island effect using ASTER and ETM+ Data: Separation of anthropogenic heat discharge and natural heat radiation from sensible heat flux." Remote Sensing of Environment 99(1): 44-54.
Miliaresis, G. C. and C. V. Paraschou (2011). "An evaluation of the accuracy of the ASTER GDEM and the role of stack number: a case study of Nisiros Island, Greece." Remote Sensing Letters 2(2): 127-135.
Pareta, K. and U. Pareta (2011). "Quantitative morphometric analysis of a watershed of Yamuna basin, India using ASTER (DEM) data and GIS." International journal of Geomatics and Geosciences 2(1): 248.
Rennó, C. D., et al. (2008). "HAND, a new terrain descriptor using SRTM-DEM: Mapping terra-firme rainforest environments in Amazonia." Remote Sensing of Environment 112(9): 3469-3481.
Rivera, A., et al. (2005). "Ice-elevation changes of Glaciar Chico, southern Patagonia, using ASTER DEMs, aerial photographs and GPS data." Journal of Glaciology 51(172): 105-112.
Sheng, Y. and D. E. Alsdorf (2005). "Automated georeferencing and orthorectification of Amazon basin-wide SAR mosaics using SRTM DEM data." IEEE Transactions on Geoscience and Remote Sensing 43(8): 1929-1940.
Stearns, L. A. and G. S. Hamilton (2007). "Rapid volume loss from two East Greenland outlet glaciers quantified using repeat stereo satellite imagery." Geophysical Research Letters 34(5).
Surazakov, A. B. and V. B. Aizen (2006). "Estimating volume change of mountain glaciers using SRTM and map-based topographic data." IEEE Transactions on Geoscience and Remote Sensing 44(10): 2991-2995.
Toutin, T. (2008). "ASTER DEMs for geomatic and geoscientific applications: a review." International Journal of Remote Sensing 29(7): 1855-1875.