ANALYZING US MAINLAND PRECIPITATION PATTERN CHANGE BASED ON A
KINETICS-BASED GIS METHOD
Kejin Cui1, *
1 Dept. of Geography and GeoInformation Science, George Mason University, Fairfax, VA, United States – [email protected]
KEY WORDS: Precipitation, Kinetics, GIS, Spatio-temporal data model, Divergence, Rotation, Deformation.
ABSTRACT:
Precipitation is a key type of dynamic geographic phenomena. With time changing, precipitation areas can move, merge, split or disappear. Based on existing research methods, this paper applies a kinetics-based GIS method to analyze precipitation patterns in US mainland area. Annual precipitation data of 1950 and 2010 in small spatial resolution are selected for analysis. Three major dynamic changing types are considered for analysis: divergence, rotation and deformation. Objects to analyze transitions are designed, and displacement of precipitation area is calculated. After applying kinetics-based algorithm in precipitation data, conclusions can be made that there are some significant pattern changes in some key areas of US, such as east coast, west coast and Mississippi river area. Dynamic precipitation pattern changes of divergence/convergence, rotation and deformation in different areas of US mainland are analyzed and compared.
1. INTRODUCTION
Precipitation is a key type of dynamic geographic phenomena. With time changing, precipitation areas can move, merge, split, or disappear. Inside one precipitation area, the precipitation amount value can also increase or decrease. Therefore, it is difficult to create model to describe dynamic characteristics of precipitation.
Many different types of methodology have been applied in the analysis of precipitation, such as statistical methods (Adler, 2003) and physical methods (Wilby, 1997). Moreover, with the rapid development of GIS (Geographic Information System), data, information and models can be well integrated and processed, so it becomes possible to represent and analysis more complex geographic phenomena.
This paper will mainly focus on how to use GIS methods to describe dynamic changes of precipitation areas. A kinematics-based algorithm will be developed and applied in the dataset of US mainland. The paper will be organized as follows. Section 2 is literature review. Section 3 is the description of the methodology. Section 4 is the description of datasets. Section 5 is the analysis of the experiment results. Section 6 is the discussion and future work.
2. LITERATURE REVIEW
In existing physical geography research, achievements have been made to identify the relationship between annual precipitation and terrain factors (Barros, 1994). More attention has been focused on the relationship between precipitation and monsoon system (Higgins, 1997) or ocean current (Lau, 1988). For time series analysis of precipitation numeric data, statistical analysis has been widely applied (Xie, 1997; Adler, 2003). The work above uses quantitative methods to create models to describe the relationships. On the other hand, as a type of physics methodology, kinematics-based methods have been applied in analyzing complex geographic phenomena such as temperature (Bothwell, 2010), precipitation (Lang, 2002) and storms(Tsanis, 2001). To further develop modeling and synthesize the relationship between precipitation and other climate factors, dynamic modeling should be applied.
In existing achievements of Geographic Information Science, research has been made on how to use hybrid geographic representation to integrate discrete object and continuous field model (Yuan, 2001). Due to the dynamic characteristics of precipitation phenomena, it is impossible to use either one type of geographic representation to describe precipitation areas. So a hybrid model with both object and field characteristics can be applied to represent dynamic precipitation process.
relationship data model that includes six basic extent evolutions of a spatial object: stability, deformation, expansion/contraction, rotation and translation (Claramunt, 1998). An additional evolution, extent evolution branching (merging or splitting), is suggested by Peuquent (Peuquent, 1999).
In the paper of Bothwell (Bothwell, 2011), a methodology integrated with both physical method and GIS method is designed to represent and analyze spatiotemporal patterns and pattern transitions in very large geographic area and data sets (global scale). The paper implements all of the description of spatiotemporal dynamics above, and extend the implementation from objects to field models. The paper analyzes continuous precipitation areas by defining objects through thresholds and analyzes the internal and external movement patterns of defined objects in space and time. However, the analysis of the paper is based on GCM (General Circulation Models) data, and compares the global precipitation data of 2011 and 2048. So the precipitation data in the year of 2048 is obtained from climate simulation model in GCM datasets, which is not accurate enough.
This paper will refer part of the methodology of the paper of Bothwell (Bothwell, 2011), but the research data will be based on actual precipitation datasets from historical precipitation observation records, not simulation data. The research area will be the United States mainland area, and the spatial scale will be much smaller. With a different research area and spatial scale, some other new conclusions can be seen from analysis results.
3. DATA DESCRIPTION
This paper will use PRISM dataset
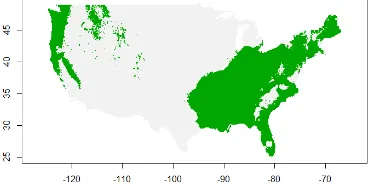
(http://www.prism.oregonstate.edu). Annual precipitation data from two years have been selected: 1950 and 2010. The resolution is 0.0416 degree of latitude and longitude. High precipitation areas are identified as those areas with annual precipitation higher than 1000 millimeters. So this paper will use the kinematic analysis method to compare the high precipitation area between those two time periods. The following two maps are the precipitation area higher than 1000 millimeters (green area) in both 1950 and 2010, respectively.
Figure 1. High Precipitation Area of US mainland in 1950
Figure 2. High Precipitation Area of US mainland in 2010
4. METHOD DESCRITION
4.1 Transition Types of Precipitation Objects
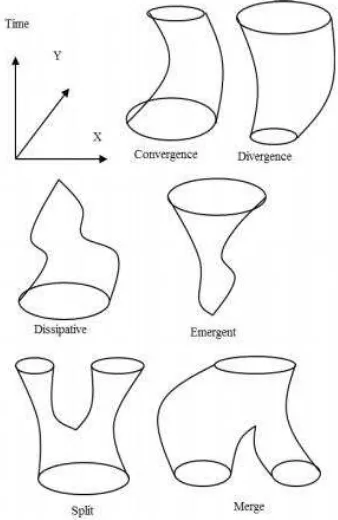
As a special dynamic geographic phenomena, an area of moving precipitation can be conceptualized as an object in a three-dimensional space (x, y, t). x and y represent the spatial location of this object, and t represents time. So this object can describe the transition of a spatial entity, and this transition can be categorized as six major types: emergence, dissipation, convergence, divergence, merging and splitting (Bothwell, 2011).
Emergence: Objects which initially do not exist and then appear later.
Dissipation: Objects which initially exist and then disappear later.
Convergence: Objects which are shrinking in shape with time.
Divergence: Objects which are expanding in shape with time.
Merge: Objects which join into one object later.
Figure 3. A manifold model to represent six basic types of spatiotemporal transitions (Bothwell, 2011)
When examining the typology above, conclusion can be obtained that emergence is a special case of convergence, and dissipation is a special case of divergence. According to the characteristics of our analysis algorithm, the result of divergent objects will be the negative value compared with convergences objects. So in reality model computation, convergence, divergence, emergence and dissipative can be represented by only one formula, such as divergence. Since this paper will not consider splitting or merging, this paper will consider three basic types of transition types: divergence, rotation and deformation transition.
4.2 Kinematic Analysis Method
First, the displacement in the x direction is denoted by u, and the displacement in the y direction is denoted by v. Displacement vectors are used to calculate kinematic parameters at each grid point: � /� , � /� , � /
� , and ∂v/∂y. These vectors can represent velocity changes in x and y direction, and they can be used to represent divergence, convergence and rotation transitions. To calculate d/dx and d/dy, two 3×3 windows will be used as follows:
The two windows above are used to calculate the velocity in x and y direction. To calculate � /� , � /� , � /
� , and ∂v/∂y, the calculation result need to be divided by the distance between the grid location in the x and y directions. According to the book Synoptic Dynamic Meteorology in Midlatitudes (Bluestein 1992), the formula to calculate � /� , � /� , � /� , and ∂v/∂y are as the inward or outward movement towards the target object. A positive � /� along the boundary of an object indicates an outward move towards the object in x direction, so the result should be increase of area in the x direction. Similarly, a negative ∂v/∂y indicates a contraction in y direction.
The basic formula below will be used to calculate the value to judge divergence, rotation and deformation, as listed below (warsi, 2006).
� �� = �� + �� (5)
Positive divergence represents an increase in the region enclosed by an isoline, and negative divergence (convergence) describes a decrease in the region enclosed by an isoline.
� � � = �� −�� (6)
Positive value of rotation means the angular change counter clockwise of the object, and negative rotation value indicates clockwise change of the object.
There are two types of deformation:
� =�� − �� (7)
decrease in y direction. While D2 term describes the sum of the region’s most rapid increase due to stretching along the x=y line and decrease along the y=-x line.
4.3 Calculation of Displacement
This paper will focus on the high precipitation area with annual precipitation amount higher or equal to 1000 millimeters. Precipitation areas are delineated by isohyet areas. Areas in two years, 1950 and 2010 will be compared to calculate the displacement of precipitation areas.
To calculate the displacement in latitude and longitude directions, each high precipitation grid in 1950 will be considered. If this grid location is not in high precipitation at 2010, then the nearest grid with high precipitation in 2010 in both horizontal and vertical directions will be found. The nearest distance in both latitude and longitude directions will be recorded. In longitude direction, if it is east shift, the value will be positive, otherwise negative. In latitude direction, if it is north shift, the value will be positive, otherwise negative.
The calculation above only consider the boundary case when a location with high precipitation in 1950 does not have high precipitation in 2010. For the overlapping areas of high precipitation in both 1950 and 2010, the displacement will be calculated using the nearest neighborhood interpolation method. In latitude direction, the displacement value of a grid will be assigned by the nearest displacement value. The same methods will be followed in longitude direction.
5. EXPERIMENT RESULT ANALYSIS
In this paper, precipitation data in 1950 and 2010 are compared and analyzed. It is assumed that the precipitation pattern was gradually changed from 1950 to 2010. The experiments, including the calculation of displacement and each analysis variable, are performed using R language. Dynamic changes of divergence, rotation and deformation will be identified and compared in depth.
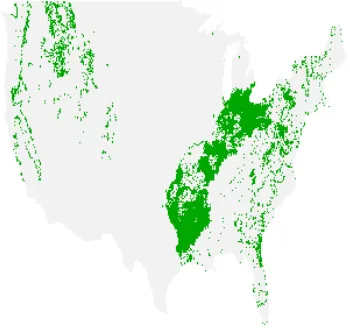
First, for divergence change, the next map shows the overall divergence of high precipitation area. In general the happening of divergence is around the original precipitation area in 1950.
Figure 4. Overall result of divergence change for precipitation pattern
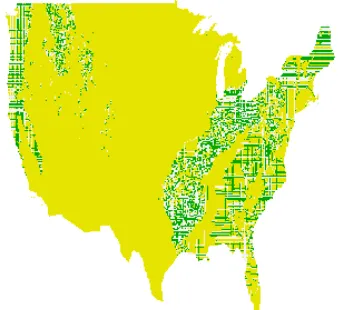
Next map shows the comparison of positive divergence and negative divergence (convergence). The green area is the positive divergence, and the white area is negative area.
Figure 5. Comparison between positive divergence and negative divergence (convergence)
From the comparison, conclusion can be made that there is stronger negative divergence precipitation pattern in western coast area, and there is weakly negative divergence in the drainage area of Mississippi River, where it is in Louisiana, Mississippi and Arkansas State. Negative divergence (convergence) indicates the precipitation area is generally shrinking in recent 60 years. Moreover, in northeast area of US mainland, a strong positive divergence is detected, indicating this area of precipitation is increasing.
Figure 6. Comparison between precipitation divergence of west and east direction
After comparing the west and east direction, the divergence towards west direction (negative value) is much stronger than the east direction (positive value), as shown above. This is because, in the year of 2010, there are some more high precipitation areas in central US states, such as Iowa, Missouri and Illinois. Also the precipitation pattern in Mississippi River area has more west direction divergence, indicating this precipitation area was shifting west in recent 60 years.
Next graph is the pattern of rotation transition, it is a little weak comparing with divergence, especially in west and east coast areas. It indicates the pattern of general atmosphere circulation is remaining the same in west and east coast areas in recent 60 years.
Figure 7. Rotation pattern of US mainland precipitation
The following two maps show the result of two types of deformation. The first map describes clockwise direction,
is no significant geographic pattern for deformation phenomena in each geographic area, but the deformation in clockwise direction is stronger than anticlockwise direction.
Figure 8. Precipitation pattern change of deformation in clockwise direction
Figure 9. Precipitation pattern change of deformation in anti-clockwise direction
6. CONCLUSION
knowledge can be discovered from the newly designed data models. Moreover, some other types of climate variables, such as air pressure, can be integrated and compared with the analysis of this paper.
REFERENCES
Abraham, T., & Roddick, J. (1998). Opportunities for knowledge discovery in spatio-temporal information
systems. Australasian Journal of Information Systems, 5(2).
Adler, R. F., Huffman, G. J., Chang, A., Ferraro, R., Xie, P. P., Janowiak, J., ... & Gruber, A. (2003). The version-2 global precipitation climatology project (GPCP) monthly
precipitation analysis (1979–present). Journal of
hydrometeorology, 4(6), 1147-1167.
Barros, A. P., & Lettenmaier, D. P. (1994). Dynamic modeling of orographically induced precipitation. Reviews of geophysics, 32(3), 265-284.
Bluestein, H. B. (1992). Synoptic-dynamic meteorology in midlatitudes: Volume 1, principles of kinematics and dynamics.
Bothwell, J., & Yuan, M. (2010). Apply concepts of fluid
kinematics to represent continuous space–time fields in
temporal GIS. Annals of GIS, 16(1), 27-41.
Bothwell, J., & Yuan, M. (2011, November). A kinematics-based GIS methodology to represent and analyze spatiotemporal patterns of precipitation change in IPCC A2 scenario. In Proceedings of the 19th ACM SIGSPATIAL International Conference on Advances in Geographic Information Systems (pp. 152-161). ACM.
Claramunt, C., Parent, C., & Thériault, M. (1998). Design
patterns for spatio-temporal processes. In Data Mining and
Reverse Engineering (pp. 455-475). Springer US.
Higgins, R. W., Yao, Y., & Wang, X. L. (1997). Influence of the North American monsoon system on the US summer precipitation regime. Journal of Climate,10(10), 2600-2622.
Lang, T. J., & Rutledge, S. A. (2002). Relationships between
convective storm kinematics, precipitation, and
lightning. Monthly Weather Review, 130(10), 2492-2506.
Lau, K. M., & Sheu, P. J. (1988). Annual cycle, quasi-biennial oscillation, and southern oscillation in global precipitation. Journal of Geophysical Research: Atmospheres (1984-2012), 93(D9), 10975-10988.
Peuquet, D. J. (1999). Making space for time: Issues in
space-time data representation. In Database and Expert
Systems Applications, 1999. Proceedings. Tenth International Workshop on (pp. 404-408). IEEE.
Tsanis, I. K., & Gad, M. A. (2001). A GIS precipitation
method for analysis of storm kinematics. Environmental
Modelling & Software, 16(3), 273-281.
Warsi, Z. U. (2005). Fluid dynamics: theoretical and
computational approaches. CRC press.
Wilby, R. L., & Wigley, T. M. L. (1997). Downscaling general circulation model output: a review of methods and
limitations. Progress in physical geography, 21(4), 530-548.
Xie, P., & Arkin, P. A. (1997). Global precipitation: A 17-year monthly analysis based on gauge observations, satellite estimates, and numerical model outputs. Bulletin of the American Meteorological Society, 78(11), 2539-2558.