Two Phase Flow Imaging Using
Infra Red Tomography
Sallehuddin Ibrahim, Mohd Amri Md Yunus
and Mohd Taufiq Md Khairi
Faculty of Electrical Engineering, Universiti Teknologi Malaysia,
Johor Bahru, Johor, Malaysia [email protected]
Muhammad Abu Bakar Sidik
1,2 1Institut of High Voltage and High Current (IVAT), Faculty of Electrical Engineering,
Universiti Teknologi Malaysia, Johor, Malaysia
2
Department of Electrical Engineering, Faculty of Engineering, Universitas Sriwijaya,
Ogan Ilir, Sumatera Selatan, Indonesia
Abstract—Data on flow regimes is important in measuring and analyzing industrial process flow. This paper presents an investigation on the use of an infra red tomography system using 16 x 16 infra red sensors to monitor solid particles conveyed by a pneumatic conveyor in a vertical gravity flow rig. The sensor output is processed by a signal conditioning circuit followed by a data acquisition system before being displayed by a computer. The operation of the whole measurement is controlled by a digital timing controller. Four types of flow models i.e. single pixel, multiple pixels, half flow and full flow were experimented with. The system has been tested with solid particles at various flow rates using several algorithms and has shown to be capable of providing images of the flow concentration profiles.
Keywords—flow; image; infra red; tomography
I. INTRODUCTION
Tomography derives from the two Greek words i.e. tomo which means slice and graph which means picture [1]. The history of tomography dated back to the discovery of x-ray. The discovery of x-ray by Wilhelm Roentgen in 1895 proved to be a significant contribution in modern medicine. Such invention enabled us to probe both non-living and living objects without invading the subject itself [2]. However this type of projection still has some flaws as the images were formed by superimposing all planes normal to the direction of X-ray propagation. Beginning from 1930s conventional tomography made use of the tomographic method based on the X-ray radiation which provided two and three dimensions of images [3]. In the late 1960s the use of tomography attracted the interest of those in the process industries including those involved in flow measurement [3]. They began to explore ways of exploiting tomography to extract vital data on flow.
In multi-phase flow measurement both the phase distribution fluctuates with temporal and spatial resolution. This occurred because various phases positioned themselves in various manners. The flow regimes are mainly functions of the volumetric fluxes of all phases. The flow regimes are functions of velocities or pressure drops and are shown as flow profiles. Information on flow profiles is valuable in
designing heat and mass transfer equipment and in designing fluid-based conveying processes.
There are various methods for measuring two phase flow. Nonetheless, it is important that sensors being employed for measurement purposes do not in any way perturb the flow being measured. The use of point sensors are not suitable as they disturb the flow. Non-intrusive techniques has the advantage of not altering the flow regime and they are suitable for laboratory as well as industrial tests.
An infra red tomography system can be utilized to obtain the spatial distribution of materials with various optical densities in a volume. This paper describes the results of concentration measurements of solid particles in a vertical flow rig using an infra red tomography system. The infra red tomography system is utilized to reconstruct images obtained from several sensors placed around the measurement section of a hydraulic flow rig. Various materials resulted in different values of attenuation and it is this concept that is utilized in optical tomography. Data on the optical characteristics of a flow can be obtained if a view comprising an optical transmitter and receiver pair are located opposite of each other of the measurement section. By combining several views in order to form a projection a larger area can be interrogated. Useful images of the flow can be reconstructed if several different projections are used.
II. SYSTEM CONFIGURATION
The tomography system utilized 16 x 16 set of infra red sensors configured in orthogonal and diagonal parallel position with each having 16 sensors installed outside a flow pipe with an outer diameter of 82mm and an inner diameter of 78mm as shown in Fig. 1. Both the orthogonal projection has 32 sensors and the diagonal projection has an identical number of sensors i.e. 32 sensors. The sensors are arranged in a parallel manner to create two upstream and downstream sensing arrays with four parallel projections (at angles of 0°, 45°, 90°, and 135°) with 16 pairs of sensors for each projection. The distance between the upstream sensors and the downstream sensors is 0.1 meter. This value of distance was chosen based on the value of the sampling rate utilized in the
Proc. of 2015 2ndInt. Conference on Information Technology, Computer and Electrical Engineering (ICITACEE), Indonesia, Oct 16-18th
experiment. The light emitter is represented by an infra-red LED connected to an optical fibre. The pipe is mapped onto a map having a resolution of 16 x 16 pixels.
Fig. 1. The arrangement of the infra red sensors
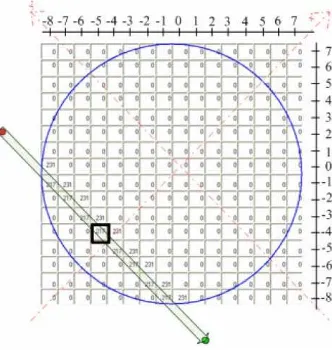
Each light projection has its own sensitivity map represented by a sensitivity matrix. As an example is the light ray from a light emitter labelled transmitter 18 to light receiver 18 as shown in Fig. 2. The equation for each light projection can be represented as
(1) where
S (x,y) = sensitivity map for each projection
Mx’, (x,y) = sensitivity map for view of x’ at projection
Fig. 2. Light projection from transmitter to receiver
The reconstructed image may contain information on the cross-sectional profile of the constituent parameter of the object; as an example, the permittivity distribution for an electrical capacitance system [4]. The projection data is the total of line integrals of the normal straight-line paths [5]. The projection data will be the base data for the image to be reconstructed. Hence, the value of the projection data is equal to the measured amplitude of signal loss from receiver from Tx to Rx view.
Vs
Tx Rx = amplitude of signal loss from receiver from transmitter Tx to Rx view)
'
(
x
p
φ = projection dataFor all projections, the contributions to the point (x,y) are summed and multiplied with its computed sensitivity. This mechanism is termed the linear back projection (LBP) algorithm. It is also termed both the summation method and the back projection method. The discrete back projection can be expressed as [6]:
(3)
= approximation of the object function in volts
)
Vs
φ
= amplitude of signal loss of receiver from transmitter Tx to Rx view which is equal to projection data= normalized sensitivity map for each projection
m
φ
= the m-th projections angle 'n
x
= receiver n-th positionφ
∆
= angular distance between projection and the summation extends over all the M-th projectionN = total number of receivers M = total number of projections
In the frequency domain the projection data is filtered utilzing certain windowing function/filter kernel prior to the reconstruction of the image [6]. The method is termed the CBP method (Convolution Back Projection) and it is the most widely used method in computer tomography for parallel beam projection data [7]. The filter kernel utilized in the frequency domain can suppress the highest spatial frequency and reduced the noise created by aliasing [8]. Nonetheless if the number of sensors utilized are small, an aliasing effect will occur which distorts the images. Hence in order to decrease the aliasing phenomenon a filtering process is applied to the filtered image using the filters in the frequency domain. The Combined Filtered Linear Back Projection (CFLBP) algorithm combines the Hamming and Spatial filtered linear back projection algorithm. The hybrid linear back projection (HLBP) reconstruction algorithm determines the position of projection data and improved the reconstructed image by zeroing the empty space while reconstructing an image [9].
III. MEASUREMENT
The operation of the whole measurement is controlled by a digital timing controller (Fig. 3). The peak voltages received
Proc. of 2015 2ndInt. Conference on Information Technology, Computer and Electrical Engineering (ICITACEE), Indonesia, Oct 16-18th
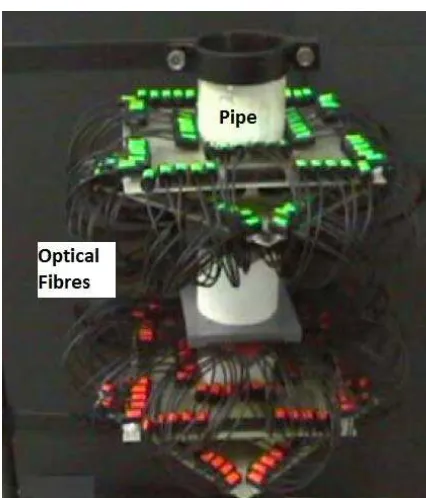
by photodiodes are equal to a level of infrared light intensities and consequently relative to the two different components (solid and air) in the process/pipe traversed by the infra-red beam. The analog signal is processed by a signal conditioning circuit. Then this analog signal is digitized by the data acquisition system, which is also controlled by the digital controller’s synchronization signals. The actual measurement system is shown in Fig. 4.
Fig. 3. The measurement system
Fig. 4. The actual measurement system
Several experiments were carried out by dropping plastic beads into a gravity flow rig in which the infra red tomography system was installed around it. Each bead has a 3.3 mm mean size. The beads were conveyed using an automatic loader from a tank via a material vane and is will stop when the hopper is full. A rotary valve connected to an ac motor controlled the flow rate of the beads.
Four types of flow models were experimented i.e. single pixel flow, multiple pixels flow, half flow and full flow. In the single pixel flow, the object in the pipe theoretically is located in only one pixel whereas in the multiple pixels flow, the object in the pipe is located in four different pixels. In the half flow model, the object dropped in the pipe initially occupied half of the pipe as shown in Fig. 5. In the full flow model, the objects dropped inside the pipe occupy the whole pipe.
Fig. 5. Top and side views for a half flow model inside the pipe
IV. RESULTS AND DISCUSSION
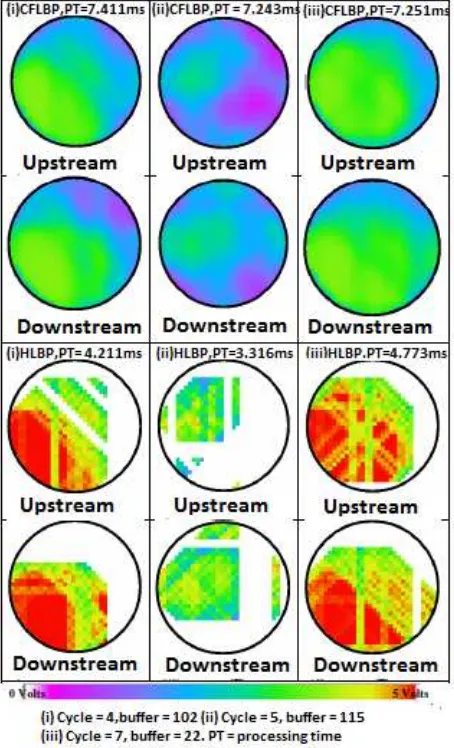
Experiments were carried out utilizing several algorithms and were carried out at various flow rates. Analysis from the results of the experiments were performed to determine the best resolution and reconstruction algorithms. Samples of the results are shown in Fig. 6. The processing time is represented by PT. The Combined Filtered Linear Back Projection (CFLBP) and the Hybrid Linear Back Projection (HLBP) algorithms have 32 x 32 pixels resolution. Fig. 6 shows the concentration profiles that represent the upstream and downstream selected samples of reconstructed half-flow images using the CFLBP and the HLBP algorithms at a flow rate of 93 gs-1. The images do not display a perfect half flow as the flow diverge slightly after it passed through the obstruction. The images obtained using the CFLBP algorithm resulted in smearing effect on the images and as a result it is difficult to observe the half flow. Compared to the CFLBP algorithm, the HLBP algorithm resulted in better images of the half-flow. It can be seen in Fig. 6 that the two-phase solid-air flow were forced to converge at the left-hand side of the flow pipe.
Proc. of 2015 2ndInt. Conference on Information Technology, Computer and Electrical Engineering (ICITACEE), Indonesia, Oct 16-18th
Fig. 6 Concentration profiles for half flow at a flow rate of 93gs-1
ACKNOWLEDGMENT
The authors would like to acknowledge the financial assistance from Universiti Teknologi Malaysia and the Education Ministry in providing the research grant 05H67 which enabled this project to be carried out successfully.
REFERENCES
[1] S.Z. Mohd. Muji, R. Abdul Rahim, M.F. Abdul Shaib, N.S.Mohd Fadzil, M.H. Fazalul Rahiman, and Z. Zainal Abidin, “Optical Tomography: The potential of mass flow rate in rice industry,” Sensors and Actuators, B: Chemical, vol. 213, pp. 508-514, 2015.
[2] U. Ellenberger, B. Soom, and J. E. Balmer, “Characterization of an X-ray streak camera at 18.2 nm”, Measurement Science & Technology , vol. 4. no. 8, pp. 874-880, 1993.
[3] M.S. Beck and R. Williams, Process Tomography: Principles, Techniques and Applications, Butterworth-Heinemann, 1995.
[4] T.C. Chandrasekera, Y. Li, D. Moody, M.A. Schnellmann, J.S. Dennis, and D.J. Holland, Chemical Engineering Science, vol. 126, pp. 679-687, 2015.
[5] B.S. Hoyle, and L.A. Xu, Ultrasonic sensors in Williams R.A. Beck M.S. ed. Process Tomography: Principles, Techniques and Applications, Butterworth-Heinemann, 1995.
[6] B. Brown, R. Smallwood, D. Barber, P. Lawford and D. Hose, Medical Physics and Biomedical Engineering, Institute of Physics Publishing, Bristol. 1999.
[7] T. Gabor Herman, Image Reconstruction from Projection, New York: Academic Press, 1980.
[8] S. Webb, The Physics of Medical Imaging, Bristol: Institute of Physics Publishing, 1992.
[9] S. Ibrahim, Measurement of Gas Bubble in a Vertical Water Column Using Optical Tomography, Sheffield Hallam University, PhD Thesis, 2000.
Proc. of 2015 2ndInt. Conference on Information Technology, Computer and Electrical Engineering (ICITACEE), Indonesia, Oct 16-18th
()