From Missing Source to Missing Sink: Long-Term Changes in the
Nitrogen Budget of a Northern Hardwood Forest
Ruth D. Yanai,
†Matthew A. Vadeboncoeur,
‡Steven P. Hamburg,
§Mary A. Arthur,
∥Colin B. Fuss,
⊥Peter M. Gro
ff
man,
@Thomas G. Siccama,
#and Charles T. Driscoll
*
,⊥†
College of Environmental Science and Forestry, State University of New York, Syracuse, New York 13210, United States ‡
Earth Systems Research Center, University of New Hampshire, Durham, New Hampshire 03824, United States
§
Environmental Defense Fund, Boston, Massachusetts 02108, United States
∥
Department of Forestry, University of Kentucky, Lexington, Kentucky 40546, United States
⊥
Department of Civil and Environmental Engineering, Syracuse University, Syracuse, New York 13244, United States
@Cary Institute of Ecosystem Studies, Millbrook, New York 12545, United States
#
School of Forestry and Environmental Studies, Yale University, New Haven, Connecticut 06511, United States
*
S Supporting InformationABSTRACT: Biogeochemical monitoring for 45 years at the Hubbard Brook Experimental Forest in New Hampshire has revealed multiple surprises, seeming contradictions, and unresolved questions in the long-term record of ecosystem nitrogen dynamics. From 1965 to 1977, more N was accumulating in living biomass than was deposited from
the atmosphere; the “missing” N source was attributed to biological
fixation. Since 1992, biomass accumulation has been negligible or even
negative, and streamwater export of dissolved inorganic N has
decreased from ∼4 to ∼1 kg of N ha−1 year−1, despite chronically
elevated atmospheric N deposition (∼7 kg of N ha−1 year−1) and
predictions of N saturation. Here we show that the ecosystem has
shifted to a net N sink, either storing or denitrifying∼8 kg of N ha−1
year−1. Repeated sampling over 25 years shows that the forestfloor is
not detectably accumulating N, but the C:N ratio is increasing. Mineral soil N has decreased nonsignificantly in recent decades,
but the variability of these measurements prevents detection of a change of <700 kg of N ha−1. Whether the excess N is
accumulating in the ecosystem or lost through denitrification will be difficult to determine, but the distinction has important
implications for the local ecosystem and global climate.
■
INTRODUCTIONThe northeastern United States has been experiencing elevated
atmospheric N deposition for decades.1−4 In the late 20th
Century, chronically elevated N deposition was recognized as a potential threat to terrestrial and aquatic ecosystems.1,2,5−7This
chronic N fertilization could be expected to increase forest growth and carbon sequestration (e.g., ref 8), although the
magnitude of this impact is under considerable debate.9−12
Excessive N inputs were predicted to eventually lead to a
condition of N saturation,2 in which forest ecosystems no
longer sequester added N, with consequent losses of dissolved N to aquatic ecosystems and decreases in forest productivity.
Chronically elevated N deposition is theorized to induce a series of changes in ecosystem processes, including increases in foliar and soil N, decreases in soil C:N ratio, increases in the net production of nitrate in soil, and increased leaching of N,
largely nitrate, in streamwater.2,13,14 Detecting these changes
requires long-term observations of a wide range of ecosystem characteristics, including vegetation and soil stocks and
precipitation and streamwater fluxes. Biogeochemical data
from the Hubbard Brook Experimental Forest in New Hampshire provide a unique opportunity to characterize and quantify long-term changes in ecosystem N cycling under chronically elevated N deposition, challenging some long-held assumptions and predictions.
■
MATERIALS AND METHODSSite Description: Hubbard Brook Watershed 6. Water-shed 6 is the designated biogeochemical reference at the Hubbard Brook Experimental Forest (HBEF). This 13 ha area has not been cut since a moderate salvage logging following the 1938 hurricane, prior to which the forest had been cut over for
red spruce (Picea rubensSarg.) in the 1890s and for hardwoods
Received: June 10, 2013
Revised: September 12, 2013
Accepted: September 19, 2013
Published: September 19, 2013
and spruce between 1909 and 1917.15 The elevation of this watershed ranges from 550 to 790 m. The dominant tree
species are sugar maple (Acer saccharum Marsh.), American
beech (Fagus grandifolia Ehrh.), and yellow birch (Betula
alleghaniensisBritt.). Above 750 m elevation, dominance shifts
to paper birch (Betula papyrifera Marsh.), balsam fir (Abies
balsameaL.), and red spruce. Soils are primarily coarse-loamy, mixed, frigid, Typic Haplorthods. Precipitation, streamwater, and vegetation have been monitored since the 1960s. In this
paper, we report forestfloor data sampled every 5 years from
1977 to 2002. Samples collected in 1976 and 1977 were combined to form a single sample set comparable in size to the later collections.
Other White Mountain Sites.Forestfloors were sampled from 1979 to 2003 in stands of northern hardwoods in the
central White Mountains of New Hampshire.16In this study,
we report forest floor data from the six mature stands [>55
years of age at the time of the most recent sampling (Table 2)]. Elevations of these sites ranged from 320 to 580 m. The tree species with the greatest basal area were American beech,
yellow birch, paper birch, sugar maple, red maple (Acer rubrum
L.), and white ash (Fraxinus americana L.). Soils were
predominantly coarse-loamy, mixed, frigid, Typic Haplorthods.
Forest Floor Collection and Processing. Methods of
forestfloor collection differed slightly between Hubbard Brook
and the other White Mountain sites. At Hubbard Brook Watershed 6, sampling points were randomly selected within three elevation bands, with no more than one sample per 25 m
× 25 m plot. The number of samples collected varied by
sampling date, ranging from 57 to 100.17 Samples were
collected using a 15 cm×15 cm template, which defined the
vertical faces of the forestfloor block. The surrounding soil was
removed until the mineral soil was exposed, leaving a pedestal
with the forestfloor on top. The block was then removed and
inverted and the mineral soil removed from the bottom of the sample.17
In the 1987 and later collections, the Oa was separated from the Oie before further processing; at the earlier sampling dates
reported here, the forestfloor was processed as a single sample.
When the Oa was collected separately from the rest of the
forestfloor, the Oa was air-dried. Twigs and roots larger than 7
mm in diameter were removed, and the rest of the sample was
oven-dried at 80°C to constant mass, weighed, milled to pass a
2 mm screen, and archived. Samples were analyzed for C and N within a few years of collection, with a few samples analyzed up to 29 years postcollection (information about the Hubbard Brook sample archive is available at http://www.hubbardbrook. org). Note that the Oa horizons collected by this method likely include some A-horizon material, based on the organic matter content.17
In the six other White Mountain sites (Table 2), forestfloor
samples were collected in 1979 and 1980 and in 1994 and
1995; three sites were sampled again in 2003. Ten 10 cm×10
cm forestfloor samples were collected along each offive or six
transects using the pin block method.17A template was placed
on the ground, and steel pins were pushed into the soil to
define the column to be sampled. The column was excavated
and trimmed to the dimensions defined by the pins, and the
mineral soil was removed from the bottom of the block. Sampling points on rocks or stumps counted as zeros. Blocks were composited by line for analysis of mass and nutrient contents. These samples were air-dried, sieved, weighed,
subsampled for moisture content, and then stored for up to 15 years before being further analyzed.
Forest Floor Analysis.To determine the C and N content
of forest floors in Hubbard Brook Watershed 6, archived
samples dating from 1976 to 2002 were subsampled, 5% of them in triplicate to assess methodological precision. Samples were analyzed for C and N on a CE Instruments model NC2100 elemental analyzer. Replicate analyses indicate an
analytic precision of approximately ±5% of each value.
Reference samples were analyzed every 10th sample to assess accuracy; the root-mean-square (rms) error was 3% for N and 2% for C.
Samples from the 1979 and 1980 collections and the 1994 and 1995 collections from the other White Mountain sites were
analyzed together to minimize the risk of systematic differences
in chemical analysis using a LECO CN 2000 instrument (LECO Corp., St. Joseph, MN). Samples from 2003 were analyzed at a later date also on a LECO CN 2000 instrument.
Statistical Analysis of Forest Floor Repeat Measures.
We combined the data from 1976 and 1977 to provide a sample size comparable to the sample sizes of data from later dates. We
report mean C and N content per unit area of forestfloor at
Hubbard Brook Watershed 6 and 95% confidence intervals
[±1.96 standard errors (see the Supporting Information)]. The
C:N ratio for each sampling date was calculated as the ratio of mean C to mean N, not the mean of the ratios for each sampled point, consistent with the watershed-scale budget. Trends in N content, C content, and C:N ratio were analyzed using linear regression for the watershed means. All observations were used; omitting outliers changed the means but did not markedly affect the trends.
For the six additional sites in the White Mountain National Forest, we found the change over time for each stand using linear regression and described all six using the mean slope of
the regression and the 95% confidence interval on the slope
(Table 2). Similarly, for the C:N ratio, we used linear regression
to find the slope and reported the mean slope and 95%
confidence interval.
Mineral Soil N Calculations. There are two long-term
mineral soil N data sets at and near Hubbard Brook. Thefirst is
from Watershed 5, adjacent to Watershed 6, and consists of spatially paired 0.5 m2quantitative pits excavated at 59 distinct
sites across the watershed, with thefirst set excavated prior to
whole-tree harvesting in 1983 and the second excavated 15 years later. We compared mean mineral soil N content after removing outliers [samples more than three standard deviations (SDs) from the mean in mineral soil C or N content]. The
variance of the difference in mean N content was calculated by
summing the variances of the two data sets (n= 57 in 1983;n=
58 in 1998).
In three second-growth postagricultural stands (35−90 years
of age) 10 km south of Hubbard Brook, soils were sampled in the same manner as at Watershed 5 in three pits per stand in
198018and 2005. Mean soil N stock changes were calculated
using stand as the experimental unit; the reported confidence
interval reflects the variance among stands in the difference in
mean N content between the two sampled years.
Changes were reported as nonsignificant at anαlevel of 0.10.
N Budget Calculations. The N budget for Watershed 6 (Table 1 and Figure 3) was assembled using long-term data
collected at the HBEF. Annual hydrologicfluxes were based on
a June 1 water year using hydrological data provided by the U.S.
(http://www.hubbardbrook.org). Stream fluxes of dissolved inorganic N (DIN) were calculated using daily discharge and weekly concentrations, using the average concentration of the preceding and following measurements for the intervening
days. Bulk precipitation fluxes of DIN were based on weekly
collections. Changes over time in analytical methods were
detailed by Buso et al.;21when changes were made, instruments
were run in parallel to ensure consistency in the long-term record.
Stream-dissolved organic N (DON) was calculated from analysis of total dissolved nitrogen minus DIN on samples
collected monthly22 (http://www.hubbardbrook.org). Stream
DON fluxes prior to 1992 when measurements began were
assigned the average annualflux from 1992 to 2007.23Similarly,
precipitation DON fluxes prior to 1997 were assigned the
average annualflux from 1997 to 2007.
Dry N deposition includes gaseous ammonia, nitric acid vapor, and particulate nitrate and ammonium. We have estimates of the atmospheric concentrations of the latter three N species at Hubbard Brook through the U.S. Environmental Protection Agency CASTNET program (http://epa.gov/castnet), which uses a modeled deposition
velocity.24 The ratios of dry to bulk deposition of oxidized,
reduced, and total N have not changed significantly from 1990
to present (see the Supporting Information). To estimate dry N deposition, we used the linear relationship between dry and wet inorganic N deposition based on the CASTNET record (see the Supporting Information).
Fluxes of N in soil solution draining the Oa and Bs soil
horizons were calculated by assuming vertical flow and
partitioning water loss by evapotranspiration by the horizontal
distribution of fine root biomass22 for the years 1992−2008.
The uncertainty [95% confidence interval (CI)] was estimated
from interannual variability.
Total biomass was estimated using the Watershed 6 biomass
calculator.25This is an improvement over the method used to
estimate biomass accumulation in the original N budget, which
was based on tree ring analysis.26Standing dead trees were not
measured in 1977; to estimate their biomass, we interpolated
between 1965 and 1982. Woody debris accumulation27 was
estimated using data from the same regional sites where the
forestfloor data were taken (Table 2).
In the case of denitrification, we converted the missing N
sink of 8.4 kg of N ha−1 year−1 (1992−2007, Table 1) to a
greenhouse gas equivalent based on a N2O:N ratio of 15%28
and the IPCC GWP (100 years) of 298. For the case of an N sink in the soil, we estimated the C sink associated with an N
sink in the soil by assuming a C:N ratio of 20.29
■
RESULTS AND DISCUSSIONMissing Nitrogen Source: 1965−1977.In the early years of ecosystem monitoring at Hubbard Brook, from 1965 to 1977, the living vegetation was an active sink for N, largely because of the accumulation of biomass in the second-growth northern hardwood forest. In fact, the rate of N accumulation
in living biomass (9 kg of N ha−1year−1, estimated from tree
cores) was greater than could be explained by atmospheric N
inputs. The forestfloor was also thought to be accumulating N
at the rate of 8 kg of N ha−1 year−1.30 Thus, the original
Hubbard Brook N budget presented by Bormann et al.26
reported a missing source of 14 kg of N ha−1year−1, which was
attributed to biological N fixation. Subsequent measured N
fixation, however, was found to be 1 order of magnitude smaller
than this budget discrepancy.31
An alternative explanation for the missing N source is a net
flux of N from the mineral soil. This mechanism is difficult to
evaluate because a change of this magnitude in the mineral soil N stock would be nearly impossible to measure directly. Organic N stocks in the mineral soil are very large and
heterogeneous (5900 kg of N ha−1; SD of 270032), representing
more than 70% of the total ecosystem N stock (Figure 1).
Huntington et al.32 estimated that the minimum detectable
change in the mineral soil would be 730 kg of N ha−1, using 60
pits each 0.5 m2in area. Thus,∼50 years would be required to
detect a change in soil N storage of 14 kg of N ha−1year−1. Living Biomass Is No Longer a Nitrogen Sink. From 1965 to 1977, forest growth was vigorous, and biomass
accumulation of N was 17 kg of N ha−1year−1. From 1977 to
1992, the net accumulation of live and standing dead biomass slowed, averaging 3.7 kg of N ha−1year−1. Since 1992, mortality
has exceeded growth with a net loss averaging 4.5 kg of N ha−1
year−1 (Table 1). The biomass of the reference watershed is
based on a complete census of more than 12000 trees every 5 years since 1977, a sample of tree heights, and allometric equations developed at this site relating tree diameter and
height to biomass.33 While the uncertainty caused by the
allometric relationships can be readily quantified (0.5−1.0 kg of N ha−1year−1),34changes in the N concentrations of tissues are
not well-known. The N content of vegetation has been calculated using concentrations measured in trees sampled in
1966 and 1967.35In 1983, the aboveground vegetation on three
0.25 ha plots, measured by whole-tree removal and chipping,36
had a total N content only 8% greater than that calculated using
the 1965−1967 N concentrations and allometric equations,
which suggests that any change in N content in the vegetation resulting from a changing concentration in tissues between 1965 and 1985 has been small (1.6 kg of N ha−1year−1). Foliar
N concentrations have been monitored since 1992,37and the
1965 values35 are within the range of current interannual
variation. Roots, branches, and wood represent larger N stocks but have not been systematically monitored over time.
Atmospheric Inputs and Streamwater Outputs: The Missing Sink. Hubbard Brook Experimental Forest has a continuous record of bulk precipitation and stream chemistry
dating from the early 1960s.38,39Bulk deposition of nitrate plus
ammonium (DIN) averaged∼7 kg of N ha−1year−1from 1965
to 2007 (Table 1), which was similar to other observations in
the northeastern United States.4,5,23 As expected from the
relatively high atmospheric deposition, streamwater export of DIN increased from the 1960s to the mid-1970s, approaching the rate of precipitation input. Surprisingly, streamwater DIN
fluxes decreased thereafter, averaging 0.8 kg of N ha−1 year−1
from 1992 to 2007. This decrease in stream nitrate preceded the recent decline in atmospheric nitrate deposition due to controls on nitrogen oxide emissions from power plants that
came into effect in 200340 (Table 1). Similar decreases in
streamwater NO3− concentrations between the 1970s and
1990s have been observed in other mature forests throughout
the region.41−43These ecosystems appear now to be retaining
∼6 kg of N ha−1year−1, or >90% of incoming DIN. Including
dry deposition (∼0.4 kg of N ha−1 year−1) and DON in the
budget, we found atmospheric inputs exceeded streamwater
export by 5−9 kg of N ha−1year−1since 1992 (Table 1). This
trend challenges the theory of impending N saturation, which
predicts increasing streamwater losses of N.2,44
The Forest Floor as Putative Sink. In the original N
budget for Watershed 6 at Hubbard Brook,26 the forest floor
was considered to be a strong N sink (7.7 kg of N ha−1year−1),
based on a chronosequence study by Covington.30However,
the hypothesis that the forestfloor loses and then regains mass
and nutrient content after harvesting has not been substantiated
experimentally or theoretically.45We tested the hypothesis that
the N concentration and content of the forest floor have
increased in recent decades. At Hubbard Brook Watershed 6,
the forestfloor has been sampled every 5 years from 1977 to
2002, allowing a 25 year analysis of changes in N content,
reported here for thefirst time.
Forest floor N content averaged 1800 kg of N ha−1 in
Watershed 6 and did not change significantly between 1977 and
2002 (linear regressionp= 0.84; Figure 2a; see Figure SI.1 of
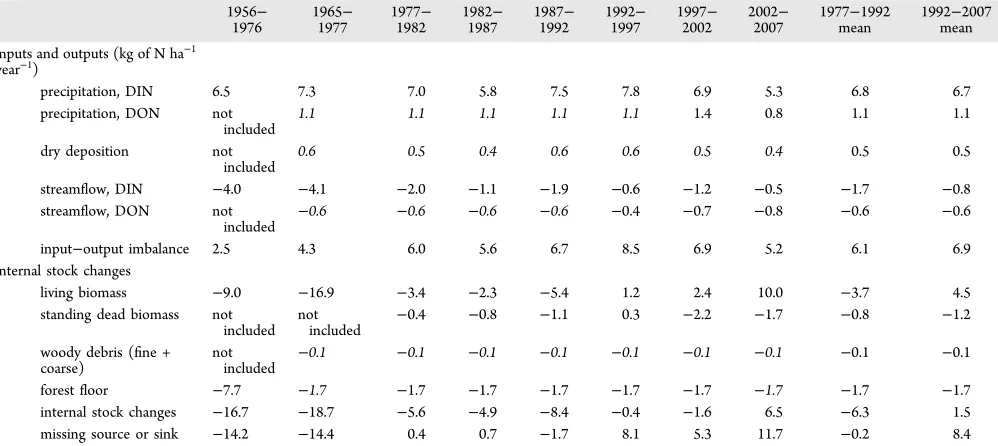
Table 1. Mass Balance of N (kilograms of N per hectare per year) in Watershed 6 of the Hubbard Brook Experimental Forest over Various Time Intervalsa
1956−
1976 19651977− 19771982− 19821987− 19871992− 19921997− 19972002− 20022007− 1977mean−1992 1992mean−2007 inputs and outputs (kg of N ha−1
year−1)
precipitation, DIN 6.5 7.3 7.0 5.8 7.5 7.8 6.9 5.3 6.8 6.7
precipitation, DON not
included 1.1 1.1 1.1 1.1 1.1 1.4 0.8 1.1 1.1
dry deposition not
included 0.6 0.5 0.4 0.6 0.6 0.5 0.4 0.5 0.5
streamflow, DIN −4.0 −4.1 −2.0 −1.1 −1.9 −0.6 −1.2 −0.5 −1.7 −0.8
streamflow, DON not
included
−0.6 −0.6 −0.6 −0.6 −0.4 −0.7 −0.8 −0.6 −0.6
input−output imbalance 2.5 4.3 6.0 5.6 6.7 8.5 6.9 5.2 6.1 6.9
internal stock changes
living biomass −9.0 −16.9 −3.4 −2.3 −5.4 1.2 2.4 10.0 −3.7 4.5 standing dead biomass not
included notincluded −0.4 −0.8 −1.1 0.3 −2.2 −1.7 −0.8 −1.2 woody debris (fine +
coarse) notincluded
−0.1 −0.1 −0.1 −0.1 −0.1 −0.1 −0.1 −0.1 −0.1
forestfloor −7.7 −1.7 −1.7 −1.7 −1.7 −1.7 −1.7 −1.7 −1.7 −1.7
internal stock changes −16.7 −18.7 −5.6 −4.9 −8.4 −0.4 −1.6 6.5 −6.3 1.5 missing source or sink −14.2 −14.4 0.4 0.7 −1.7 8.1 5.3 11.7 −0.2 8.4
aPositive values are releases of N from the ecosystem; negative values are inputs of N into the ecosystem or increases in ecosystem stocks. Thefirst
column shows the 1956−1977 budget published in ref 26, followed by our estimate for a similar time period, including additional data. Fluxes and stock changes shown in italics are estimated rather than measured. The 1997−2002 pentad includes high N export in streams following the 1998 ice storm.
Figure 2.(a) Nitrogen content of the forestfloor as a whole and the
Oie horizon alone (when sampled separately), at Hubbard Brook Watershed 6. Error bars show 95% CIs for the mean. Total forestfloor
regression: slope of 1.7±19.2 kg of N ha−1year−1(95% CI for the
slope);p= 0.84;R2= 0.01. Oie only: slope of−0.2±19.6 kg of N
ha−1year−1;p= 0.96;R2= 0.001. (b) C:N ratio on the forestfloor.
Total forestfloor: slope of 0.03±0.03;p= 0.05;R2= 0.65. Oie: slope
the Supporting Information). No sampling date had N content statistically distinguishable from that of any other date. On
average, the N content increased 2 kg of N ha−1 year−1;
however, the 95% CI on the regression slope ranged from−21
to 24 kg of N ha−1year−1, and theR2of the regression was 0.01.
The forest floor was collected in multiple layers at most
sampling dates, usually the Oie (the litter and fermented layers)
and Oa (humic layers).17The boundary between the Oa and
the mineral soil is difficult to determine in thefield, and forest
floors tend to be sampled to greater depths when soils are
wetter, as in 1992, because mineral particles are harder to
distinguish when wet.17 It is not surprising, therefore, that
interannual variation in N content was lower in the Oie
horizons than in the forestfloor as a whole (Figure 2a). The
change in the N content of the Oie alone was an insignificant
decrease of−0.2±19.6 kg of N ha−1year−1[p= 0.96; R2=
0.001 (Figure 2a)] of a total of 680 kg of N ha−1.
Similarly, the C content of the forest floor of Watershed 6
showed no significant trend. Over time, the C content averaged
37 Mg of C ha−1, with a minimum of 33 Mg of C ha−1in 1987
and a maximum of 43 Mg of C ha−1in 1992. The trend was an
insignificant increase of 0.10±0.50 Mg of C ha−1year−1. The
C content of the Oie alone averaged 14 Mg of C ha−1with an
insignificant gain of 0.05 ± 0.35 Mg of C ha−1 year−1.
Surprisingly, the C:N ratio in the forestfloor increased slightly
over the 25 year period, from 19.8 in 1977 to 20.9 in 2002
(Figure 2b). The increase in the C:N ratio was 0.03±0.03 g of
N (g of C)−1 year−1 [linear regression p = 0.05; R2 = 0.65
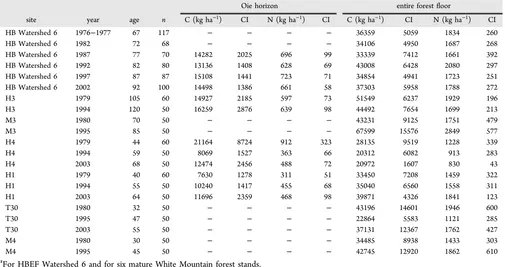
Table 2. Forest Floor C and N Dataa
Oie horizon entire forestfloor
site year age n C (kg ha−1) CI N (kg ha−1) CI C (kg ha−1) CI N (kg ha−1) CI
HB Watershed 6 1976−1977 67 117 − − − − 36359 5059 1834 260
HB Watershed 6 1982 72 68 − − − − 34106 4950 1687 268
HB Watershed 6 1987 77 70 14282 2025 696 99 33339 7412 1661 392
HB Watershed 6 1992 82 80 13136 1408 628 69 43008 6428 2080 297
HB Watershed 6 1997 87 87 15108 1441 723 71 34854 4941 1723 251
HB Watershed 6 2002 92 100 14498 1386 661 58 37303 5958 1788 272
H3 1979 105 60 14927 2185 597 73 51549 6237 1929 196
H3 1994 120 50 16259 2876 639 98 44492 7654 1699 213
M3 1980 70 50 − − − − 43231 9125 1751 479
M3 1995 85 50 − − − − 67599 15576 2849 577
H4 1979 44 60 21164 8724 912 323 28135 9519 1228 339
H4 1994 59 50 8069 1527 363 66 20312 6082 913 283
H4 2003 68 50 12474 2456 488 72 20972 1607 830 43
H1 1979 40 60 7630 1278 311 51 33450 7208 1459 322
H1 1994 55 50 10240 1417 455 68 35040 6560 1558 311
H1 2003 64 50 11696 2359 468 98 39871 4326 1841 123
T30 1980 32 50 − − − − 43196 14601 1946 600
T30 1995 47 50 − − − − 22864 5583 1121 285
T30 2003 55 50 − − − − 37131 12367 1762 427
M4 1980 30 50 − − − − 34485 8938 1433 303
M4 1995 45 50 − − − − 42745 12920 1862 610
aFor HBEF Watershed 6 and for six mature White Mountain forest stands.
(Figure 2b)]. This trend runs counter to expectation if the
forestfloor is a net sink for N and counter to the theory about
the long-term trajectory of the forest floor under N
saturation.2,44For the 15 years of separate Oie measurements,
the change in the C:N ratio was also positive [0.08±0.12 g of
N (g of C)−1year−1;R2= 0.81;p= 0.10 (1987−2002)]. The
causes of the long-term increase in forestfloor C:N ratio are
not clear but might be related to increases in atmospheric CO246,47or decreases in decomposition rates associated with N
addition,48which may result from inhibition of lignin-degrading
microbial enzymes.49,50
In six additional mid- to old-age northern hardwood stands
in the White Mountain region, forest floors were sampled in
1979 and 1980 and in 1994 and 1995; three of these stands were resampled in 2003, providing a 24 year record comparable to that at Hubbard Brook (Table 2). These sites ranged from 55 to 128 years of age in 2003. As at Hubbard Brook, the trend in forestfloor N was not significant (p= 0.24), with an average
decrease of 5±20 kg of N ha−1year−1(Figure 2a; see Figure
SI.1 if the Supporting Information). The C:N ratio of the forest
floor did not change significantly (p= 0.21; the average change
over all six sites was −0.03 ± 0.05). Overall, we found no
evidence that the forestfloor is currently a substantial sink for
N at Hubbard Brook (HB) or in the region.
Where Has All the Nitrogen Gone? We constructed a time series mass balance for N at Hubbard Brook Watershed 6. We chose a 5 year time step to correspond to the sampling
interval for vegetation and forestfloor. Summing the Nfluxes
for ecosystem inputs and outputs and changes in living and
dead organic matter stocks gives the residual flux required to
balance the N budget for each time interval.
The N balance shifted from a missing source in the 1965−
1977 period to a missing sink later in the record (Table 1 and
Figure 3). Our 1965−1977 budget is similar to that of Bormann
et al.26but includes more N accumulation in biomass and less
in the forestfloor, based on improved information. After 1977,
when the rate of biomass accumulation slowed and streamflow
losses declined, the budget was approximately balanced until the early 1990s. From 1992 to 2007, further declines in biomass
and in streamwater export resulted in a missing sink of∼8 kg of
N ha−1year−1.
There are several possible explanations for the residualflux
required to balance the Hubbard Brook N budget. Gaseous N
fluxes in or out of the ecosystem would appear in this term.
While some measurements of N2Oflux were made during the
1980s (e.g., ref 51), sustained monitoring of N2O and
measurements of fluxes of N2 began relatively recently at
Hubbard Brook.52Alternatively, a budget discrepancy could be
hidden in the net error of all the other measured and estimated
stocks andfluxes,53such as the uncertainty in the assumed lack
of change in the mineral soil.
Changes in the mineral soil have not been monitored in Watershed 6, because such measurements are inherently destructive, and the high spatial variation in soil mass gives
large uncertainties in repeated sampling.32At Hubbard Brook
Watershed 5, adjacent to Watershed 6, four sets of 0.5 m2
quantitative pits were excavated at 59 distinct sites across the watershed over a 15 year period. Between 1983 (just prior to
whole-tree harvesting) and 1998, there was a weakly significant
decline in mineral soil N of 54±53 kg of N ha−1year−1(p=
0.05). Repeated measurements over 25 years in three
second-growth stands (35−90 years of age) and two nearby mowed
fields on abandoned agricultural land 10 km away give similar
results: nonsignificant declines of 15±22 kg of N ha−1year−1
in O + Ap (disturbed) horizons and 33 ± 41 kg of N ha−1
year−1 in the soil profile.18 Because these uncertainties are
larger than the“missing”fluxes, other evidence must be brought
to bear to explain the change over time in the N budget. Measurements of N in soil solution in Watershed 6 between 1992 and 2008 can shed some light on the mass balance of N in
soil stores. Theflux of total N (DIN plus DON) from the forest
floor to the mineral soil exceeds the total Nflux leaving the Bs
horizon by 8.5±2.1 kg of N ha−1year−1, which is consistent
with the current missing N sink. It is not clear, however, whether the sink is due to the accumulation of N in the mineral soil or to gaseous losses from this horizon.
Is Gaseous Loss the Missing Sink?Gaseous losses of N2
and N2O via nitrification and denitrification represent a
potentially important pathway for the loss of N from the
ecosystem.28 These fluxes are inherently difficult to measure,
especially at the spatial and temporal scales of an ecosystemin
situbudget. New intact soil core methods allow for directin situ
measurements of both N2O and N2, which is especially difficult
to measure because of its high background concentration.54,55
Annualflux estimates of N
2O ranged from 0.27 to 1.4 kg of N
ha−1year−1 between 1997 and 2004.52,56 These estimates are
similar to those for other sites in the northeastern United
States57,58 but are lower than fluxes in highly N-saturated
European forests.59,60
The partitioning of gaseous N losses between N2and N2O (a
potent greenhouse gas) is important for assessing the
environmental impact of denitrification. Balancing the N
budget from 1992 to 2007 (Table 1) without invoking any unmeasured changes in ecosystem stocks (such as accumulation
in the mineral soil) would require gaseous N losses of∼5−12
kg of N ha−1year−1. We can estimate total gaseous N losses at
Hubbard Brook by considering our measured annual N2O
fluxes of ∼1.0 kg of N ha−1year−1,56and assuming that N2O
accounts for 8−17% of total gaseous N losses from the soil.
This is a reasonable assumption as a global review suggests that
N2O accounts for 3−100% of the total gaseous N flux from
forest soils, with a median of 25%.28 Recent data collected at
Hubbard Brook suggest an N2O contribution at the low end of
this range.54
If gaseous loss via nitrification and denitrification accounts
for a large fraction of the“missing sink”, our budget (Table 1
and Figure 3) suggests that it may have increased markedly
since the early 1990s. Measurements of N2Oflux on Watershed
6 in the early 1980s were 1 order of magnitude lower (0.17 ng cm−2h−1)51than our recent observations (1.05−3.22 ng cm−2
h−1).52 Both air61 and soil39 temperatures have increased at
Hubbard Brook, and nitrate availability has likely also
increased,62 consistent with reduced demand for N by
vegetation. The frequency of anoxic soil conditions necessary
for denitrification may also be increasing: soil moisture63and
the number of days when precipitation is >25 mm,61those that
are most likely to create anaerobic conditions, have increased
significantly over the long-term records at Hubbard Brook. In
addition, Groffman et al.52showed that soil freezing induced by
reduced snow cover increased nitrification rates. In-stream
denitrification may also have increased at Hubbard Brook
because coarse woody debris can provide “hot spots” of
denitrification,64 and woody debris may have increased in
streams since harvest removals ceased in the early 1900s. These aspects of forest change and climate change might contribute to
climate system in forests receiving chronically elevated N deposition.
Consequences of a Changing Nitrogen Cycle. Predict-ing the long-term consequences of anthropogenic N deposition on forest health, water quality, and feedbacks on global climate requires understanding the controls of ecosystem sinks for N. If forests are retaining N, whether in living biomass, in dead
biomass such as woody debris, in the forest floor, or in any
form in the mineral soil, these stocks might be expected to saturate in the future. Our ignorance of the fate of
anthropogenic N makes it difficult to predict how much
more N the ecosystem can retain and consequently whether and when export of N to surface water and groundwater will begin to increase. The missing N sink may include gaseous N losses rather than N retention in the ecosystem, which could
explain the lack of symptoms of N saturation. If denitrification
or other gaseous N losses have increased in response to N deposition, these potentially represent an important
anthro-pogenic source of greenhouse gases (∼0.7 Mg of CO2 ha−1
year−1). Alternatively, the long-term storage of N in the soil
would require a netflux of approximately 0.6 Mg of CO2ha−1
year−1 to soil organic matter.29Dissolved inorganic N inputs
and outputs continue to decline because of controls on power
plant emissions since 2003;65how the ecosystem mass balance
of N will change as a result of this sustained decrease in inputs, given the legacy of cumulative past N inputs, remains to be seen.
■
ASSOCIATED CONTENT*
S Supporting InformationLong-term patterns in regional forestfloor nitrogen and carbon
to nitrogen ratios and long-term patterns in dry to wet nitrogen deposition from the U.S. Environmental Protection Agency CASTNET site at Hubbard Brook. This material is available free of charge via the Internet at http://pubs.acs.org.
■
AUTHOR INFORMATIONCorresponding Author
*Department of Civil and Environmental Engineering, Syracuse
University, 151 Link Hall, Syracuse, NY 13244. E-mail: [email protected]. Phone: (315) 443-3434.
Notes
The authors declare no competingfinancial interest.
■
ACKNOWLEDGMENTSWe thank Susan Woontner, Elizabeth Hane, and Jeffrey
Beem-Miller for their efforts in assembling the long-term forestfloor
data sets for Watershed 6. Concentrations of DIN in
precipitation and streamflow were provided by Gene E. Likens
withfinancial support from the National Science Foundation
and the Andrew W. Mellon Foundation. Concentrations of DON in precipitation were provided by John Campbell. Steve Stehman provided statistical consultation. This work is a contribution of the Hubbard Brook Ecosystem Study. Hubbard Brook is part of the Long-Term Ecological Research (LTER) network, which is supported by the National Science Foundation. The Hubbard Brook Experimental Forest is operated and maintained by the U.S. Department of Agriculture Forest Service, Northern Forest Research Station, Newtown Square, PA.
■
REFERENCES(1) Galloway, J. N.; Aber, J. D.; Erisman, J. W.; Seitzinger, S. P.; Howarth, R. W.; Cowling, E. B.; Cosby, B. J. The nitrogen cascade. BioScience2003,53(4), 341−356.
(2) Aber, J. D.; Nadelhoffer, K. J.; Steudler, P.; Melillo, J. M. Nitrogen saturation in northern forest ecosystems. BioScience 1989, 39 (6), 378−386.
(3) Bowen, J. L.; Valiela, I. Historical changes in atmospheric nitrogen deposition to Cape Cod, Massachusetts, USA.Atmos. Environ.
2001,35, 1039−1051.
(4) Galloway, J. N.; Dentener, F. J.; Capone, D. G.; Boyer, E. W.; Howarth, R. W.; Seitzinger, S. P.; Asner, G. P.; Cleveland, C. C.; Green, P. A.; Holland, E. A.; Karl, D. M.; Michaels, A. F.; Porter, J. H.; Townsend, A. R.; Vorosmarty, C. J. Nitrogen cycles: Past, present, and future.Biogeochemistry2004,70(2), 153−226.
(5) Driscoll, C. T.; Whitall, D.; Aber, J.; Boyer, E.; Castro, M.; Cronan, C.; Goodale, C. L.; Groffman, P.; Hopkinson, C.; Lambert, K.; Lawrence, G.; Ollinger, S. Nitrogen pollution in the northeastern United States: Sources, effects, and management options. BioScience
2003,53(4), 357−374.
(6) Likens, G. E.; Driscoll, C. T.; Buso, D. C. Long-term effects of acid rain: Response and recovery of a forest ecosystem.Science1996, 272(5259), 244−246.
(7) Pardo, L. H.; Fenn, M.; Goodale, C. L.; Geiser, L. H.; Driscoll, C. T.; Allen, E.; Baron, J.; Bobbink, R.; Bowman, W. D.; Clark, C.; Emmett, B.; Gilliam, F. S.; Greaver, T.; Hall, S. J.; Lilleskov, E. A.; Liu, L.; Lynch, J.; Nadelhoffer, K.; Perakis, S.; Robin-Abbott, M. J.; Stoddard, J.; Weathers, K.; Dennis, R. L. Effects of nitrogen deposition and empirical nitrogen critical loads for ecoregions of the United States.Ecol. Appl.2011,21(8), 3049−3082.
(8) Townsend, A. R.; Braswell, B. H.; Holland, E. A.; Penner, J. E. Spatial and temporal patterns in terrestrial carbon storage due to deposition of fossil fuel nitrogen.Ecol. Appl.1996,6(3), 806−814.
(9) Magnani, F.; Mencuccini, M.; Borghetti, M.; Berbigier, P.; Berninger, F.; Delzon, S.; Grelle, A.; Hari, P.; Jarvis, P. G.; Kolari, P.; Kowalski, A. S.; Lankreijer, H.; Law, B. E.; Lindroth, A.; Loustau, D.; Manca, G.; Moncrieff, J. B.; Rayment, M.; Tedeschi, V.; Valentini, R.; Grace, J. The human footprint in the carbon cycle of temperate and boreal forests.Nature2007,447(7146), 848−850.
(10) Magnani, F.; Mencuccini, M.; Borghetti, M.; Berninger, F.; Delzon, S.; Grelle, A.; Hari, P.; Jarvis, P. G.; Kolari, P.; Kowalski, A. S.; Lankreijer, H.; Law, B. E.; Lindroth, A.; Loustau, D.; Manca, G.; Moncrieff, J. B.; Tedeschi, V.; Valentini, R.; Grace, J. Ecologically implausible carbon response? Reply.Nature2008,451(7180), E3−E4. (11) Nadelhoffer, K. J.; Emmett, B. A.; Gundersen, P.; Kjonaas, O. J.; Koopmans, C. J.; Schleppi, P.; Tietema, A.; Wright, R. F. Nitrogen deposition makes a minor contribution to carbon sequestration in temperate forests.Nature1999,398(6723), 145−148.
(12) Janssens, I. A.; Luyssaerts, S. Carbon cycle: Nitrogen’s carbon bonus.Nat. Geosci.2009,2, 318−319.
(13) Aber, J. D.; Magill, A.; McNulty, S. G.; Boone, R. D.; Nadelhoffer, K. J.; Downs, M.; Hallett, R. Forest biogeochemistry and primary production altered by nitrogen saturation. Water, Air, Soil Pollut.1995,85(3), 6.
(14) Aber, J.; McDowell, W.; Nadelhoffer, K.; Magill, A. Nitrogen saturation in temperate forest ecosystems: Hypotheses revisited. BioScience1998,48(11), 14.
(15) Likens, G. E.; Bormann, F. H. Biogeochemistry of a Forested Ecosystem, 2nd ed.; Springer-Verlag: New York, 1995; pp 159.
(16) Federer, C. A. Organic matter and nitrogen content of the forest floor in even-aged northern hardwoods.Can. J. For. Res.1984,14(6), 763−767.
(17) Yanai, R. D.; Siccama, T. G.; Arthur, M. A.; Federer, C. A.; Friedland, A. J. Accumulation and depletion of base cations in forest floors in the northeastern US.Ecology1999,80, 2774−2787.
(18) Hamburg, S. P. Effects of forest growth on soil nitrogen and
Forestry, Wildlife and Fisheries, The University of Tennessee: Knoxville, TN, 1984; pp 145−158.
(19) Likens, G. E. Chemistry of Bulk Precipitation at HBEF WS-6. Hubbard Brook Ecosystem Study, 2012 (http://www.hubbardbrook. org/data/dataset.php?id=20).
(20) Likens, G. E. Chemistry of Streamwater at HBEF WS-6. Hubbard Brook Ecosystem Study, 2012 (http://www.hubbardbrook. org/data/dataset.php?id=8).
(21) Buso, D. C.; Likens, G. E.; Eaton, J. S. Chemistry of precipitation, streamwater, and lakewater from the Hubbard Brook Ecosystem Study: A record of sampling protocols and analytical procedures. General Technical Report NE-275; U.S. Department of Agriculture, Forest Service: Newtown Square, PA, 2000; pp 52.
(22) Dittman, J. A.; Driscoll, C. T.; Groffman, P. M.; Fahey, T. J. Dynamics of nitrogen and dissolved organic carbon at the Hubbard Brook Experimental Forest.Ecology2007,88(5), 1153−1166.
(23) Campbell, J. L.; Hornbeck, J. W.; Mitchell, M. J.; Adams, M. B.; Castro, M. S.; Driscoll, C. T.; Kahl, J. S.; Kochenderfer, J. N.; Likens, G. E.; Lynch, J. A.; Murdoch, P. S.; Nelson, S. J.; Shanley, J. B. Input-output budgets of inorganic nitrogen for 24 forest watersheds in the Northeastern United States: A review.Water, Air, Soil Pollut.2004,151 (1−4), 24.
(24) Lovett, G. M.; Bowser, J. J.; Edgerton, E. S. Atmospheric deposition to watersheds in complex terrain.Hydrol. Processes1997,11 (7), 645−654.
(25) Siccama, T. G.; Denny, E. Interactive Hubbard Brook Landscape Biomass Program. Watershed 6 at Hubbard Brook, 2004 (http://www.hubbardbrook.org/w6_tour/biomass-stop/biomassw6. htm).
(26) Bormann, F. H.; Likens, G. E.; Melillo, J. M. Nitrogen budget for an aggrading northern hardwood forest ecosystem.Science1977, 196(4293), 981−983.
(27) Acker, M. Base cation concentration and content in litterfall and woody debris across a northern hardwood forest chronosequence. Ph.D. Dissertation, University of Kentucky, Lexington, KY, 2006.
(28) Schlesinger, W. H. On the fate of anthropogenic nitrogen.Proc. Natl. Acad. Sci. U.S.A.2009,106(1), 203−208.
(29) de Vries, W.; Solberg, S.; Dobbertin, M.; Sterba, H.; Laubhann, D.; van Oijen, M.; Evans, C.; Gundersen, P.; Kros, J.; Wamelink, G. W. W.; Reinds, G. J.; Sutton, M. A. The impact of nitrogen deposition on carbon sequestration by European forests and heathlands.For. Ecol. Manage.2009,258(8), 1814−1823.
(30) Covington, W. W. Changes in forest floor organic-matter and nutrient content following clear cutting in northern hardwoods. Ecology1981,62(1), 41−48.
(31) Roskoski, J. P. Nitrogen fixation in hardwood forests of the northeastern United States.Plant Soil1980,54, 33−44.
(32) Huntington, T. G.; Ryan, D. F.; Hamburg, S. P. Estimating soil nitrogen and carbon pools in a northern hardwood forest ecosystem. Soil Sci. Soc. Am. J.1988,52(4), 1162−1167.
(33) Whittaker, R. H.; Bormann, F. H.; Likens, G. E.; Siccama, T. G. The Hubbard Brook Ecosystem Study: Forest biomass and production.Ecol. Monogr.1974,44, 233−254.
(34) Yanai, R. D.; Battles, J. J.; Richardson, A. D.; Blodgett, C. A.; Wood, D. M.; Rastetter, E. B. Estimating uncertainty in ecosystem budget calculations.Ecosystems2010,13(2), 239−248.
(35) Likens, G. E.; Bormann, F. H. Chemical analyses of plant tissues from the Hubbard Brook Ecosystem in New Hampshire. Bulletin 79; Yale University School of Forestry: New Haven, CT, 1970; pp 25.
(36) Arthur, M. A.; Hamburg, S. P.; Siccama, T. G. The accuracy of allometric estimates of aboveground living biomass and nutrient contents of a northern hardwood forest.Can. J. For. Res.2001,31, 11−
17.
(37) Fahey, T. J. Watershed 6 Temporal Canopy Leaf Chemistry. Hubbard Brook Ecosystem Study, 2012 (http://www.hubbardbrook. org/data/dataset.php?id=44).
(38) Likens, G. E.; Bormann, F. H.; Pierce, R. H.; Eaton, J. S.; Johnson, N. M. Biogeochemistry of a Forested Ecosystem; Springer-Verlag: New York, 1977; p 146.
(39) Bernal, S.; Hedin, L. O.; Likens, G. E.; Gerber, S.; Buso, D. C. Complex response of the forest nitrogen cycle to climate change.Proc. Natl. Acad. Sci. U.S.A.2012,109(9), 3406−3411.
(40) Driscoll, C. T.; Cowling, E. B.; Grennfelt, P.; Galloway, J.; Dennis, R. Integrated assessment of ecosystem effects of atmospheric deposition: Lessons available to be learned. EM Magazine 2010, No. November, 6−13.
(41) Houlton, B. Z.; Driscoll, C. T.; Fahey, T. J.; Likens, G. E.; Groffman, P. M.; Bernhardt, E. S.; Buso, D. C. Nitrogen dynamics in ice storm damaged forest ecosystems: Implications for nitrogen limitation theory.Ecosystems2003,6, 431−443.
(42) Goodale, C. L.; Aber, J. D.; Vitousek, P. M. An unexpected nitrate decline in New Hampshire streams.Ecosystems 2003,6 (1), 75−86.
(43) Martin, C.; Driscoll, C.; Fahey, T. Changes in streamwater chemistry after 20 years from forested watersheds in New Hampshire, USA.Can. J. For. Res.2000,30(8), 1206−1213.
(44) Agren, G. I.; Bosatta, E. Nitrogen saturation of terrestrial ecosystems.Environ. Pollut.1988,54(3−4), 185−197.
(45) Yanai, R. D.; Currie, W. S.; Goodale, C. L. Soil carbon dynamics after forest harvest: An ecosystem paradigm reconsidered.Ecosystems
2003,6(3), 197−212.
(46) Ollinger, S. V.; Goodale, C. L.; Hayhoe, K.; Jenkins, J. P. Potential effects of climate change and rising CO2 on ecosystem
processes in northeastern U.S. forests. Mitig. Adapt. Strategies Gl. Chang. 2008,13, 467−485.
(47) Ollinger, S. V.; Aber, J. D.; Reich, P. B.; Freuder, R. J. Interactive effects of nitrogen deposition, tropospheric ozone, elevated CO2and
land use history on the carbon dynamics of northern hardwood forests. Glob. Chang. Biol.2002,8(6), 545−562.
(48) Janssens, I. A.; Dieleman, W.; Luyssaert, S.; Subke, J. A.; Reichstein, M.; Ceulemans, R.; Ciais, P.; Dolman, A. J.; Grace, J.; Matteucci, G.; Papale, D.; Piao, S. L.; Schulze, E. D.; Tang, J.; Law, B. E. Reduction of forest soil respiration in response to nitrogen deposition.Nat. Geosci.2010,3(5), 315−322.
(49) Carreiro, M. M.; Sinsabaugh, R. L.; Repert, D. A.; Parkhurst, D. F. Microbial enzyme shifts explain litter decay responses to simulated nitrogen deposition.Ecology2000,81(9), 2359−2365.
(50) Weand, M. P.; Arthur, M. A.; Lovett, G. M.; McCulley, R. L.; Weathers, K. C. Effects of tree species and N additions on forest floor microbial communities and extracellular enzyme activities. Soil Biol. Biochem.2010,42(12), 2161−2173.
(51) Keller, M.; Goreau, T. J.; Wofsy, S. C.; Kaplan, W. A.; Mcelroy, M. B. Production of nitrous oxide and consumption of methane by forest soils.Geophys. Res. Lett.1983,10(12), 1156−1159.
(52) Groffman, P. M.; Hardy, J. P.; Driscoll, C. T.; Fahey, T. J. Snow depth, soil freezing, and fluxes of carbon dioxide, nitrous oxide and methane in a northern hardwood forest. Glob. Chang. Biol. 2006,12 (9), 1−13.
(53) Yanai, R. D.; Levine, C. R.; Green, M. B.; Campbell, J. L. Quantifying uncertainty in forest nutrient budgets.J. For.2012,110 (8), 448−456.
(54) Kulkarni, M. V.; Burgin, A. J.; Groffman, P. M.; Yavitt, J. B. Direct flux and15N tracer methods for measuring denitrification in
forest soils. Biogeochemistry 2013, http://download.springer.com/ static/pdf/720/art%253A10.1007%252Fs10533-013-9876-7. p d f ? a u t h 6 6 = 1 3 8 0 9 0 5 0 0 0 _
69398f2c64f812e079c41a131a15ddb8&ext=.pdf.
(55) Wang, R.; Willibald, G.; Feng, Q.; Zheng, X.; Liao, T.; Brüggemann, N.; Butterbach-Bahl, K. Measurement of N2, N2O, NO,
and CO2 emissions from soil with the gas-flow-soil-core technique.
Environ. Sci. Technol.2011,45, 6066−6072.
(56) Groffman, P. M.; Hardy, J. P.; Fisk, M. C.; Fahey, T.; Driscoll, C. T. Climate variation and soil carbon and nitrogen cycling processes in a northern hardwood forest.Ecosystems2009,12(6), 927−943.
(58) Venterea, R. T.; Groffman, P. M.; Verchot, L. V.; Magill, A. H.; Aber, J. D. Gross nitrogen process rates in temperate forest soils exhibiting symptoms of nitrogen saturation.For. Ecol. Manage. 2004, 196(1), 14.
(59) Brumme, R.; Borken, W.; Finke, S. Hierarchical control on nitrous oxide emission in forest ecosystems.Global Biogeochem. Cycles
1999,13(4), 1137−1148.
(60) Butterbach-Bahl, K.; Breuer, L.; Gasche, R.; Willibald, G.; Papen, H. Exchange of trace gases between soils and the atmosphere in Scots pine forest ecosystems of the northeastern German lowlands 1. Fluxes of N2O, NO/NO2 and CH4 at forest sites with different
N-deposition.For. Ecol. Manage.2002,167(1−3), 123−134.
(61) Hamburg, S. P.; Vadeboncoeur, M. A.; Richardson, A. D.; Bailey, A. S. Climate change at the ecosystem scale: A 50-year record in New Hampshire.Clim. Change2013,116(3−4), 457−477.
(62) Duran, J.; Morse, J. L.; Groffman, P. M. Comparison ofin situ methods to measure N mineralization rates in forest soils.Soil Biol. Biochem.2012,46, 145−147.
(63) Groffman, P. M.; Rustad, L. E.; Templer, P. H.; Campbell, J. L.; Christenson, L. M.; Lany, N. K.; Socci, A. M.; Vadeboncoeur, M. A.; Schaberg, P. G.; Wilson, G. F.; Driscoll, C. T.; Fahey, T. J.; Fisk, M. C.; Goodale, C. L.; Green, M. B.; Hamburg, S. P.; Johnson, C. E.; Mitchell, M. J.; Morse, J. L.; Pardo, L. H.; Rodenhouse, N. L. Long-term integrated studies show complex and surprising effects of climate change in the northern hardwood forest.BioScience 2012,62 (12), 1056−1066.
(64) Bernhardt, E. S.; Likens, G. E.; Buso, D. C.; Driscoll, C. T. In stream uptake dampens effects of major forest disturbance on watershed nitrogen export. Proc. Natl. Acad. Sci. U.S.A. 2003, 100 (18), 5.
(65) Likens, G. E.; Buso, D. C. Dilution and the elusive baseline. Environ. Sci. Technol.2012,46(8), 4382−4387.
(66) Fahey, T. J.; Hughes, J. W.; Pu, M.; Arthur, M. A. Root decomposition and nutrient flux following whole-tree harvest of northern hardwood forest.For. Sci. (Bethesda, Md)1988,34(3), 744−