31 CHAPTER III
RESEARCH METHODOLOGY
This chapter elaborates the methodology of research conducted to answer the two research questions previously stated in chapter one. Some big points that cover in this chapter are research method, hypothesis, subject, data collection, research procedure, and data analysis.
3.1 Research Method
3.1.1 Research Design
The aims of the research was to find out the effect of mind mapping technique in improving students’ reading ability in descxriptive text; the advantages and disadvantages of mind mapping technique in teaching descriptive text. The research method employed was quantitative method with quasi experimental design. According to Hatch and Farhady (1982: 24), “quasi experimental design is used as one of the best research approaches in the research since it aimed practically to compare true experimentation and the nature of human language behavior which we wish to investigate.”
technique as the treatment in classroom activities. Meanwhile, in the control group, the students were taught by using conventional method. It means that there was no method applying in teaching learning process for control group.
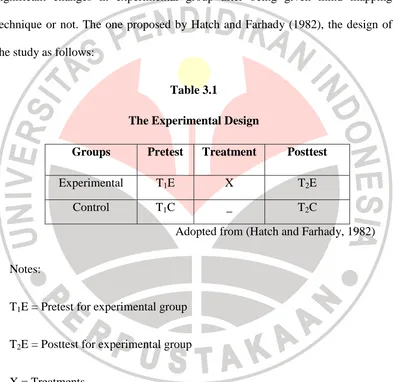
In this study, reading test was conducted to find out whether there were significant changes in experimental group after being given mind mapping technique or not. The one proposed by Hatch and Farhady (1982), the design of the study as follows:
Table 3.1
The Experimental Design
Groups Pretest Treatment Posttest
Experimental T1E X T2E
Control T1C _ T2C
Adopted from (Hatch and Farhady, 1982)
Notes:
T1E = Pretest for experimental group
T2E = Posttest for experimental group
X = Treatments
T1C = Pretest for control group
3.1.2 Variables
There were two variables in this study, independent and dependent variables. As described by Hatch and Farhady (1982: 15) “the independent variable is the major variable which you hope to investigate while dependent variable is the variable which you observe and measure to determine the effect of the independent variable.”
The variables used were classified into independent and dependent variables:
1) The independent variable was mind mapping technique because this was the major variable which was investigated thus it was selected and measured by the researcher (Hatch and Farhady, 1982: 15).
2) The dependent variable was students’ reading ability in descriptive text was observed and measured to determine the effect of the independent variable (Hatch and Farhady, 1982: 15).
3.2. Hypothesis
Hatch and Farhady (1982: 85-86) stated that, “hypothesis can be considered as the tentative statement about the outcome of the research.” Then, the research was conducted to examine the hypothesis which is stated as follows:
H0 : there was no difference between reading descriptive text by using mind
3.3 Subject
In the research, the population is the seventh grade students in one of Junior High School in Bandung. Sample is a part of population (Arikunto, 2010). The sample of this research were two classes. The first class, 7.8 was the experimental group and the other, 7.9 was the control group. 7.8 consists of 39 students; meanwhile 7.9 consists of 40 students. Initially, 7.8 consists of 40 students but one of the students moved to another school. Therefore, the total number of the students of the study was 79 students.
In this research, the researcher just involved 35 students from each class as the sample of the research. The consideration was based on Hatch and Farhady (1982: 98) statement who stated that “the total 30 students was chosen since it was the smallest size required to get sample normally distributed.” Besides, the consideration of taking the smallest size of sample was to avoid some students who suddenly absent when they got the treatment sessions or even in the pretest and posttest. Therefore, the number of the sample was 70 students from both classes.
3.4 Data Collection
3.3.1 Reading Tests
Reading tests were administered to measure students’ reading ability that were revealed in their score by using scoring technique. It was used to reveal the effectiveness of using mind mapping technique in teaching descriptive text. The reading descriptive test was administered to 70 students as experimental and control groups. The time allocated for the respondent to finish the test was eighty minutes. Reading tests in this research used different texts and questions for pretest and posttest. The test is in the form of multiple choices consisting of 30 items which was taken from book and internet.
3.3.2 Interviews
An interview which also served as the research instrument was used to support the data in finding out the students’ responses the advantages and disadvantages of using mind mapping technique in teaching reading descriptive text. It aimed in getting a description about information related to the process of the implementation of mind mapping which was not described in the results of reading test instrument pretest and posttest.
3.3.3 Class Observation
This research employed class observation as the instrument to add the data acquired from the interview. The observation was focused on learning situation and students’ participation in class. The researcher conducted class observation in experimental class. As a tool to gain the data during observation, the researcher used field notes to portray what was going on in the class. The learning situation and students’ participation in class were the aspects captured on the field notes.
3.5 Research Procedure
3.5.1 Organizing Teaching Procedure
In the research, both classes were taught by the researcher. In preparing the teaching process, the researcher carried out two steps. The first step was preparing the appropriate materials for teaching and learning process during the experiment. The material that was used for teaching and learning process during period of the experiment was taken from GENRE (Dilengkapi 700 Soal Ujian Pemahaman) and from the internet. The present study selected and adapted the materials for the experiment. Then, as the second step, the researcher organized teaching procedures in control and experimental group.
3.5.2 Administering Pilot Test
Pilot test was intended to measure the validity, reliability, and testing the difficulty level of the test instrument. It was important to be conducted because it was used as the reflection in making some revisions or changes in the test instrument. The pilot test was administered to different class of the sample in the same grade.
Furthermore, pilot test was given to the students before the treatments began. This research used different instrument in pretest and posttest, but both of them had the same level of descriptive texts and reading questions. The pilot test was conducted in two sessions. The pilot test for pretest instrument was conducted on October 24th, 2011 and posttest instrument was conducted on November 7th, 2011. The test consisted of 40 multiple choice items that was administered to 40 students. The pilot test can be seen in the Appendix D.
3.5.3 Administering Pretest and Posttest
affects in teaching learning process. The pretest and posttest instrument can be seen in the Appendix E.
3.5.4 Conducting Treatments
After performing pretest, the next step was given treatment for both groups. In conducting the treatment, experimental group was taught by using mind mapping technique as mention previously and the control group was not given mind mapping technique as the treatments. Nevertheless, both groups were in similar condition, the only thing which was different related to the technique that was implemented in the experimental group. Mind mapping was used in the pre-activity as a brainstorming of the lesson. This technique helped the students to know what they had to do with the text they read. The treatments were conducted in 6 meetings. The schedule of research can be seen in the Appendix B.
3.5.5 Administering Interviews
3.5.6 Conducting Class Observations
This research employed class observation as the instrument to add the data acquired from the interview which cannot be gathered by interview. The observation was conducted as long as the treatments in experimental group; conducted on October 31st, 2011 till November 17th, 2011. The researcher used field notes to portray what was going on in the class.
3.6 Data Analysis
3.6.1 Scoring Technique
The instrument used in the research is in the form of multiple-choice questions. The data were collected by using research instrument. After the data were collected, then the data will be analyzed by using scoring technique. The score of the students is a number of items which can be answered rightly. The students’ score on pretest and posttest can be seen in the Appendix F.
3.6.2 Data Analysis on the Pilot Test
3.6.2.1 Validity Test
Validity is a measurement to determine if the instrument is acceptable or not (Arikunto, 2010: 211). It is important to try out the test instrument and compute the result with an appropriate formula of validity.
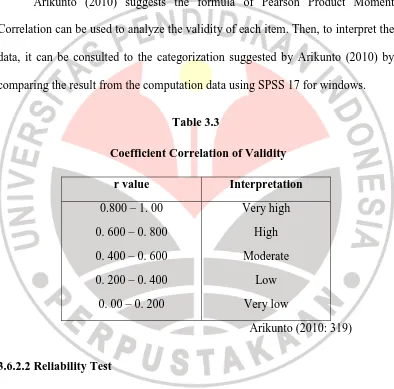
Arikunto (2010) suggests the formula of Pearson Product Moment Correlation can be used to analyze the validity of each item. Then, to interpret the data, it can be consulted to the categorization suggested by Arikunto (2010) by comparing the result from the computation data using SPSS 17 for windows.
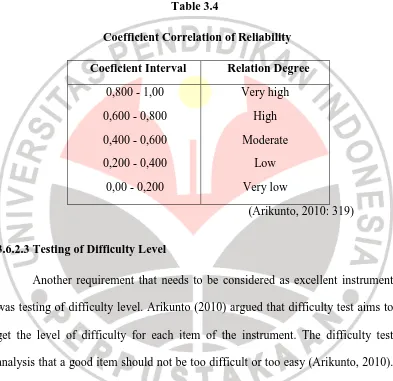
For measuring reliability, Arikunto suggests using Cronbach’s Alpha that was measured by SPSS 17 for windows. Then, the reliability obtained from the test result was interpreted using the coefficient correlation of reliability as follows:
Table 3.4
Coefficient Correlation of Reliability
Coeficient Interval Relation Degree
0,800 - 1,00 0,600 - 0,800 0,400 - 0,600 0,200 - 0,400 0,00 - 0,200
Very high High Moderate
Low Very low
(Arikunto, 2010: 319)
3.6.2.3 Testing of Difficulty Level
Where:
P = index of difficulty
B = the number of students who can answer the item correctly
JS = the number of students
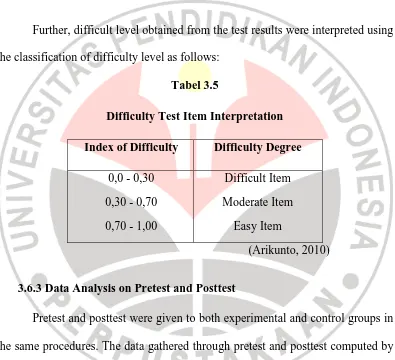
Further, difficult level obtained from the test results were interpreted using the classification of difficulty level as follows:
Tabel 3.5
Difficulty Test Item Interpretation
Index of Difficulty Difficulty Degree
0,0 - 0,30 0,30 - 0,70 0,70 - 1,00
Difficult Item Moderate Item
Easy Item
(Arikunto, 2010)
3.6.3 Data Analysis on Pretest and Posttest
Pretest and posttest were given to both experimental and control groups in the same procedures. The data gathered through pretest and posttest computed by using SPSS 17 for windows. Four steps were accomplished to analyze the pretest and posttest covered normality test, homogeneity test, independent t-test, and effect size. Before performing the independent t-test, the output data of the pretest and posttest should fulfill the criteria as stated in Coolidge (2000) as follows:
2) The data should have a normal distribution;
3) The variance of the two groups must be homogeneous.
For that reason, normal distribution and homogeneity of variance test were performed before calculating the data using t-test.
3.6.3.1 Normality Distribution Test
Normal distribution test was aimed to investigate whether or not the distribution of pretest and posttest both of two groups were normally distributed (Coolidge, 2000). The statistical calculation of normally test used Kolomogrov-Smirnov in SPSS 17 for windows following three steps below:
1) Setting the level of significance at 0.05 and stating the hypothesis.
H0 : the distribution of scores in experimental and control groups were
normally distributed.
2) Analyzing the normality distribution with Kolomogrov-Smirnov test in SPSS 17 for windows.
3) Comparing the Asymp.sig (probability) with the level of significance for testing the hypothesis. If the Asymp.sig was more than the level of significance (Asymp.sig > 0.05), the null hypothesis (H0) was not rejected
and the data was normally distributed. Hence, if the Asymp.sig was less than the level of significance (Asymp.sig < 0.05), the null hypothesis (H0)
3.6.3.2 Homogeneity of Variance Test
In an experimental research, one of the requirements that should be fulfilled is experimental group and control group must be homogeneous or having same characteristics (Arikunto, 2010). Homogeneity of variance was used to check whether the experimental and the control group posttest scores were homogeneous or not. The analyzing of variance homogeneity used Levene test in SPSS 17 for windows follows the steps below:
1) Setting the level of significance at 0.05 and stating the hypothesis.
H0 : the variances of the experimental and control groups were
homogeneous.
2) Analyzing the homogeneity of variance by using Levene test in SPSS 17 for windows.
3) Comparing the Asymp.sig (probability) with the level of significance for testing the hypothesis. If the Asymp.sig was more than the level of significance (Asymp.sig > 0.05), the null hypothesis (H0) was not rejected.
It suggested that the variance of data were homogeneous. However, if the Asymp.sig was less than the level of significance (Asymp.sig < 0.05), the null hypothesis (H0) was rejected. It clarified that the variance of data were
not homogeneous.
3.6.3.3 Independent t-test
that “independent t-test was used to seek the difference between the mean of both classes, experimental and control groups.” The independent t-test was conducted to see whether there was a significance difference between the experimental and control group’s score on pretest and posttest. The steps of the independent t-test calculation are as follows:
1) Setting the level of significance at 0.05 (two-tailed test) and stating the hypothesis.
H0 : there was no difference between the mean in experimental and
control groups.
2) Analyzing the independent t-test by using SPSS 17 for windows.
3) If the t obtain value was less than to t critical value at the level significance 0.05 (two-tailed), the null hypothesis (H0) was not rejected, and it can be
concluded that there was no significance difference between the two means. On the other hand, if t obtain value was more than or equal to t critical value at the level significance 0.05 (two-tailed), the null hypothesis (H0) was rejected, and it means that there was significance difference
between the two means.
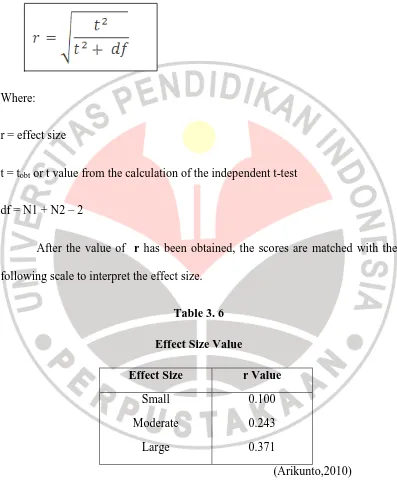
3.6.3.4 Effect Size
effect of the independent variable in practical terms. If the treatment worked well then there will be a large effect size. The formula of effect size is:
Where:
r = effect size
t = tobt or t value from the calculation of the independent t-test
df = N1 + N2 – 2
After the value of r has been obtained, the scores are matched with the following scale to interpret the effect size.
Table 3. 6
Effect Size Value
Effect Size r Value
Small Moderate
Large
0.100 0.243 0.371
(Arikunto,2010)
3.6.4 Data Analysis on Interview
Interview was one of the instruments to collect the data. It consists of some questions that should be answered by the students orally. The interview data were transcribed to obtain the information about mind mapping technique implementation from the students’ perception. The administering of interview was aimed to find out the advantages and disadvantages of mind mapping technique which had been used in teaching reading descriptive text.
The data analysis was done to collect the required data, then the conclusion was made after completing the whole process of the research. According to Miles and Huberman (1994), the interview data was analyzed through four steps such as transcribing the interview, categorizing the data into selected categorize, presenting, and interpreting the result of interview.
3.6.5 Data Analysis on Class Observation