THE IMPACT OF RETAILER AWARENESS, RETAILER ASSOCIATION,
RETAILER PERCEIVED QUALITY, RETAILER LOYALTY ON PURCHASE INTENTION IN
HYPERMART SURABAYA
Jorgi Allen
[email protected] Christina Rahardja Honantha
[email protected], [email protected] Liliana Inggrit W.
Faculty of Business and Economics Universitas Surabaya
ABSTRACT
This research examine the impact of retailer awareness, retailer association, retailer perceived quality, retailer loyalty on purchase intention in Hypermart as the object of modern food retail brand.
This quantitative and causal type research used questionnaires for on-site survey. Purposive sampling method was used. The sample consisted of 250 respondents whose age is 18 years or above, have visited and shopped at Hypermart in Surabaya at least twice in the last three months, and also have ever used the customer service and after-sales service in Hypermart. Data were analyzed through descriptive statistics using SPSS 18.0 and AMOS 18.0
The result of the found that there is a positive impact of retailer awareness towards purchase intention. There is a positive impact of retailer association towards retailer loyalty. Furthermore, positive impact of retailer association towards purchase intention is also indicated. Retailer perceived quality is shown to have positive impact towards retailer loyalty. The result also indicates that retailer loyalty has positive impact towards purchase intention. However, the result shows no significant impact of retailer awareness towards retailer loyalty. There is also a statistical error type II found resulting in perceived quality does not have positive impact towards purchase intention.
INTRODUCTION
In the last few years, there have been lots of researches and studies that emphasize on brand concept, yet mostly it only discussed limited to product brands. According to Ailawadi and Keller (2004), it is argued that branding and brand management concept can and should be applied to retail brands. The consideration is because that brand is also one of the firms’ most valuable assets, other than its financial assets. Moller and Herm (2013) stated that any kind of retailer or retail store, regardless their size should have their own retail brands and maintain them well.
There is an increasing consumer consciousness during the last few years, making consumers are very likely to purchase products from the retailers whose brands they are familiar with (H.K. Chi, 2009). Therefore, when a retailer wants to be successful in the global market, it is required for them to be able to find certain ways on how to make the consumers love to purchase products and/or services from them. Several ways to achieve this is to increase the positive retailer awareness, positive retailer association, positive retailer perceived quality and also positive retailer loyalty (Das, 2014).
During the recent years, retail sector has gained huge role in the world economy. In 2014, the retail sales amounts to 28.98% of the world GDP which was considered as a significant contribution to the global economy in comparison to other sector, such as manufacturing and services. Therefore from the data above, it can be inferred that retail industry plays strategic role in the world economy, which brings benefits to countries around the world, including Indonesia.
According to www.worldometers.info retrieved on 3 April 2015, Indonesia is known as the largest archipelagic country, currently holding the power of 16thlargest economy around the world, as well as the fourth most populous nation with an estimated population of 255 million people. The growing economy in Indonesia is driven by the increasing domestic consumption due to the combination of rapid increase in national income and rising consumer class.
Over the years, the retail sector in Indonesia has grown significantly to the extent where it plays major role for the economic growth of Indonesia. During the period of 2007 until 2012, there was an trend of increasing number of retailers across Indonesia, noted to be growing at the rate of 17.57% per annum on average.
The consumption pattern of Indonesian people these days showed that food and non-alcoholic beverages amounts to 33% of Indonesian people’s disposable income, having much larger and more significant ratio in comparison to other component, such as housing and transport. Therefore, based on this fact, it can be inferred that food retailers have a more important role for the Indonesian consumers.
It is indicated that the modern food retail store type being visited the most by the respondent is hypermarket. According to the research conducted by Collins International Indonesia, there are only three hypermarket brands exist in Surabaya, which are Hypermart, Carrefour and Giant. Hypermart is the brand which has the most branches in Surabaya by having 6 outlets, then followed by Carrefour with 4 outlets and lastly Giant with only 1 outlet.
According to Surya and Setiyaningrum (2009), Hypermart is considered as one of the biggest retailer in Indonesia dominating the domestic retail industry. Hypermart not only provides several kinds of food ingredients, but they also offer consumers several other products including household goods, electronic goods, and other daily needs. Until now, Hypermart has several branches spread around Jabodetabek and other big cities. For the outlets, Hypermart usually provides large space on one or two stories buildings in order to give consumers better shopping experience.
Das (2014) studied the relationships between retailer awareness, retailer association, retailer perceived quality, retailer loyalty towards the purchasing intention in Indian modern food retailer store. The results revealed that retailer awareness, retailer association, retailer perceived quality, retailer loyalty have positive impacts towards the purchase intention. The study, however, was limited to the scope of modern food retail store in India. Therefore, in this particular research, the author currently tries to conduct a new study regarding to the related topic with the object of being modern food retailer in Indonesia, represented within the area of Surabaya.
From the previous explanations, researcher found out that retail industry, is increasingly profitable over the years bringing economic prosperity for countries around the world, including Indonesia, which currently has rising economy and consuming class growth. It is very important to have a greater understanding regarding modern food retail brands in Indonesia since food sector is the one contributing the most for the economy. Yet there are still little to no resarches conducted concerning about this particular topic.
The main objectives of this particular study is to analyze the relationship between retailer awareness, retailer association, retailer perceived quality, mediated through retailer loyalty towards the purchase intention in Hypermart. From the theoritical side, this study will empirically contribute to the research regarding the consumer decision making process or purchase intention on modern food retail brands in Indonesia affected on the retail antecedentes including awareness, association, perceived quality and loyalty. This research can be used as the basis to enrich the existing study related to the retail brand, especially in the food sector or in another specific country.
regarding the practical problem in the practical context especially in the current business and economic situation, particluarly in the field of brand management and also retailing business.
LITERATURE REVIEW
Retailer Awareness
Retailer awareness is often associated with both the concept of “brand awareness” (Yoo and Donthu, 2001) and “name awareness” (Arnett, Laverie and Meiers, 2003). According to Pappu and Quester (2006), retailer awareness is defined as “consumer’s ability to recognise or recall that the retailer is a member of certain retailer category”. In addition, Aaker (1991) stated that retailer awareness is the extent to which retailers’ names are familiar to shoppers.” Therefore, it means that this particular retailer is considerably well-known to the consumers.
Grewal et. al (1998) stated that the more positive reputation and name that a retailer or a store have, the more positive perception the consumers have, thus higher chance for them to develop purchase intention from this particular retailer. Darden, Erden and Darden (1983), as cited in Grewal et al. (1998), found that consumers’ belief regarding to the attractiveness of the store resulted from their store awareness has strong influence towards their patronage and purchase intention.
Keller (1993) also indicates that consumers are willing to pay more money for products coming from more well-known retailer or brand, thus showing higher loyalty towards those brands. Thus, brand awareness has significant contribution towards consumer’s purchase decision making process. Aaker (1991) also argued that brand awareness affects the brand loyalty.
Retailer Association
Retailer association is described as “anything linked to the memory of the retailer” (Pappy and Quester, 2006). According to Keller (1993), retailer association mirrors the information nodes linked to a retailer brand node in memory that contains the meaning of the retailer brand for consumers. Moreover, retailer association requires to have three specific characteristics, which are favorability, strengths and uniqueness. In addition, Keller (1993) also points out that “the presence of strongly held, favorably evaluated associations that are unique to the brand and imply superiority over other brands is critical to a brands’ success”.
Aaker (1991), there are some benefits of having brand association, such as assisting the customers to gather or process information, differentiating the brand and retailer from competitors, generating a reason for consumer to buy, and creating favorable attitudes. Thus, Aaker (1991) believes that brand association and brand loyalty are strongly and positively interrelated to each other, sinceit is viewed as “a sign of quality and commitment”, leading customers to familiarize purchasers with a brand.
Keller (1993) also points out that when a product owns a positive brand image, it will help in marketing activities, thus affecting the consumer purchase decision making process.
Retailer perceived quality is defined as the “perception of quality of the retailer as well as the quality of products, either goods or services, offered by retailers” (Pappu and Quester, 2006). Yoo and Donthu (2001) argued that retailer perceived quality and retailer associations are included in the same dimension. However, Pappu and Quester (2006) strongly suggested that retailer perceived quality and retailer association should be distinguished, although they are closely related.In addition, according to Zeithaml (1998, p.3), perceived quality is conceptualized as “the consumer's judgment about a product's overall excellence or superiority''. In other words, perceived quality mirrors the perspective of consumers regarding certain product quality.
Selnes (1993) stated that loyalty happens when the quality of service provided by the vendor (retailer) has been judged positively, and the experience have delivered satisfactions. It is also argued that perceived quality has strong correlation with the brand reputation and customer satisfaction, both of which determine the retailer loyalty. Garton (1995) also proposes that perceived quality affects the consumer’s purchase intention, thus also it is likely for them to develop the loyalty.
Das (2014) advocated that the perceived quality has positive effect on a consumer’s intention to re-purchase, thus its is likely for the loyalty to develop.
Retailer Loyalty
According to Pappy and Quester (2006), retailer loyaly, also known as store loyalty, is defined as “the tendency of consumers to be loyal to a focal retailer, as demonstrated by the intention to buy from the retailer as a primary choice.”According to Bloemer and Odekerken (2002), retailer loyalty can be conceptualized as the “commitment from the consumers towards certain retailer, which is directly influenced by the satisfaction and trust towards the retailer”. It also relates with the willingness of the consumers to repatronize this preferred retailer.
The consumers who are brand loyal do not evaluate the brand anymore, and they make purchase decision confidently just from their experience ensuring their purchase intention to remain. (Sidek, Yee, & Yahyah, 2008)
Purchase Intention
According to Fishbein & Ajzen (1975), purchase intention is “the result of a consumer’s assessment and attitude towards certain brand, as well as other external factors, which result in the willingness of consumers to purchase the products or service they offer.” Das (2014), stated that purchase intention measures up the possibility of a consumer to purchase a certain product from certain retailer. Thus, the higher the purchasing intention that the consumer has, the higher their willingness and desire to purchase the product.
H5: Retailer perceived quality has positive impact towards retailer loyalty in Hypermart H6: Retailer perceived quality has positive impact towards purchase intention in Hypermart H7: Retailer loyalty has positive impact towards purchase intention in Hypermart
METHODOLOGY
The type of this study is categorized as causal research. This particular explanatory research design with quantitative approach describes the causal relationship between variables shown in the research model previously, which are: retailer awareness, retailer association, retailer perceived quality, retailer loyalty and purchase intention on Hypermart as the object of Indonesian modern food retail store. According to the type of data used, this study uses primary data which is obtained directly from the source, by spreading structural questionnaire to the respondents.
The population used in this research is all of the consumers who shop at Hypermart stores in Surabaya. In accordance to Das (2014), this study used certain sample criterias which include all the citizen of Surabaya within the age of 18 years and above, who have visited and shopped at Hypermart in Surabaya at least twice in the last three months, as well as have ever used the customer service and afer-sales service in Hypermart. In the sampling technique, the study will utilize the non-probability sampling where some elements of the population will have no chance of selection. Moreover, the method used is purposive sampling where the researcher chooses the sample based on the judgement and knowledge of the researcher in order to collect samples which meet certain criterias.
According to Ferdinand (2005), the number of sample needed for Structural Equation Model (SEM) is between five to ten respondents for each indicator present. In this study, there are 17 indicators. Therefore, the minimum requirement of samples needed in this study is 5 respondents x 17 indicators = 85 respondents. However, the researcher decided to use 250 samples in order to obtain more consistent results.
Interval scale is used in this study since it has the same range and also homogenous with different value in each number present, making it relevant to the research definition. The type of scale utilized is itemized rating scale for all variables. For the dimensions of retail awareness, retailer association, retailer perceived quality, retailer loyalty and purchase intention, all scale items were measured by utilizing the seven-point numerical scales (1= strongly disagree and 7 = strongly agree) in which the higher the score shows the better results. The pattern used in the research will be as follow :
Strongly Disagree 1 2 3 4 5 6 7 Strongly Agree
A confirmatory factor analysis is done in order to see whether the model is suitable for further study, followed by the testing of the goodness fit indexes which include The Root Mean Square of Approximation (RMSEA), Tucker Lewis Index (TLI), Goodness of Fit Index (GFI), Comparative Fit Index (CFI) and The Minimum Sample Discrepancy Function which split Degree of Freedom (CMIN/DF). Furthermore, it is recommended to use construct reliability and variance extract in order to measure of the internal consistency of a construct indicator.
In SEM, to test the hypotheses on each parameter, it can be done by observingthe regression weights estimates of the Critical Ratio (C.R.) and the p-value column. If the C.R. value is equal to or greater than 1.96, then it can be inferred that the CR value is significant, thus hypotheses is accepted. In contrast, however, when the C.R. value is lower than 1.96, it can be concluded that the CR values is not significant, thus the hypotheses is rejected. Moreover, if the p-value is less than 0.05, the hypotheses is accepted. In contrast, if the p-value is greater or equal to 0.05, the hypotheses is rejected.
RESULT AND DISCUSSION
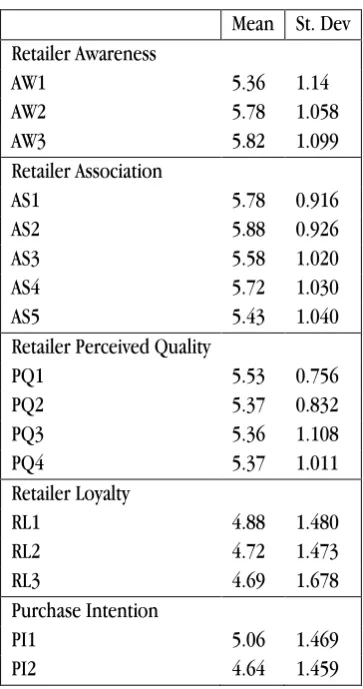
The socio-demographicprofile of thesampleanddescriptive statistics oftheconstructsarerepresentedin Table1above. Table 1 shows that the respondents comprise of 173 females (69.2%) and 77 males (30.8%). The average age of the respondents 33 years old. Based on the types of the customer service used by the respondents, it can be seen that the majority of respondents use PENITIPAN with 116 respondents (46.4%), TANYA CS with 79 respondents (31.6%), INFO PRODUK with 41 respondents (16.4%), and KATALOG with 14 respondents (5.6%). Moreover, based on the types of the after sales service used by the respondents, it can be seen that the majority of respondents use TUKAR HADIAH with 209 respondents (83.6%), KOMPLAIN with 29 respondents (11.6%), INSTALASI ELEKTRONIK with 10 respondents (4.0%), and RETUR BARANG with 2 respondents (0.8%).
1.14.The mean scores and standard deviations of retailer association scale items range from 5.43 to 5.88 and from 0.916 to 1.040. The mean scores and standard deviations of retailer perceived quality scale items range from 5.36 to 5.53 and from 0.756 to 1.108. The mean scores and standard deviations of retailer loyalty scale items range from 4.69 to 4.88 and from 1.473 to 1.678.The mean scores and standard deviations of purchase intention scale items range from 4.64 to 5.06 and from 1.459 to 1.469. The reliability statistics (Cronbach alphas) of the five constructs are 0.716, 0.821, 0.820, 0.924, and 0.868 respectively for retailer awareness, retailer association, retailer perceived quality, retailer loyalty and purchase intention
Table 2 Constructs and the items Mean St. Dev Retailer Awareness
AW1 5.36 1.14
AW2 5.78 1.058
AW3 5.82 1.099
Retailer Association
AS1 5.78 0.916
AS2 5.88 0.926
AS3 5.58 1.020
AS4 5.72 1.030
AS5 5.43 1.040
Retailer Perceived Quality
PQ1 5.53 0.756
PQ2 5.37 0.832
PQ3 5.36 1.108
PQ4 5.37 1.011
Retailer Loyalty
RL1 4.88 1.480
RL2 4.72 1.473
RL3 4.69 1.678
Purchase Intention
PI1 5.06 1.469
PI2 4.64 1.459
Source : data processed by SPSS 18.0 for Windows
Source : data processed by AMOS 18.0
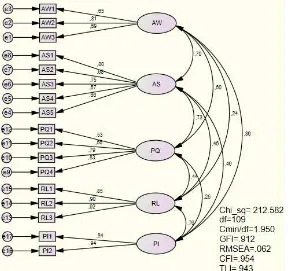
Figure 1
Overall Confirmatory Factor Analysis
A factor loading for a variable is a measurement of how much each variable contributes to the factor. Thus it can be said that high factor loading scores indicate that the dimensions of the factors are better accounted for by the variables. Moreover, the correlation r must be .30 or greater since anything lower would suggest a really weak relationship between the variables (Yong and Sean Pearce, 2013). From the result above, all the loading scores for each indicator show scores above 0.5 which is relatively high. However, based on the correlation found, there is and indication that there are weak correlations between variable retailer awareness and retailer loyalty scoring only 0.24 and also between retailer perceived quality to purchase intention with value of 0.25.
Table 3
Measurement Fit Model Result
No Fitness Test Suitability Criteria Result Explanation
1 RMSEA RMSEA ≤ 0.08 0.062 Good Fit
The fitness tests being used in order to measure the model fit include RMSEA, GFI, AGFI, TLI/NNFI, CFI and CMIN/DF.
According to the results above, all the measurements meet the required criteria, showing RMSEA, GFI, TLI/NNFI, CFI and CMIN/DF are in good fit, while only AGFI is in marginal fit.
Reliability testing is used to determine the reliability of result acquired from the measurement testing regarding its consistency when being done twice or more. Therefore, it can be inferred that the researcher wants to measure the consistency of the measurement used for measuring the same kind of phenomenon. Ferdinand (2000) stated that the limit of the value used as the base of acceptable reliability level is 0.7, having said that, the number itself should not be considered as the absolute measure. In addition, the recommended value of variance extracted should be at least 0.5, where the higher the value of the variance extracted shows that the indicators have been well represented in the development of the latent constructs.
The standardized loading and error value can be obtained directly from the output table of AMOS program. Based on the test result in Table 4 below, the construct reliability values obtained on all variables are greater than 0.7. Therefore, all variables used are considered as generally reliable.
Table 5 Variance Extracted Variables ∑Standard
Loading
∑Standard Loading2
∑Error ∑Standard Loading2 +
∑Error
Variance Extracted
AW 2.15 1.555594 1.44441 3 0,518531
AS 3,565 2,555455 2,44454 5 0,511091
PQ 2,696 1,889278 2,11072 4 0,4723195
RL 2,681 2,398545 0,60145 3 0,799515
PI 1,777 1,584589 0,41541 2 0,792295
Source : data processed by Excel 2010
In the Figure 2 below, the structural model of this study was obtained by processing of the data using AMOS 18.0 software. After that, a series of fitness test is done to check whether the structural model is fit or not. The fitness index test used to measure the model fit include RMSEA, GFI, AGFI, TLI/NNFI, CFI and CMIN/DF as shown on Table 6 below:
Figure 2 Structural Model
Source : data processed by AMOS 18.0
Table 6
Structural Fit Model Result
No Fitness Test Suitability Criteria Result Explanation
1 RMSEA RMSEA ≤ 0.08 0.062 Good Fit
2 GFI GFI ≥ 0.9 0.912 Good Fit
3 AGFI AGFI ≥ 0.9 0.877 Marginal Fit
4 TLI/NNFI TLI ≥ 0.9 0.943 Good Fit
5 CFI CFI ≥ 0.95 0.954 Good Fit
In the structural model, five indices including RMSEA, GFI, TLI, CFI and CMIN/DF have shown good fit, while AGFI shows marginal fit as shown on Table 6 above. Therefore, the structural model in this research have good fit model since most have fulfilled the necessary requirements.
Using AMOS 18.0 software, the hypothesis testing is done through looking at the regression weights values on the CR (critical ratio) column as well as on the P (probability column). In this case, if the value is greater than 1.96, then it can be inferred that the CR values is significant, thus hypotheses is accepted. In contrast, however, when the value is lower than 1.96, it can be concluded that the CR values is not significant, thus hypothesis is rejected. Moreover, if the p-value is less than 0.05, then the relationship is significant, thus the hypotheses is accepted. In contrast, if the p-value is greater or equal to 0.05, it means that the relationship is not significant, thus the hypotheses is rejected.
Based on the hypotheses testing done on Table 7 above, out of 7 hypotheses tested, only 5 are supported, while the other two are rejected.
Table 7
Hypothesis Testing Result
Path Estimate S.E. C.R. P Explanation
H1 PI AW 0.477 0.164 2.901 0.004 Hypothesis Supported H2 RL AW -0.419 0.230 -1.819 0.069 Hypothesis Not Supported H3 RL AS 0.908 0.309 2.941 0.003 Hypothesis Supported H4 PI AS 0.447 0.218 2.049 0.040 Hypothesis Supported H5 RL PQ 0.497 0.214 2.326 0.020 Hypothesis Supported H6 PI PQ -0.678 0.156 -4.333 *** Hypothesis Not Supported
(type II error) H7 PI RL 0.689 0.055 12.538 *** Hypothesis Supported
Source : data processed by AMOS 18.0
This research shows that retailer awareness does not impact retailer loyalty significantly. Therefore, it can be said that the memory recall or recollection of someone or positive retailer awareness to the Hypermart brand does not necessarily result in loyalty to the retailer. It can be inferred that there are still plenty factors which can affect retailer loyalty more significantly than retailer awareness to some degree.
This research shows that retailer association impact retailer loyalty significantly. Hypermart has successfully developed the brand association resulting in the consumers are able to remember Hypermart easier and in a more positive way, which in turn creating a a reason for the consumers to do repeat buying at their place, thus generating loyalty.
This research shows that retailer association impact purchase intention significantly. Hypermart is considered to have positive brand image and associations to the extent that it has created such position where Hypermart has successfully become on consumers’ top-of-mind, leading to consumers having intention to buy from Hypermart.
This research shows that retailer perceived quality impact retailer loyalty significantly. Hypermart is considered to have good perceived quality, thus able to create such experience that leads to repeat buying, thus retailer loyalty.
This research shows that retailer perceived quality does not impact purchase intention significantly. There was a bias in the respondent answers resulting in type II statistical error. Some Hypermart consumers might prefer to purchase products with lower price, rather than whichever products that have higher quality.
CONCLUSION AND RECOMMENDATION
Based on the research result and statistical tests conducted, it can be concluded that from the main 7 (seven) hypotheses developed, 5 (five) of the hypotheses are proven, while the other two are rejected, in which in one of the rejected hypotheses, a case of type II statistical error was found. Nonetheless, these are the following explanations of each research result : 1) Retailer awareness has positive impact towards purchase intention in Hypermart. 2) There is no significant impact of retailer awareness towards retailer loyalty in Hypermart. 3) Retailer association has positive impact towards retailer loyalty in Hypermart. 4) Retailer association has positive impact towards purchase intention in Hypermart. 5) Retailer perceived quality has positive impact towards retailer loyalty in Hypermart. 6) Retailer perceived quality does not have positive impact towards purchase intention in Hypermart, in which there is a type II statistical error exist. 7)Retailer loyalty has positive impact towards purchase intention in Hypermart
Based on this study, there are some recommendation that can be given for the retailer as well as for further research. First is for the retailer to pay more attention on the marketing efforts in terms of endorsing the retailer awareness, retailer association, retailer perceived quality to the consumers. This can be done by doing marketing activities, such as advertisings, loyalty programs, price discounts, and atmosphere improvements. Second, the retailer is advised to be able to mainting a high-quality and long term relationship with customers. It can be done by improving the retailer’s customer relationship management. Third, is that a retailer should understand better regarding the customers, especially the valuable ones. By doing so, retailer can plan formulate and implement certain marketing strategies, particularly segmenting, targeting, and positioning.
REFERENCES
Aaker, David. A. (1996). Building Strong Brands, The Free Press, New York.
Aaker, D. A., & Keller, K. L. (1990). Consumer evaluations of brand extensions. Journal of Marketing, 54(1), 27-42.
Aaker, David. A. (1991). Managing Brand Equity, Maxwell Macmillan Canada, Inc., New York.
Andres, K. (2007). Affecting customer loyalty: Do different factors have various influences in different loyalty levels. University of Tartu - Faculty of Economics & Business Administration Working Paper Series, 58: 3-30.
An Gie Yong & Sean Pearce . (2013) A Beginner’s Guide to Factor Analysis: Focusing on Exploratory Factor Analysis Tutorials in Quantitative Methods for Psychology , Vol. 9(2), p. 79-94.
Banerjee A, Chitnis U. B., Jadhav S. L, Bhawalkar J. S., Chaudhury S. (2009). Hypothesis testing, type I and type II errors. Ind Psychiatry. J;18:127-31
Bennett, Rebekah & Bove, Liliana (2002), “Identifying the key issues for measuring loyalty”, Australasian Journal of Market Research, 9(2). pp. 27-44.
Chi, H. K., Yeh, H. R., & Yang, Y. T. (2009). The impact of brand awareness on consumer purchase intention: The mediating effect of perceivedquality and brand loyalty. Journal of International Management Studies, 4(1), 135-144
Chi, H.K., & Tsai, Y.C. (2011). The influence of perceived value on Consumer Purchase Intention: The moderating effect of Advertising Endorser. Journal of International Management Studies, vol 6 no1.
Das Gopal (2014). Linkages of retailer awareness, retailer association, retailer perceived quality andretailer loyalty with purchase intention: A study of Indian food retail brands. Journal of Retailing and Consumer Services, Vol. 21, No. 3, pp. 284 – 292, An Elsevier, ScienceDirect Publication.
Ferdinand, Augusty (2005), Structural Equation Modeling Dalam Penelitian Manajemen. Badan Penerbit Universitas Diponegoro, Semarang.
Ferdinand, A. (2010). Structural Equation Modelling dalam Penelitian Manajemen: Aplikasi Model – Model Rumit. Penelitian untuk Tesis Magister, Program Magister Manajemen Universitas Diponegoro
Fishbein, M., & Ajzen, I. (1975). Belief, attitude, intention and behavior: An introduction to theory and research. Reading, MA: Addison-Wesley
Fornell, C & Larcker, D. F. (1981) “Evaluating structural equation models with unobservable variables and measurement error”, Journal of Marketing Research, pp 39-50
Ghodeswar B.M. (2008), “Building Brand Identity in Competitive Markets: A Conceptual Model”, Journal of Product and Brand Management, Vol. 17 No. 1, pp. 4-12.
Hair, Joseph F., Black, Bill, Babin, Barry J., et al. (2007). Multivariate Data Analysis: Seventh Edition. New Jersey: Pearson Education.
Hasliza Hassan & Muhammad Sabbir Rahman (2012). Extended Shopping Experiences in Hypermarket, Asian. Journal of Social Science; Vol. 8, No. 11, pp. 138-144,
Jones, T. O., & Sasser, E. E., Jr. (1995). Why satisfied customers defect. Harvard Business Review, (November/December), 88–99
Marx, J.M.M. & Erasmus, A.C. (2007). Customer satisfaction with customer service andservice quality in supermarkets in a third world context. Advances in Consumer Research, Asian Pacific Edition, VII Mattson, K. (2009). Customer Satisfaction in Retail Market. Vaasa University of Applied Science. Unit of
Business Administration. Bachelor’s Thesis.
Pandin, Marina L. (2009). Potret bisnis ritel di Indonesia: Pasar Modern, Economic Review. No 215 Maret 2009
Reichheld, F.F (2003) The One Number You Need to Grow, Harvard Business Review, December, p485-491
Surya, Aristo & Ari Setyanigrum. (2009). “Analisis Persepsi Konsumen Pada Aplikasi Bauran Pemasaran Serta Hubungannya Terhadap Loyalitas Konsumen (Studi Kasus Pada Hypermart Cabang Kelapa Gading)”. Journal of Business Startegy and Execution. Vol.2. Hal 13-39.
Syrett, M. & Lammiman J. (2004) Advertising and the millenials. Young Consumers, 5 (4)
Tsiotsou, R. (2005) Perceived Quality Levels and their Relation to Involvement, Satisfaction, and Purchase Intentions. Marketing Bulletin 16