VERIFICATION AND IMPROVING PLANIMETRIC ACCURACY OF AIRBORNE
LASER SCANNING DATA WITH USING PHOTOGRAMMETRIC DATA
K. Bakuła a, *, W. Dominik a, b, W. Ostrowski a
a
Department of Photogrammetry, Remote Sensing and Spatial Information Systems, Faculty of Geodesy and
Cartography, Warsaw University of Technology, Poland
[email protected], [email protected], [email protected]
b
Okr
ę
gowe Przedsi
ę
biorstwo Geodezyjno – Kartograficzne OPEGIEKA Elbl
ą
g, Poland
Intercommission Working group III/I
KEY WORDS: Accuracy, Quality, LIDAR, Georeferencing, Algorithms, Orthoimage, Measurement
ABSTRACT:
In this study results of planimetric accuracy of LIDAR data were verified with application of intensity of laser beam reflection and point cloud modelling results. Presented research was the basis for improving the accuracy of the products from the processing of LIDAR data, what is particularly important in issues related to surveying measurements. In the experiment, the true-ortho from the large-format aerial images with known exterior orientation were used to check the planimetric accuracy of LIDAR data in two proposed approaches. First analysis was carried out by comparison the position of the selected points identifiable on true-ortho from aerial images with corresponding points in the raster of reflection intensity reflection. Second method to verify planimetric accuracy used roof ridges from 3D building models automatically created from LIDAR data being intersections of surfaces from point cloud. Both analyses were carried out for 3 fragments of LIDAR strips. Detected systematic planimetric error in size of few centimetres enabled an implementation of appropriate correction for analyzed data locally. The presented problem and proposed solutions provide an opportunity to improve the accuracy of the LiDAR data. Such methods allowed for efficient use by specialists in other fields not directly related to the issues of orientation and accuracy of photogrammetric data during their acquisition and pre-processing
* Corresponding author
1. INTRODUCTION
Topographic photogrammetry is currently dominated by two leading technologies of data acquisition. One of them is the usage of aerial images and their subsequent matching, and the second one is airborne laser scanning (ALS). Both technologies are often applied as alternatives for themselves in creation of final products, such as point clouds and the result of their processing – digital elevation models or 3D city models. Moreover, products being a fusion of these two data sources have been increasingly more common for last years. Their interaction for improvement accuracy of the final products has been also observed recently. Image-based data that are quasi-continuous imagery of reality make it possible to clearly indicate control points that provide centimetre-level accuracy of images exterior orientation.
Airborne laser scanning (ALS), often named LIDAR (this abbreviation has wider meaning) was initially seen as a technology for height measurements of the terrain in order to generate high-resolution digital elevation models. After its implementation in commercial use, LIDAR systems accuracy of points clouds was considered mostly vertically (Shan & Toth, 2008). In later years, with increasing density of point clouds provided by LIDAR, its potential use in the context of other applications has been noticed. The issue of planimetric accuracy of the LIDAR data has been started to be a subject of discussion.
Planimetric accuracy of LIDAR point cloud depends on many factors, among which followings can be worth noting: random errors related to the measurement of point such as GPS error, IMU orientation error, accuracy of reference of the recorded direction to the object point, accuracy of recording of the deflection angle of the laser beam (Kraus, 2007), errors caused by complexity of terrain (i.e. different incidence angles) (Shaer
et al., 2007) or errors caused by multiple reflections of the laser beam (Beraldin et al., 2010). In addition to these random errors in the estimation of planimetric accuracy also other factors approaches should be also mentioned: systematic errors related to not perfect alignment of GPS and IMU, as well as errors arising in the transformation between reference systems or disregard or erroneous inclusion of Earth’s curvature and length distortion of the map projection (Lichti & Skaloud, 2010).
Modern photogrammetric technologies allows to obtain point clouds with a relative accuracy of 2-3 cm (Vosselman, 2008) that can be achieved by use of specially-designed targets that allowed Csanyi & Toth (2007) to have such result at a density of 16 pt./m2. However, the lot of work associated with the use of control targets as well as the need for their installation before the flight cause that it is not a perfect solution (Ray & Graham, 2008). Towards these problems and limitations, in this paper two methods for verification and improving of local biases for LIDAR point clouds are proposed. They are based on very large number of reference measurements from photogrammetric products. In contrast to the concept of using re-projection proposed by Schenk et al. (2001), in this article the potential implementation of independent measurements on the true-ortho The International Archives of the Photogrammetry, Remote Sensing and Spatial Information Sciences, Volume XL-3/W1, 2014
and their later use for assessment and improvement of planimetric accuracy of LIDAR point clouds were examined. True-ortho provides a very large number of features which may be possibly measured for a reliable assessment of the accuracy and the estimation of local planimetric corrections for LIDAR data. The key advantage of true-ortho usage is the opportunity of reference measurements selection not only on ground level, but also on roofs of buildings surface.
2. METODOLOGY
The authors present two methods for verification and improvement of the planimetric accuracy of LIDAR data through the calculation of local (sub-block) error. The first one was based on manual measurement points on the roads. The second was related to the distance between the ridge generated automatically from LIDAR data and created from the true-ortho. Results obtained from both methods were compared to each other. Based on this comparison, conclusions were drawn concerning the possibility of using true-ortho from dense matching in assessment and correction of horizontal accuracy of LIDAR data. In this paper, development trends of presented methods were also outlined to make the best of their use in proposed, practical applications of photogrammetric data.
2.1 Data used
In presented research, aerial imagers and LIDAR data were used. Such datasets were collected in flight missions involving the whole city of Elblag whose area is about 100 km2. Both flight missions were conducted in March 2011 (before vegetation season) with an interval of three weeks. As a test study for the experiments a fragment of block (approximately 0.5 km2) with dense urban buildings was adopted.
Aerial images were acquired by Intergraph DMC II 230 camera with 80% overlap and 40% sidelap. GSD of these images is 5 cm. Block of 2243 images was adjusted with the use of 86 GCPs. The obtained accuracies estimated in respect to 96 check points were as follows: RMSE of 2.9 cm (X (Easting)), 3.8 cm (Y (Northing)), 4.5 cm (Z). On the basis of adjusted block of images, point clouds were generated with the use of matching algorithm implemented in SURE application made available for scientific purposes by the Institute of Photogrammetry, University of Stuttgart (Rothamel et al. 2012). In this application the algorithm of semi-global matching by Hirschmüller (2008) is implemented with minor modifications. Such point clouds with assigned RGB values from images were subsequently used to create raster images of point clouds in an orthogonal view. These images created a mosaic (true-ortho) of test area with a spatial resolution of 7 cm. As it was the reference for presented research concerning planimetric accuracy, measurements of the absolute accuracy of true-ortho was also verified. 21 check points, located around test area, were measured using RTK GPS. Differences between coordinates from true-ortho and surveying measurements determined characteristics of accuracy of true-ortho. Based on the results presented in Table 1, it can be concluded that the true-ortho shows no bias and RMSE is 3-4 cm what is comparable with accuracy of RTK GPS measurements. Hence, it shows that this true-ortho is a product of high accuracy and it can be applied as a reference data for assessing planimetric error of LIDAR data.
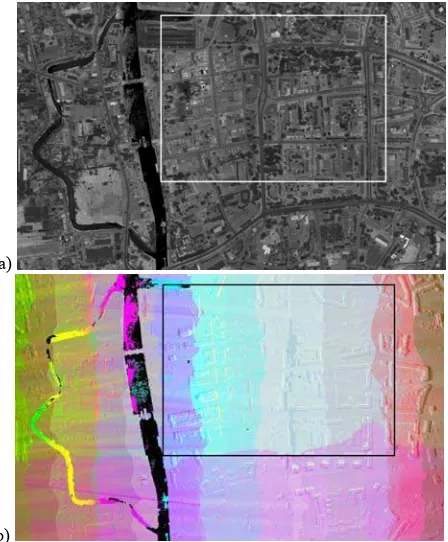
a)
b)
Figure 1. Test area – part of Old Town in Elbląg, Poland: intensity image of LIDAR (a) and its scanning strips (b)
Parameter X (Easting) [m] Y (Northing) [m]
average residual -0.001 0.014
RMSE 0.038 0.034
standard deviation 0.038 0.031
Table 1. Accuracy characteristics of true-ortho
LIDAR data was acquired in Airborne Laser Scanning technology by Riegl LMS-Q680i scanner with 60% sidelap between scanning strips. A total of 70 strips were acquired. The average density of point cloud in single scanning strip was approximately 10 pt./m2. The obtained data were subjected to a process of internal, relative alignment and oriented with the use of reference planes surveyed in situ. This process was carried out in RiProcess software which is applied for raw LIDAR data acquired by Riegl scanners. As the reference planes, roofs of buildings in 5 locations were used. In each location two roof planes oriented perpendicularly to each other were measured. Relative alignment of block was carried out using 117875 observations on tie planes and as a result of it corrections for each scanning strip trajectories were determined. After this process the whole LIDAR block was oriented with the use of previously mentioned reference planes. Basing on residuals on reference planes a global shift of 4.4 cm (X), 6.0 cm (Y) and 2.8 cm (Z) for the whole block was calculated. After the adjustment the RMSE calculated from residuals on the reference planes was 4.2 cm with the highest residual value of 8.8 cm. In presented research fragments of three scanning strips were selected and intensity images with 15 cm GSD were prepared (Figure 1). Each of the intensity image was created by assigning to each pixel the average intensity value (scaled to 8-bit grayscale) of all LIDAR points located inside this pixel. The intensity values for pixels with no points in its range were determined by linear interpolation.
2.2 Measurements of points on intensity raster
Since it was possible to register the intensity of the reflected signal, studies on the reflectance image have been carried out (Maas, 2002). Although the intensity images look similar to optical images, they have different characteristics. In addition, the intensity images are usually much more noisy, which was
noticed by Vosselman (2002).https://drive.google.com/file/d/0B1o4x0y6g37BQkxFR
nA3TE14TGc/edit?usp=sharing Despite the limitations indicated in his research, Vosselman proves that it is possible to use edges obtained from intensity to determine the differences between the scanning strips. Another proposal of using reflectance images in research on divergences between the strips orientation can be found in Maas (2001). He proposes fitting of surface fragments in TIN structure where, instead of elevation, the intensity value was applied. Maas states that he is able to determine planimetric discrepancies between scanning strips with an accuracy of¼ of the distance between points
.
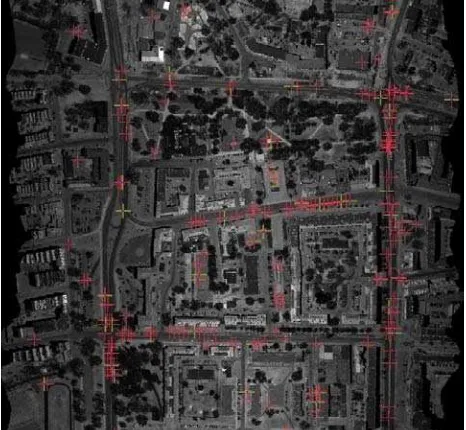
Application of the intensity images, as one of the observation groups used to define boresight misalignment, is proposed by Burman (2000). Another example in this issue is the research presented by Toth et al. (2007) where intensity is applied to improve the absolute, planimetric accuracy of LIDAR data by matching of corresponding pavement markings on roads from GPS surveying measurements and the same features identified on LIDAR reflectance image. Similarly, Ray & Graham (2008) propose in this case digitalization of road markings on orthoimage from LIDAR intensity and their usage in the absolute orientation improvement.The first method proposed by authors in this paper is to measure planimetric discrepancies between homologous points on the true-ortho and intensity image. The presented method was based on manual measurement of corresponding points which were selected usually as characteristic points identified in intensity images firstly, because of lower spatial resolution of this image. The most frequently selected points were those, which was associated with white markings of roads, manholes and pavements surface because of their high contrast on intensity images. The eexample of points measured in this case is shown in Figure 2 which presents spatial distribution of observations.
Figure 2. Spatial distribution of points measured on intensity image and true-ortho.
Due to the limitations of low-resolution images of intensity and their significant noise (Maas, 2001), middles of lines and centres of visible small pavement figures were frequently a subject of manual measurement. Theoretically, they are less biased than ends of linear objects or edges of surface objects.. In this studies the automation of measurements also was attempted but it was associated with many difficulties caused mainly by a different geometry of the photogrammetric data. These data are derived from a different source, from different flight missions, consequently, they have different distribution of obscured areas. Another problems in this issue are shadows that can be observed mainly on optical images as well as the fact that the spectral characteristics of objects reflectance in the visible range (even in near-infrared spectrum) and for intensity of reflection are different. This is especially evident for the vegetation. Analyzing the true-ortho images in near-infrared spectrum, the vegetation is represented by high radiometric values and because of the low value of reflection, tree in the intensity raster are in dark radiometric value. In the case of automation for corresponding points measurement, mentioned two problems make this issue particularly difficult for the Area-Based Matching methods. The solution of this problem was to analyze only fragments of raster where there were no obscured areas. It was, therefore, decided to analyze only fragments of roads without any difficulties related to distinguishable radiometry of two data source. Additionally, only small pieces of true-ortho and intensity raster were subjected to matching procedure.
Considering the methodology of LIDAR block georeferencing, it was assumed that the whole block can be under influence of planimetric error. The analysis, however, was also carried out separately for the three scanning strips. An errors for X and for Y coordinates were separately analyzed in this approach by estimation of appropriate corrections for both directions. Dataset of measured points and the results were evaluated by statistical parameters such as mean value of error, median value as well as standard deviation of observations (STD) and root mean square error (RMSE) for situational assessment of the accuracy of the LIDAR data.
2.3 Roof ridges measurements
Second of the presented methods was based on normal distances between the ridge lines of buildings which were automatically extracted from LIDAR dataset and digitalized on true-ortho to estimate planimetric displacement. Ridge lines of gable roofs, obtained as intersection lines of two planes fitted into point cloud, are one of most accurate features extracted from ALS data and because of that they are used, therefore, to improve relative planimetric accuracy of the point clouds (Vosselman, 2008).
In the presented study, automatic classification of point cloud and building roofs extraction in TerraSolid software were performed. Figure 3 shows two examples of the true-ortho together with extracted roofs lines. Building models were generated in TerraScan module, which is equipped with algorithm fitting planes from parts of point cloud classified as ‘buildings’ and merging them, subsequently, in order to create roofs models.
Figure 3. Examples of automatically generated 3D models of buildings with true-ortho from aerial images in a background.
Ridge lines of selected building were also independently digitalized form true-ortho. The displacement between the corresponding roofs ridges from both data source were calculated as distance in normal direction (perpendicular to the direction of ridge line). The vector of displacement was computed in least-squares adjustment in order to minimalize squares sum of normal distances between the corresponding ridge lines. The alignment procedure was performed four times: three individually for each of scanning strip and one for all scan lines all together.
3. RESULTS
3.1 Results of points measurements
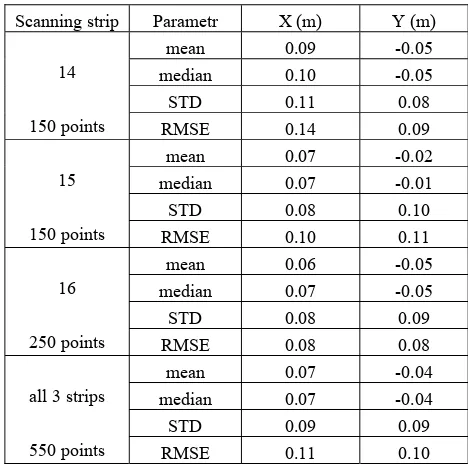
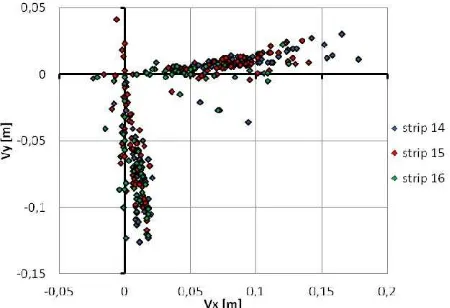
The results of measurements on intensity raster (planimetric displacement for each point) for single scanning strip are presented in Figure 4. Measurements was carried out for 550 points totally in three strips: 150 points were measured in strip 14, next 150 in strip 15 and 250 in strip 16.
Scanning strip Parametr X (m) Y (m)
mean 0.09 -0.05
median 0.10 -0.05 14
STD 0.11 0.08
150 points RMSE 0.14 0.09
mean 0.07 -0.02
median 0.07 -0.01 15
STD 0.08 0.10
150 points RMSE 0.10 0.11
mean 0.06 -0.05
median 0.07 -0.05 16
STD 0.08 0.09
250 points RMSE 0.08 0.08
mean 0.07 -0.04
median 0.07 -0.04 all 3 strips
STD 0.09 0.09
550 points RMSE 0.11 0.10
Table 2. The result of measurements of points on LIDAR intensity image.
In Figure 4, there are clearly visible significant shift in X direction for all strips, which is confirmed by statistic parameters (Table 2). The value of potential, planimetric correction was computed as an additive inverse of median value of horizontal displacement for whole test area. The final correction caused by shift parameters in this method were calculated as -0.07m in X direction and +0.04 m in Y direction.
Figure 4. Planimetric residuals of points measured on the intensity raster in respect to their location on true-ortho for
3 analyzed scanning strips.
3.2 Results of roof ridges measurements
In the presented research a total number of 321 building models was used. 126 of them were created from strip number 14, 129 - from 15 strip and 66 - from 16 strip. Figure 5 shows the values of offset vectors between ridges obtained from 3D model from ALS data and those digitalized on true-ortho. It is worth noting that the concentration of points along X and Y axis is caused by orientation of roofs surfaces in test field. Points located around X axis are related to ridges oriented in N-S direction and they have essential influence on determining error in X direction. Respectively, points around Y axis are associated with ridges oriented in E-W direction and they have key impact on estimation of error in Y direction.
Figure 5. Measurements of plannimetric errors of roof ridges for all 3 LIDAR strip.
Table 3. The result of measurements of roof ridges from 3D building models.
In this method shift values were computed with last squares method and its results are presented in Table 3. Displacement estimated from ridge lines is similar to those measured on intensity images (Table. 2). In all three strips determined errors are in comparable size. Only results for scanning strip 16 slightly differs from others which can be caused by lower number of ridges measured for this fragment due to topography of urban area. The key point of analysis of this approach is fact that value of standard deviations are much lower than in previous method. The final correction caused by shift parameters was finally calculated as -0.08 m in X direction and +0.06 m in Y direction in this approach.
4. DISCUSSION
Both of the methods resulted in similar values of planimetric error for the analyzed area. Statistical analysis indicate that the usage of measured roof ridges of buildings was more accurate method. However, this method is more labour-consuming and difficult to automate. Approach of measuring points on intensity image has a relatively higher standard deviation. It is worth mentioning that both methods have some limitations. First of all, proper characterization of the topography of the area is required for their correct execution. Roof ridges usage must provide their appropriate number and orientation in different directions. Application of points on intensity image needs the occurrence of the relevant details in the area. Consequently, there is no doubt that both methods will ensure the best results for urban areas.
The results for both the whole test object and individually for all strips are quite comparable in two presented methods, which confirms the correctness of both approaches as well as possible detection of the planimetric error of sub-block character. The presented methodology shows that it is possible to determine analyzed error with the value much lower than the image intensity resolution and point spacing in LIDAR datasets. The results are in accordance with authors’ expectations and some small differences between the estimations for separate strips can also be related to the accuracy of their relative orientation. The results of points measurements are characterized by a visible, large dispersion of residual values. Manually measured points can be difficult in identification in the intensity images what is also mentioned by Ray & Graham (2008). However, investigation, carried out in this research, proves that in the case of good quality data, it is possible to select many corresponding points and their redundancy gives the opportunity to find expected value of planimetric shift of ALS data without gross errors influence. Nevertheless it is not recommended to apply approach based only on manual measurements for the whole block error estimation. On the other hand this paper proves the potential of this type of analysis. In such approaches it is very important to have large contribution of automation in corresponding points detection (Burman, 2000; Maas, 2002) which is related, however, to many previously mentioned problems. In contrast to other papers considering analyzed subject, detected errors are in small size, which is caused by increasingly higher quality of modern photogrammetric data characterized by a very small GSD (aerial photos) and high density of point clouds from LIDAR.
In this study the intensity of laser beam reflection was applied to determine the absolute accuracy of ALS data with product of aerial image processing (true-ortho) as a reference while in the literature it is more likely to find approach using the intensity in analyzes of the accuracy ALS where it is applied in assessment and correction of only relative LIDAR data orientation. (Burman, 2000; Maas, 2002). Presented research differs from many other methods regarding to the absolute accuracy, because in contrast to those approaches investigated by in example Csanyi & Toth (2007) it is not based on control targets what is useful for production data already archived in the repository. For such data it is assumed that contractor of photos could not have taken care of a sufficient number of control targets for analysis ensuring extremely high planimetric accuracy of LIDAR data, because a purpose of such data collection was focused on elevation accuracy.
5. CONCLUSSION
Taking into consideration high accuracy of reference data shown in the section presenting used photogrammetric products, it was able to calculate planimetric error and correct it to the level required from LIDAR data for proposed surveying application. Error of a few centimetres should be corrected by implementation of appropriate correction to the georeference of point cloud or products of its processing. The presented approaches can be used successfully for specific studies in local range dedicated especially to surveying projects requiring enhanced horizontal accuracy of LIDAR data and products of their processing. However, in the case of LIDAR data application in large scale projects, in such issues, whole block or its fragments should always be considered. That may specify a representative distribution of estimated errors for the whole analyzed area. Such action cannot be limited to manual measurements, which are expected to represent large redundancy. The effectiveness of methods for such correction can be only guaranteed by automatic techniques of corresponding features matching (points, lines). Application of Area-Based matching algorithms, with true-ortho as reference, can be difficult due to different characteristics of both data source.
In future, planned work should be focused on the larger and less fallible participation of automatic matching techniques in the planimetric comparison for bias estimation of the most important photogrammetric data sources - aerial images and LIDAR datasets. It should also concern evaluation of such methodology or just the potential of intensity images or building ridges in augmentation of horizontal accuracy of LIDAR data for that represents worse quality parameters. It could be used then for the data already acquired in country-wide or regional systems in applications requiring high planimetric accuracy.
6. REFERENCES
Beraldin, J.-A.; Blais, F.; Lohr, W. 2010. Laser scanning technology. Vosselman, G.; Maas, H.-G. (Eds.). Airborne and Terrestrial Laser Scanning, pp.1-42.
Burman, H. 2000. Adjustment of laser scanner data for correction of orientation errors. International Archives of Photogrammetry and Remote Sensing. Vol. XXXIII, Part B3/1, pp.119-126
Csanyi, N.; Toth, Ch.K. 2007. Improvement of Lidar Data Accuracy Using Lidar-Specific Ground Targets.
Photogrammetric Engineering & Remote Sensing, Vol. 73, No. 4, pp. 385–396.
Hirschmüller, H., 2008. Stereo Processing by Semiglobal Matching and Mutual Information. IEEE Transactions on Pattern Analysis and Machine Intelligence 30, 328-341.
Kraus, K., 2007. Photogrammetry: Geometry from Images and Laser Scans. Walter de Gruyter, Berlin.
Lichti, D.; Skaloud, J. 2010. Registration and Calibration. Vosselman, G.; Maas, H.-G. (Eds.). Airborne and Terrestrial Laser Scanning, pp.1-42.
Maas, H.-G., 2001. On the Use of Pulse Reflectance Data for Laserscanner Strip Adjustment. ISPRS Workshop on Land
Surface Mapping and Reconstruction using Laser Altimetry, Annapolis/Maryland, 22-24. oct. 2001, IAPRS Vol. XXXIV, Part 3/W4
Maas, H.-G. 2002. Methods for Measuring Height and Planimetry Discrepancies in Airborne Laserscanner Data.
Photogrammetric Engineering & Remote Sensing, Vol. 68, No. 9, pp. 933-940.
Ray, J.A.; Graham, L. 2008. New Horizontal Accuracy Assessment Tools and Techniques for Lidar Data. Proceedings of the ASPRS Annual Conference, Portland/Oregon, USA, 12 p.
Rothermel, M., Wenzel, K., Fritsch, D., Haala, N. (2012). SURE: Photogrammetric Surface Reconstruction from Imagery.
Proceedings LC3D Workshop, Berlin , December 2012.
Schenk, T; Seo, S.; Csatho, B. 2001. Accuracy study of airborne laser scanning data with photogrammetry.
International Archives of Photogrammetry and Remote Sensing. Vol. XXXIV-3/W4, Annapolis, MD, pp.113-118.
Schaer, P., Skaloud, J., Landtwing, S. and Legat, K., 2007. Accuracy estimation for Laser point cloud including Scanning geometry. 5th International Symposium on Mobile Mapping Technology (MMT2007), Padua, Italy.
Shan, J., Toth, C., Eds, 2008. Topographic Laser Ranging and Scanning: Principles and Processing, CRC Press/Taylor & Francis Group. 608 pp.
Toth, C.; Paska, E.; Brzezinska, D. 2007. Using Pavement Markings to Support the QA/QC of LIDAR Data. International Archives of Photogrammetry, Remote Sensing and Spatial Information Sciences, 36 (3/W49B) pp. 173-178
Vosselman, G., 2002. On the Estimation of Planimetric Offsets in Laser Altimetry Data. International archives of Photogrammetry, Remote Sensing and Spatial Information Sciences, vol. 34, part 3A, Graz, Austria, pp. 375 -380.
Vosselman, G. 2008. Analysis of planimetric accuracy of airborne laser scanning surveys. International Archives of Photogrammetry, Remote Sensing and Spatial Information Sciences, vol. 37, part 3A, Beijing, China, July 3-11, pp. 99-104.