Mapping Statistical Characteristics of Frosts in Iran
P. Mahmoudi*
Department of physical geography, Faculty of geography and environmental planning, University of Sistan and Baluchestan, Zahedan, Iran - [email protected]
KEY WORDS: Mapping, Frost, Iran, Multivariate regression, GIS,
ABSTRACT:
To model and map the statistical characteristics of frost in Iran, the data related to the minimum daily temperature for a 15-year period (1990-2005) was obtained from Iran Meteorological Organization. Then using multivariate regression models, the relationship among five statistical characteristics, i.e. the mean Julian day of the first frost, mean Julian day of the last frost, mean number of frost days per year, mean length of the frost period and mean length of growing season were modeled by three geo – climate factors: elevation, longitude and latitude. The precision of each model was explored using four hypotheses: linearity of the relationship between independent variables and the dependent variable, normality of errors, constancy of error variance and lake of correlation of errors were tested, and their precisions were confirmed. At the second stage, contour lines resulting from STRM were converted to the point features class. Altogether, 661'474 points were gathered from all over Iran. Then, the studied five frost characteristics were generalized to 661'474 points; then, the regionalization maps of statistical characteristics of frost were obtained for Iran using Kriging interpolation method.
The results showed that the temperature of highland areas above 4'200 m above sea level always was at least zero and below zero during the year, and also the coastal strip of southern Iran had no frost. Elevation was the most effective factor in the spatial arrangement for the frequency of occurrence of Julian day of the first frost. The most effective factors in spatial arrangement for the frequency of occurrence of Julian day of the last frost, length of frost period and length of growing season were elevation and latitude. Finally, spatial arrangement for the frequency of occurrence of the frost days was also a function of three factors of elevation, longitude and latitude. The dominant role of elevation in spatial arrangement for the occurrence of the first frost day in Iran showed that the occurrence of the first frost day in Iran could be of the type of radiation frosts and the dominant role of elevation and latitude demonstrated that late-winter frosts can be mostly of the type of advection frosts. Therefore, arrangement of statistical features of frost in Iran is both a function of geo – climate factors and the synoptic systems which have entered the country.
1. INTRODUCTION
In climatology studies, the regions in which direct observations are not conducted are inevitably dealt with in order to map various characteristics of climate variables. So, to solve this problem in the regions without stations, various statistical and geo–statistic methods have been used. Meanwhile, generalization of statistical characteristics of frosts and then thier interpolation seem more difficult compared with other variables, because of the dependence of these characteristics on various factors like elevation (Boer et al, 1993), topography situation (Lindkvist et al, 2000), longitude and latitude (Madelin and Beltrando, 2005), distance from seas (Zinoni et al, 2002), soil type (Avissar and Mahrer, 1988 a and b; Figuerola and Mazzeo, 1997), vegetation (Avissar and Mahrer, 1988 a ,1988 b), cloudiness and wind (Laughlin, 1982; Laughlin and Kalma, 1987; and Laughlin and Kalma, 1990) .Therefore, it is possible to make more precise maps for the statistical characteristics of frosts by quantifying the relationships between these characteristics and some geo –climate factors.
Regionalization maps of frosts are usually made using Topo – climatology studies )Geiger, 1966; Hogg, 1966, 1968; Lomas and Gat, 1971; Suzuki et al, 1982; Richards, 2000; Jarvis and Stuart, 2000 a, 2000b; Zinoni et al, 2002; Richards, 2000; Richards and Baumgarter, 2003). However, since the late 1960's, thermography has been used in Topo-climatology studies by using aerial infrared images. Nixon and Hales (1975), and Sutherland and Bartholic (1974), Sutherland et al (1981) explained the application of this method in a nightly
temperature study in gardens. Thermal band images taken from satellites have been also available in the recent decays and are used in the study of the ground level nocturnal temperatures (Chen et al, 1976; Dalezios and Lavrediadou, 1995; Kerdiles et al, 1996; Jurgens, 1997; Francois et al, 1999).
In Iran, some statistical characteristics of frosts like the earliest autumn frost, latest spring frost, length of growing season, frost frequency, etc. have been regionalized at small and large scales using geographic information system (GIS); the frequency of occurrence atlas of the minimum temperatures in Fars province was provided by Ziaee et al (2006). Khosravi et al (2009) tried to regionalize frostbite risk on garden products in Mahvalat region in Khorasan Razavi province using geographic information system (GIS). They identified three areas (high risk, risky and low risk) in this region by overlaying spatial – temporal ocurrence maps of the latest spring frost and dominant garden species. Two-, three- and four-day persistences of Iran frosts were also extracted by Alijani et al. 2010) for 58 synoptic stations in Iran, and the interdependence of frost days was modeled using Markov chain model, finally, regionalization maps of frost persistence days were provided for all parts of Iran. Mahmoudi et al. (2011) extracted five statistical features, i.e. the mean Julian day of the first frost, mean Julian day of last frost, mean number of frost days, mean length of frost period and mean length of growing season for 62 synoptic stations in Iran; then they divided Iran to 6 separate regions using cluster analysis and provided their maps.
establishment of weather stations, and for countries like Iran which are deprived of automatic weather stations technologies, such geographical obstacles are still considered as limiting factors. The highest weather station among the studied stations in this research was located at 2'285 meters height (in the studied period). Since the highest point in Iran is above 5'500 meters height and over 4 percent of areas in Iran (about 70'000 square km) are above 2'600 meters height, it means that aerial observation have not been conducted in 70'000 square km of mountain areas in Iran, and weather data are available for them. There is this problem for Iran desert areas as well. However, density of stations in some parts of Iran is very low and, basically, no regular measurement of weather has been conducted in the area about 150'000 square km.
Thus, the initial goal of this research was to extract the statistical features of frosts in Iran stations and then to generalize them to points without stations using multivariate statistical methods; finally, regionalization maps of statistical characteristics were provided for Iran.
2. METHODOLOGY
2.1 The Studied Region
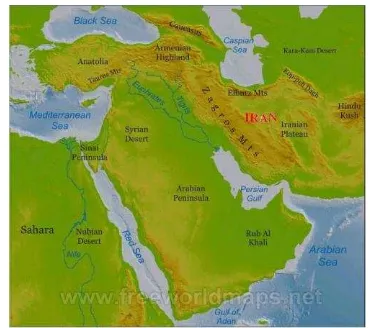
Iran with an area over 1'648'195 square km is located between 25 to 40 degrees north latitude and 44 to 64 degrees eastern longitude. Iran's landscape is dominated by rugged mountain ranges that separate various basins or plateaus from one another. The populous western part is the most mountainous, with ranges such as the Zagros and Alborz Mountains, the latter of which also contains Iran's highest point, the Damavand at 5,671 m (18,606 ft). The eastern half mostly consists of uninhabited desert basins with the occasional salt lake. The only large plains are found along the coast of the Caspian Sea and at the northern end of the Persian Gulf, where Iran borders on the mouth of the Arvand River (Shatt al-Arab). Smaller, discontinuous plains are found along the remaining coast of the Persian Gulf, the Strait of Hormuz and the Sea of Oman. The Iranian climate is mostly arid or semiarid, though subtropical along the Caspian coast (Fig. 1).
Figure 1. Geographical location of Iran in the middle east
2.2 Methods and Materials
To model and map the statistical characteristics of frost in Iran and to achieve its spatial and temporal patterns, the data related to daily minimum temperatures of 69 synoptic was taken from Iran Meteorological Organization for a 15-year period (1990-2005) from October to May. The distribution and scatter of the studied stations in Iran are shown in Figure 2.
Figure 2. Map of location and scatter of the selected stations
After data gathering and database formation, it was observed that the first frosts started in October in most stations and for the same reason, the first day of October was selected as the baseline day and the remaining days were counted relative to this baseline. For example, if the first zero- Celsius temperature occurred at day 63 in a station, (since the baseline was October 1), the day 63 would be equal to December 2 and as such, if the first under zero-Celsius occurred at day 202, it would be equal to April 20. After adjusting the data based on the Julian day, five frost characteristics including the mean Julian day of the first frost, mean Julian day of the last frost, mean number of frost days per year, mean length of frost period and mean length of growing season, were extracted separately for every station. At the second step, five frost characteristics that were extracted from the first stage were separately modeled with three geo– climate factors of: elevation, longitude and latitude using multivariate regression models. Regression models are models that are used for studying the relationships between variables, especially the way a variable depends on another. In these statistical models, it is assumed that the relationship between independent variables (height, longitude and latitude) and dependent variables (the five statistical characteristics of frost) was as follows:
(1)
x
b
x
b
p
x
pb
b
y
0
1 1
2 2
....
Where the parameters
b
1,
b
2,
...
,
b
p are partial regressioncoefficients and
b
0 is intercept value that is also called regression constant. The Enter method was selected for entering the variables. In this method, all the gathered variables are entered in the model simultaneously without any priority and the model is calculated. To measure the precision of obtained models, four fundamental hypotheses were tested. The hypotheses were as follows: The hypothesis that there is a relationship between independent variables and dependent variable.
The hypothesis of error normality
The hypothesis that error variance is constant
The hypothesis that errors are uncorrelated
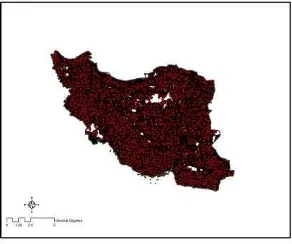
the world topography digital maps database at http://dds.cr.usgs.gov/srtm. These maps are zipped and run in the "global Mapper" software environment. In this software environment, the contour lines' distance of 100 m are defined for Iran and saved as Shadflies; then, they were moved to Arc/GIS software environment (Figure 3). In this stage, because it is impossible to solve obtained regression models for each of statistical characteristics in contour lines, all contour lines that were within Iran political scope were converted to points. The numbers of obtained points was 661'474 in total (Figure 4). Now, all 661'474 points obtained for Iran had longitude, latitude and elevation. Therefore, using the obtained regression models, it is possible to calculate statistical features of frosts for all points in Iran and generalize them to points without stations. Finally, each of five frosts characteristics in Iran were regionalized using the Kriging interpolation method.
Figure 3: Iran topography map with the contour lines of 100 m
Figure 4: Map for converting Iran contour lines to a point map (the number of points is 661'474)
3. RESULTS
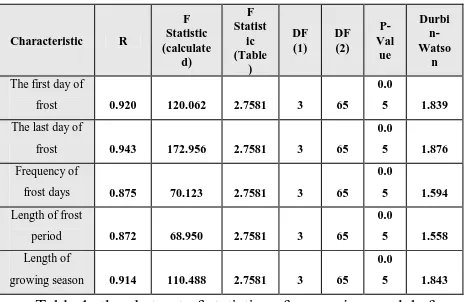
After entering the three variables of: elevation, longitude and latitude in the regression model simultaneously, it was seen that correlation coefficients of these three variables with the first day of frost in Iran was 0.92; the last day of frost was 0.94; mean frequency of frost days was 0.87; and mean length of growth season was 0.91 (Table 1). Therefore, it was possible to explain about 76 to 89 percent of spatial changes for these five frost features by these three variables in Iran (Table 1).
Linearity of the relation between independent variables (elevation, longitude and latitude) and dependent variables (five statistical features of frost) was also tested by the statistic F. it is known that the "calculated F" for each of five frost characteristics is greater than the "tabular F" (=2.76) and, as a result, the linearity hypothesis of the relation between independent variables and dependent variables was accepted in these models. The hypothesis that errors are uncorrelated was also tested by Durbin-Watson test. Because the test value for the
five studied features was between 1.5 and 2.5, this hypothesis was accepted as well (Table 1). The normality of errors was tested using P-P plot (Figure 5). In this plot, since the coordinates of observed points were close to the normal line, it can be said that residuals follow the normal distribution. However the hypothesis that errors' variance is constant was tested by a plot, it's the horizontal axis of which was standardized predicted values and its vertical axis was standardized residual values. Based on Figure 6, no specific trends can be seen in these plots, so this hypothesis was also accepted for each of these frost characteristics.
Figure 5: P-P Plots in order to test the normality of errors for five statistical characteristics of frosts in Iran
Last day of frost first day of frost
Length of frost period frequency of frost days
Length of growing season
Figure 6: Scattering plots of standardized residual values against standardized predicted values for five statistical
Therefore, according to the results obtained from hypothesis tests, the regression models can be explained for the five frost characteristics using three geo – climate factors of: elevation, longitude and latitude as follows:
First day of
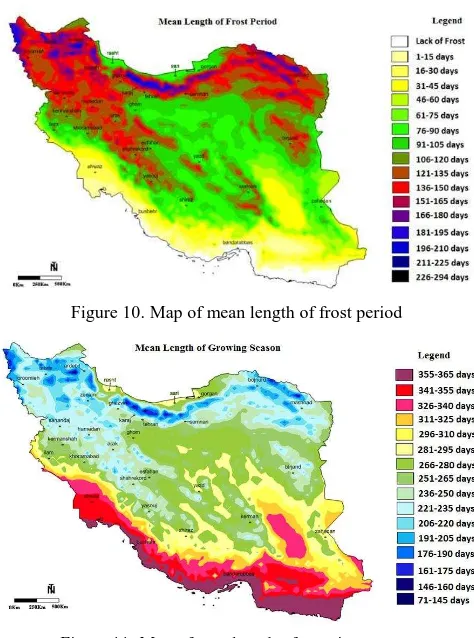
Now, regionalization maps of statistical characteristics of Iran frosts were obtained using these models and Kriging interpolation method. The obtained maps showed that, regardless of the regions with heights above 4200 m above sea level whose minimum daily temperature is usually zero and below zero, the earliest start date of frost occurred between July 4 and September 3 in the middle heights of Alborz Mountains, west and northwest heights. Also, frost's latest finish date occurred between January 11 and February 8 in low regions of southern and southeastern Iran (Figure 7). The coastal strip of southern Iran had no frosts. Then, frost's latest finish date, regardless of the heights above 4200 m occurred between July 20 and August 10 in middle heights of Alborz Mountains, northwestern heights and middle heights of Zagros Mountains. Also, frost's earliest finishes date occurred between December 29 and January 26 in low regions of southern and southeastern Iran (Figure 8). Figures 9, 10 and 11 show other three features, i.e. frequency of frost days, length of frost period and length of growing season, in Iran.
Figure 7: Map of mean Julian day of the first frost in Iran
Figure 8. Map of mean Julian day of the last frost in Iran
Figure 9. Map of the mean frequency of frost days
Figure 10. Map of mean length of frost period
Characteristic R
Table 1- the abstract of statistics of regression models for statistical characteristics of frosts in Iran
4. CONCLUSIONS
Study of spatial specifications of frost characteristics not only is useful for many agricultural, transportation and energy applications but also show a good picture of frost capability in a region.
After entering the independent variables into regression models and studying the correlation coefficients, it was concluded that the spatial arrangement of Julian day of the first frost in Iran was a function of elevation, spatial arrangement of Julian day of the last frost and, length of frost period. Also, length of growing season was a function of elevation and latitude and, frequency of frost days is a function of elevation, longitude and latitude. It should be noted that many other factors such as vegetation, land situation, slope direction, etc. are involved which were not considered in this research.
The dominant role of elevation in spatial arrangement of Julian day of the first frost in Iran showed that Julian day of the first frost in Iran can be of the type of radiation frosts. But, in the case of Julian day of the last frost in Iran, it can be seen that two geo – climate factors of: elevation and latitude had the greatest role in spatial arrangement of this frost characteristic in Iran. So, it can be concluded that, in addition to elevation, synoptic systems had a greater role in Julian day of the last frost. So, the late-winter frosts can be mostly of the type of advection frosts (Barati, 1996).
Additionally, spatial arrangement of each five statistical characteristics of frost in Iran was coordinated with the entry and exit of large-scale atmospheric systems. As cold season starts in autumn and subtropical high pressure gradually retreats to lower latitudes, the conditions for the entry of western winds from western and northwestern Iran are provided. Over time, since subtropical high pressure system is located at their lowest position at early-winter, western winds cover more area of Iran, even in south. As the northern hemisphere gets warm, subtropical high pressure system starts to extend toward higher latitudes and, simultaneously, waves of western winds start to exit from Iran from north and northeast. So, western winds from west and northwest enter Iran earlier than other regions, and exit from Iran later than other regions. The length of frost period and other statistical characteristics of frost in western and northwestern Iran are longer than that of other regions. On the other hand, as Siberian high pressure system is reinforced and its tongue enter from northeastern Iran, Julian day of the first frost starts earlier than other regions, like western and northwestern Iran.
The maps obtained from this algorithm compared with the maps interpolated only using the data from limited stations (Mahmoudi, 2010) showed more details for spatial and
temporal distribution of statistical features of frost. So, various methods of interpolation should be studied for future works and, the best and most precise methods should be suggested.
5. REFERENCES
Alijani B, Mahmoudi P, Rigi Chahi A B, and Khosravi P, 2010. Investigation of the persistence of frost days in Iran using chain Markov model. Physical Geography Research Quarterly, 73: 1-20. (In Persian)
Avissar R, Mahrer Y, 1988 a. Mapping frost-sensitive areas with a three-dimensional local-scale numerical model: Part I: physical and numerical aspects. Journal of Applied Meteorology, 27: 400-413.
Avissar R, Mahrer Y, 1988 b. Mapping frost-sensitive areas with a three-dimensional local-scale numerical model: Part II: comparison with observation. Journal of Applied Meteorology, 27: 414-426.
Barati GH, 1996. Designing and forecasting the patterns of spring frost days in Iran. PhD Thesis of Climatology/unpublished, Tarbit Modarres University, 213 p. (In Persian)
Boer R, Campbell L C, Fletcher D J, 1993. Characteristics of frost in a major wheat – growing region of Australia. Australian journal of agricultural research, 44 (8): 1731-1743.
Chen, E, Allen L H, Bartholich J F, Bill R G, Sutherland R A, 1976. Satellite- sensed winter nocturnal temperature patterns of the Everglades agricultural area. Journal of Applied Meteorology, 18: 992-1002.
Dalezios N R, Lavrediadou E E, 1995. Features of frost – affected areas from digital METEOSAT IR images. Advances Space Research, 15(11): 123-126.
Figuerola P I, Mazzeo N A, 1997. An analytical model for the prediction of nocturnal and dawn surface temperature under calm, clear sky conditions. Agricultural and forest meteorology, 85: 229-237.
Francois C, Bosseno R, Vacher J J, Seguin B, 1999. Frost risk mapping derived from satellite and surface data over the Bolivian Altiplano. Agricultural and Forest Meteorology, 95: 113-1137.
Geiger R, 1966. The climate near the ground. Harvard University press, Cambridge, MA, 611 pp.
Hogg W H, 1966. Air frost in spring at long Ashton. Rep. Long Ashton Res. Stn., 1965, 290-298.
Hogg W H, 1968. The duration of spring frosts on successive nights. Agric. Mem. No. 208.
Jarvis C H, Stuart N, 2000 a. A comparison among strategies for interpolating maximum and minimum daily air temperatures, part I: The selection of “guiding” topographic and land cover variables. Journal of Applied Meteorology 40(6): 1060-1074.
Jurgens C, 1997. The modified normalized difference vegetation index (mNDVI) a new index to determine frost damage in agriculture based on Landsat TM data. International Journal of Remote Sensing, 8(17): 3583-3594.
Kerdiles H, Grodona M, Rodriguez R, Seguin B, 1996. Frost mapping using NOAA AVHHR data in the Pampean region, Argentina. Agricultural and forest meteorology, 79: 157-182.
Khosravi M, Habibi Noukhandan M, Esmeili R, 2009. Zonation of late chilblain risk impacts on gardens (case study: Mahvalat region). Geography and Development, 6(12): 117-144. (In Persian)
Lindkvist L, Gustavsson T, Bogren J, 2000. A frost assessment method for mountainous areas. Agricultural and forest meteorology, 102: 51-67.
Lomas J, Gat Z, 1971. Methods in agro-topoclimatic surveys low temperatures. Agron. Rep. No 1, Israel Meteorological Service, Bet-Dagan.
Laughlin G P, 1982. Minimum temperature and lapse rate in complex terrain: influencing factors and prediction. Archives for Meteorology, Geophysics, and Bioclimatology, Ser. B, 30: 141-152.
Laughlin G P, Kalma J D, 1987. Frost hazard assessment from local weather and terrain data. Agricultural and forest meteorology, 40: 1-16.
Laughlin G P, Kalma J D, 1990. Frost risk mapping for landscape planning: a methodology. Theoretical and Applied climatology, 42: 41-51.
Madelin M, Beltrando G, 2005. Spatial interpolation – based mapping of the spring frost hazard in the Champagne vineyards. Meteorological applications, 12: Pages 51-56.
Mahmoudi P, Khosravi M, Masoudian S A, Alijani B, 2012. Climatology atlas of frosts statistical properties of Iran. Geographical Research Quarterly (accepted) (In Persian)
Nixon P R, Hales T A, 1975. Observing cold-night temperatures of agriculture landscapes with an airplane-mounted radiation thermometer. Journal of Applied Meteorology, 14: 498-505.
Richards K, 2000. The topoclimate south project to map long-term growing degree-days in Southland, New Zealand. Presented at: SIRC 2000 – The 12th annual Colliquium of the Spatial Information Research Centre. University of Otago, New Zealand.
Richards K, Baumgarter M, 2003. Towards topoclimate maps of frost and frost risk for southland, New Zealand. Presented at: SIRC 2003 – The 15th annual Colliquium of the Spatial Information Research Centre. University of Otago, New Zealand.
Sutherland R A, Bartholic J F, 1974, Aircraft-mounted thermal scanner to determine grove temperatures during freeze conditions. Proceeding Florida State Horticultural Society, 87: 65-69.
Sutherland R A, Hannah H E, Cook A F, Martsolf J D, (1981): Remote sensing of thermal radiation from an aircraft- An analysis and evaluation of crop-freeze protection methods. Journal of Applied Meteorology, 20: 813-820.
Suzuki Y, Sato S, Kawajiri K, 1982. Frost damage and cold damage related to topographic climates in the warm region of Japan. Pt. 1, Distribution of Maximum air temperatures on the slopes of Ube-Ono tea garden, Yamaguchi. Journal of Agricultural Meteorology. 20: 813-820.
Ziaee A R, Kamgar-Haghighi A A, Sepaskhah A R, Ranjbar S, 2006. Development of Fars province probable minimum temperature atlas using meteorological data. Journal of Science and Technology of Agriculture and Natural Resources, 10(3): 13-27. (In Persian)