EFFECTIVE MANAGEMENT OF TRANS BOUNDARY LANDSCAPES
–
GEOSPATIAL
APPLICATIONS
Rajan Kotru a, R.S. Rawal b, P.K. Mathur c, Nakul Chettri a, Swapnil A. Chaudhari a, *, Kabir Uddin a, M.S.R. Murthy a, Swetha Singh c
a International Centre for Integrated Mountain Development (ICIMOD), GPO Box 3226, Kathmandu, Nepal b G. B. Pant Institute of Himalayan Environment and Development (GBPIHED), Almora-263 643, Uttarakhand, India
c Wildlife Institute of India (WII), Post Box #18, Chandrabani Dehradun – 248001 Uttarakhand, India Commission TC VIII
Abstract
KEY WORDS: Transboundary landscape, remote sensing GIS, ecological monitoring, landscape assessment, ecosystem services
The Convention on Biological Diversity advocates the use of landscape and ecosystem approaches for managing biodiversity, in recognition of the need for increased regional cooperation. In this context, ICIMOD and regional partners have evolved Transboundary Landscape concept to address the issues of conservation and sustainable use of natural resources and systems (e.g., biodiversity, rangelands, farming systems, forests, wetlands, and watersheds, etc.). This concept defines the landscapes by ecosystems rather than political/administrative boundaries. The Hindu Kush Himalayan (HKH) region is extremely heterogeneous, with complex inter linkages of biomes and habitats as well as strong upstream-downstream linkages related to the provisioning of ecosystem services. Seven such transboundary landscapes, identified across west to east extent of HKH, have been considered for programmatic cooperation, include: Wakhan, Karakoram-Pamir, Kailash, Everest, Kangchenjunga, Brahmaputra-Salween, and Cherrapunjee-Chittagong. The approach is people centered and considers the cultural conservation as an essential first step towards resource conservation efforts in the region. Considering the multi-scale requirements of study, the geospatial technology has been effectively adopted towards: (i) understanding temporal changes in landscapes, (ii) long term ecological and social monitoring, (ii) identifying potential bio corridors, (iii) assessing landscape level vulnerability due to climatic and non-climatic drivers, and (iv) developing local plans on extractions of high value economic species supporting livelihoods, agroforestry system and ecotourism, etc. We present here our recent experiences across different landscapes on assessment of three decadal changes, vegetation type mapping, assessment of socio-ecological drivers, corridor assessment, ecosystem services assessment, models for optimal natural resource use systems and long term socio-ecological monitoring.
1. INTRODUCTION: WHAT IS LANDSCAPE APPROACH?
The sectoral approach to conservation, which is still prevalent, has now been considered inadequate for safe-guarding the biodiversity and ensuring sustained flow of ecosystem services (Brandon et al., 1998; Joppa et al., 2008; McShane et al., 2011; Sayer and Campbell, 2004). On the contrary the landscape approach have begun to gain a wider recognition (Nelson et al., 2009; Phillips and Union, 2002; Pressey et al., 2007; Scherr and McNeely, 2008). Managing the land on the basis of functional and structural architecture of the patches, their distribution and links in an integrated way is considered to be a better option for conserving biodiversity over various approaches those work in isolation (Naveh, 1994; Sayer, 2009). Development investments in integrated landscape approach tends to converge conservation and development activities as holistic way to improve land use for better ecosystem services and conservation (Nelson et al., 2009). Landscape, a mosaic of heterogeneous component at a definitive scale, is characterised by two or several homogenous patches that are different from their surrounding and are connected by interlinking corridors (Forman, 1995). The interplay between the patches is govern by the functional traits of each of the patch and proximity and density of the connecting corridors. “Landscape approaches” seek to provide tools and concepts for allocating and managing land to achieve social, economic, and environmental objectives in areas where agriculture, mining, and other productive land uses compete with environmental and biodiversity goals (Sayer et al., 2013) which
* Corresponding author: Swapnil A. Chaudhari [email protected]
allows human induced changes and interactions to be an integral part of the landscape approach.
2. RATIONAL: WHY TRANSBOUNDARY
LANDSCAPES?
Recently IUCN identified areas of transboundary character in a separate category of protected areas, with its definition as,
“An area of land and/or sea that straddles one or more borders
between states, sub- national units such as provinces and regions, autonomous areas and/or areas beyond the limit of national sovereignty or jurisdiction, whose constituent parts are especially dedicated to the protection and maintenance of
biological diversity, and of natural and associated cultural resources, and managed co-operatively through legal or other
effective means.” (Sandwith and Union, 2001).
Furthermore, in recognition of the need for increased regional cooperation the Convention on Biological Diversity further advocates the use of landscape and ecosystem approaches for managing biodiversity in the transboundary region (CBD Secretariat, 2010). The discourse on transboundary disaster management has started to gain attention worldwide as a response to recent increase in natural disasters. There is an emerging trend in the policies and national development strategies in the HKH, based on the context of climate change and the nexus between food-water-energy in which bilateral and multilateral cooperation is significant to tackle conservation and development challenges of present and future. The transboundary landscape concept provides the handle to address the conservation and sustainable use of natural resources (biodiversity, rangelands, farming systems, forests, wetlands, and watersheds) in landscapes defined by ecosystems rather than administrative boundaries.
3. BUILDING TRANSBOUNDARY LANDSCAPES
PROGRAMMES IN THE HKH
The Hindu Kush Himalayan (HKH) region encompasses an area of nearly 4 million km² covering Bhutan, Nepal, and parts of six other countries: Afghanistan, Bangladesh, China, India, Myanmar, and Pakistan. International Centre for Integrated Mountain Development (ICIMOD) as an intergovernmental regional knowledge development and learning centre, has been proactive in conservation and development issues in the region for over 3 decades.
The HKH exhibits high biodiversity of ecosystems, from tropical evergreen forest to conifers, from dry grasslands to alpine meadows, often with a very sharp transition in vegetation sequences. The varied climatic regime, soils, topographic features, altitudinal gradient and directional orientation adds further to the spectrum of vegetation communities, including few charismatic species of mammals such as Snow leopard, Red panda, Tibetan antelope, Marco Polo sheep etc. The HKH is rich in endemism as many species remain isolated at high elevations. Nearly 39% area of the HKH are under protected area network (IUCN category I-VI) with a number of other forms of special conservation areas such as Ramsar sites, World Heritage, Important Bird Areas, etc. totalling to 488 PAs (Chettri et al., 2008a). The region forms one of the biggest clusters of river basins, with 210 million people living within the region, while nearly 1.3 billion people living downstream, amounting to nearly 1/5th population of the world.
A critical data deficit on variety of parameters in the HKH regions hinders the scientific understanding that creates obstacle in adopting an appropriate policy response. In 2005, ICIMOD in association with regional member countries (RMC) started to brainstorm the need for transboundary conservation in the HKH region (Sharma and Chettri, 2005). In 2008, a framework on ‘HKH Transboundary Landscapes and Trans-Himalayan
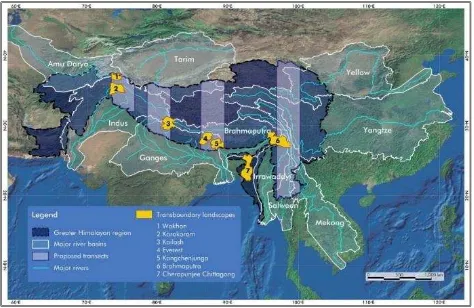
Transect’ was developed with an objective to promote transboundary collaboration among the RMC’s for effective conservation and development at the same time fill the information void prevailing in the region (Chettri et al., 2008b). During the process, seven representative landscapes across the gradients of precipitation, altitude and latitude and unique ecoregions were identified (Figure 1) with participatory involvement of RMCs. These vertical transacts represent a continuum of ecosystems across the national boundaries. Each landscape is chosen for its uniqueness in cultural and religious sacredness; high endemism, historical and existing cross-boundary trade of high value products, interdependent economies, degree of poverty and nature dependent livelihoods; and sensitivity to climate change, globalisation and upcoming geo-political developments. For example, Kailash Sacred Landscape (KSL) is a transboundary landscape area shared between India, Nepal and Tibetan Autonomous Region of China. Mt Kailash, the sacred mountain for five religions, is at the heart of KSL. Hundreds of religious and sacred sites spread in the region are in living synergy with Kailash, and offer an explanation to the transboundary links existing among the prevailing societies. This dynamic interaction between culture, religion and nature offers by far the most outstanding opportunity to understand, learn and draw transboundary landscape conservation and management importance considering culture at the centre of planning. The transboundary Brahmaputra Salween Landscape (BSL) shared by China, India and Myanmar holds uniqueness because of the topographic and climatic variability, along with the blend of elements of three "global biodiversity Hotspots”, three biogeographical provinces, seven globally significant ecoregions (ICIMOD, 2012). This makes the landscape exceptionally rich in its biodiversity content. It hosts large number of globally significant, rare, endangered, and endemic species. The diverse ethnic communities, with their socio-cultural richness add colour and beauty to the BSL. The scientific study of the ecosystem functions and processes and human dependence should lead to enhance our understanding for ecosystem management, sustainable livelihood development, and possibly help to better orient equitable access and benefits sharing of bioresources. Furthermore, as functional institutional framework for transboundary landscape management does not yet exist in the HKH region, ICIMOD and its regional member countries have made significant progress since 2008 in operationalising the HKH Transboundary Landscapes and Trans-Himalayan North-South Transect Framework.
Figure 1 Figure 1 ICIMOD Transboundary Landscape Initiatives in Hindu- Kush Himalayan Region (HKH)
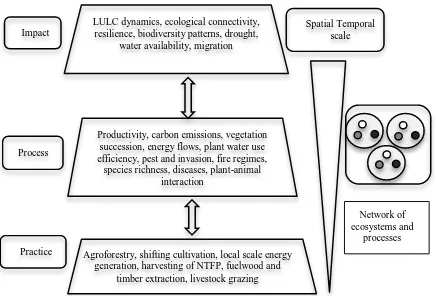
Figure 2 Bio-physical and social interactions regulating landscape functions across spatial and temporal scales.
Landscape character is manifested outcome of ecological processes happening as a response to climatic, hydrological and development regimes. The developmental regime in the mountain regions are more local scale which can be explained by adopted livelihood practices such as agroforestry, shifting cultivation, local scale energy generation, harvesting of NTFP, fuelwood and timber extraction, livestock grazing etc. These practices has bearing on the ecosystems process e,g. productivity, carbon emissions, vegetation succession, energy flows, plant water use efficiency, pest and invasion, fire regimes, species richness, diseases, plant-animal interaction. Similarly presence and expansion of physical infrastructure as roads, settlements, and dams alters the ecosystem connectivity, fragmentation, animal moments, etc. This dynamics between practices and process on a short term temporal and finer spatial scale changes the ecosystem functions, which on the long temporal and broad spatial scales impacts the landuse land cover, availability of ecosystem goods services, ecosystem resilience and contributes to shifts in the macro-economies. For the landscape management, it is thus important to look at conservation of resources at multiple scales over the period of time. Managing trade-offs between policy and management choices require repetitive, indicative, and up to date data. Ground based observations although most reliable possess limitations because of time and cost, and scalability. Geospatial technology involving remote sensing and geographic information system (RS and GIS) provides a promising way forward to collect, process and decimate the knowledge to make informed choices (Nagendra, 2001).
3.2. Customising Community And Landscape Needs With Geospatial Options
A combination of satellite remote sensing, global positioning system (GPS), and integrative tools (such as GIS and information systems) is by far the best complimentary system to ground-based studies that overcomes the limitations of cost, time and consistency. Application of geospatial technology from local, regional to the global scale is its biggest advantage that overcomes the shortcomings of traditional site specific approaches. The scalability has been achieved owning to constant advances in the satellite products that offers ecological assessments, monitoring and prediction from a finer scale to a landscape and regional scale (Singh et al., 2010). Several global scale databases such as IUCN red lists, IBA’s, WDPA are being maintained and analysed in spatial domain to understand the trends in global biodiversity decline (Butchart et al., 2010).
These databases are backbone for setting and monitoring global biodiversity targets (CBD Secretariat, 2010). At the same time national level database on biodiversity, ecosystem stocks and natural capitals are in progress at diverse levels (Roy et al., 2012; TEEB, 2013). The indigenous knowledge on land management, agriculture practices, medicinal plants and values of nature etc., is increasingly being mapped using a participatory GIS approaches (Tripathi and Bhattarya, 2004). For biodiversity assessments at different scales, Murthy et al (2003) have illustrated extensive applications of GIS RS at scales where ground based measurements has shortcomings (Table 1). On one hand, high resolution data on finer scale can provide an insight specifically on ‘forest stands’, ‘unique’ (geomorphic in nature) and ‘spatial’ (biological) habitats those are widely distributed across natural ecosystems and also the structure and composition of connecting corridors between vital patches. While on the other hand geospatial information at higher scales can provide insight on the characteristics of different sub-watersheds and watersheds constituting the landscape. Human induced interventions at local to landscape scales could be assessed using multispectral satellite imageries that are sensitive to changes in vegetation extent and structure. The meteorological information is coupled in GIS system to provide timely information on weather pattern that influence the agriculture and ecosystem productivity.
Parameters RS
Number of patches per
unit are * * succession, energy flows, plant water use efficiency, pest and invasion, fire regimes, species richness, diseases, plant-animal
interaction
Agroforestry, shifting cultivation, local scale energy generation, harvesting of NTFP, fuelwood and
E Habitat level * * *
Table 1 Component of Biodiversity Assessment and measurement tools (Murthy et al., 2003)
4. IDENTIFICATION AND APPLICATION OF GEOSPATIAL TECHNOLOGY
Considering the advantage that GIS and RS offers, the programme is developing geospatial databases and support system to inform the decision making for transboundary management. The spatial databases developed so far includes landuse data, decadal landuse change, potential bio-corridors, stocks of prime provisional ecosystem services, natural and cultural heritage sites and trails, distribution of high value medicinal resources etc. The preliminary investigation with the overlay of these data layers have started to explain the interdependence of culture, religion, and nature within the transboundary context. This improved understanding is offering a better judgment to make informed choices and policy advocacy for regional member countries. Few of such example of application of geospatial technology is illustrated in subsequent sections.
4.1. Understanding Temporal Changes In Landscape
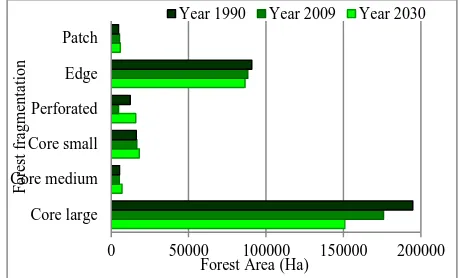
Land use and land cover change (LUCC) is one of the most important drivers of environmental change. Changes in landscape particularly loss of forest area and forest fragmentation can result in loss of biodiversity and have a negative impact on ecosystem processes and the flow of ecosystem services, which can affect livelihoods. Little is known about the extent of such changes in the remote parts of the identified transboundary landscapes. The programme has mapped multi-temporal land cover of KSL, Kangchenjunga Landscape (KL) and BSL using widely recognized Geographic Object-Based Image Analysis (GEOBIA) method (Bajracharya et al., 2010; Chettri et al., 2013; Uddin et al., 2014) that uses a multi-resolution segmentation technique. To predict the land change with past decadal trends, IDRISI’s land change modeller has been applied. The preliminary results indicates loss of forest area between 1990 and 2009 and a marginal increase in the area of crop land under KSL- Nepal while the area under ice and snow have declined which increases the exposed areas such as rocks and barren soil. This contributes to negative feedback loop and may accelerate further melting of glaciers.
The fragmentation analysis indicated a 10% decrease in large-sized areas of core forest and a small increase in forest patches (Figure 3). This study offered strategic recommendations for better forest conservation and management in the KSL based on predicted trends. The efforts are in progress for other landscape to understand the land use change to run the meta-analysis at the regional scale.
Figure 3 Forest fragmentation and change in KSL-Nepal
4.2. Vegetation Type Mapping
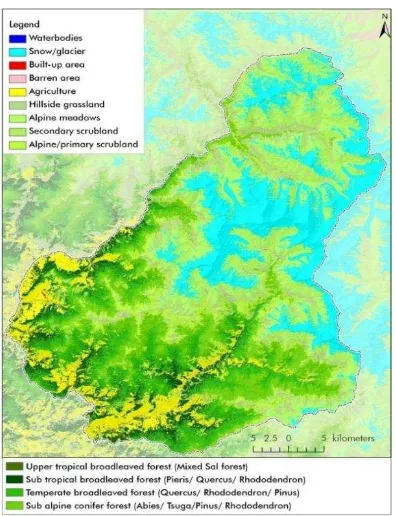
Kailash sacred landscape harbours diverse climatic, physiognomic and locale specific vegetation types ranging from forests, woodlands, hillside grasslands, primary and secondary scrub, moist and dry alpine meadows and steppe apart from agriculture, snow and sparsely vegetated pioneer habitats. The spatial analysis and distribution mapping of these vegetation types in conjunction with associated climate, topographic and field information will be of immense value for characterizing ecosystems, natural habitats, distribution of key species and further conservation and development planning. Such maps will also allow basic stratification for carbon assessment, exploring for abundance analysis of economic and ecological important species and understanding the landscape matrix in relation to habitat contiguity and change. In view of this the database on vegetation distribution is largely realized as an important need across all the components of Kailash Sacred Landscape Conservation and Development (KSLCDI) program.
The vastness, inaccessibility and short optimal seasons for field visits curtails detailed field surveys to understand the distribution patterns. In this context the advantage of multispectral and multi temporal remote sensing data in conjunction with limited field surveys representing vegetation distribution would be a useful tool to analyse the entire landscape and develop detailed vegetation distribution patterns. The comprehensive field based vegetation distribution studies (Champion and Seth, 1968; Shrestha et al., 2002) provides a sound scientific basis to develop a suitable classification scheme suiting ecological context of the landscape. During the major vegetation mapping around 50 sample plot was used as a training sets. Using the training 2d features plot generated and rules was applied for vegetation mapping. Details vegetation map of Api-Nampa can be seen from the figure 4. The result shows that forest constitutes dominant land cover covering 63375 ha with a contribution of 33.41% of the total area of Api-Nampa.
0 50000 100000 150000 200000
Figure 4: Vegetation type map of Api Nampa Conservation Area, Dharchula, Nepal
Likewise in Indian part of KSL, the diverse types of vegetation (forests and alpine meadows and grasslands), which constitute nearly 46% of landscape, have been broadly delineated using RS data.
4.3. Assessing Landscape Scale Vulnerability Due To Climatic And Non-Climatic Drivers
Vulnerability is a function of system’s exposure (time and intensity of driver), sensitivity (to individual or cumulative drivers) and adaptive capacity (explained by species richness, abundance, size and density of similar systems in proximity) (Dawson et al., 2011). The species and habitat level foot print of community practices influence the process and impact at landscape scale. Therefore the vulnerability can be measured by assessing individual characteristics of species, ecosystem and landscape. The species level information required ground inventory, the up scaling of this information at ecosystem level can be done by combining ground based observations with mathematical and spatial models. While the landscape level vulnerability could only be assessed at a spatial and temporal resolution using GIS and remotely sensed data. This advancement in RS technology is a turnkey paradigm shift that allows for a regular and multiple scale assessments at relatively cheap cost. The species distribution inventory (Butchart et al., 2012) provides parameters on species, the free and daily global scale remotely sensed data gives information on ecosystem functions such as productivity NPP, forest fire (MODIS) while the bioclimatic parameters can be derived from global circulation models. Capacity of GIS system to integrate and process these datasets offers an opportunity to assess the vulnerability. Each of the landscape is unique in its sensitivity as certain ecosystems are more vulnerable to the negative impacts of climate change than others. In fact, some of the areas richest in biodiversity are those that are also the most vulnerable (Opdam and Wascher, 2004). The forests are vulnerable to changes resulting from forest land conversion and degradation caused by fire, unsustainable timber harvesting fuel wood extraction, and insect and pest
damage coupled with climate change impacts (Hunzai et al., 2011). The relative proneness of a forest to change is a function of infrastructure (GIS layers of settlement, roads, highways, and trade routes), terrain accessibility (elevation data layers), historical fire patterns (Figure 5), hot spots of forest cover loss, and climate variability. Based on this geospatial models are run to develop intensity maps of forest vulnerability from high, medium to less vulnerable. This contributes to develop a baseline for conservation prioritization and a monitoring framework for ecosystem.
Figure 5 Annual average MODIS active forest fire in BSL
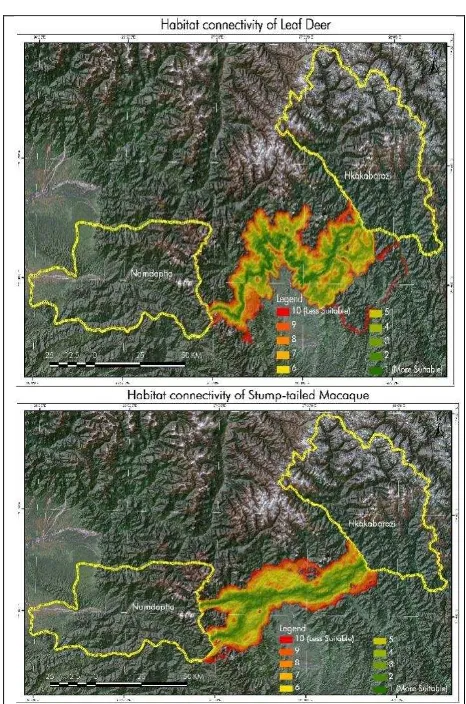
4.4. Identifying Potential Bio Corridors
biological corridor between Namdapha National Park and Hkakabo Razi National Park in BSL.
Figure 6: Proposed biological corridors corridor between Namdapha National Park and Hkakabo Razi National Park in
BSL.
4.5. Assessment Of Ecosystem Services
Ecosystem services (ES) are the benefits people receive from ecosystems (MEA, 2005). Nearly 1.3 billion people receive benefits from this region, making it one of the most important service provider. Apart from provisioning services such as water, medicinal plants, timber etc. the region contributes heavily in sequestering carbon and ameliorating the climate of the region. Therefore assessing these ecosystems services and their trade-offs is crucial for the programme. Quantification and mapping of ecosystem services provides key information identifying: “(a) areas that provide a high level of service requiring protection or management to maintain service provision (b) areas that provide specific ecosystem functions or services and (c) changes in ecosystem service provision over time”. Spatial representation of the relative provision of ecosystem services across a landscape is critical for incorporating ecosystem services into processes for integrated planning (Luck et al., 2009). Recently a study was conducted for two protected areas (Phobjikha Valley and Koshi Tappu wildlife reserve) with the help of geospatial tools and on-site participatory questioner with local communities (ICIMOD and MoFSC, 2014; ICIMOD and RSPN, 2014). Figure 7 shows that analysed ecosystem services of Phobjikha Valley.
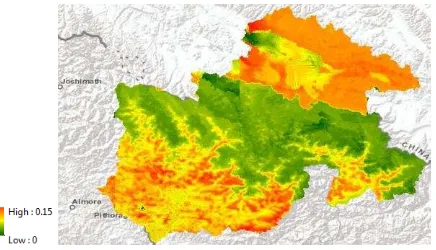
To assess ecosystem services at regional level, ICIMOD in association with UNEP-WCMC have investigated a spatial models on quantifying ecosystem services. Costing Nature (Mulligan, 2015) is a process based model for assessing relative ecosystem services of the region using more than 150 global spatial and non-spatial datasets. The model will be customised further by replacing global datasets with regional databases developed by ICIMOD to enhance the regional predictability and accuracy. The model provides an output as a global index value of the region for provision of ecosystem service in two forms potential (provided but not consumed) and realised (consumed by mapped beneficiaries). The figure 8 illustrates the bundle ecosystem services arriving from carbon sequestration and water availability for the baseline year 1990. The model allows to replace the inbuilt data with the user provided data. The GCM data on climate for future scenario, projected landuse data based on regional policies, could be integrated in the model to assess changes in ecosystem services in relation to baseline and impacts of a policy adoption.
Figure 8 Relative total realised bundled services index for KSLCDI
4.6. Optimizing Natural Resource Use Systems
The ongoing efforts on participatory natural resource management (PNRM) planning involve prioritisation of development and conservation initiatives at local level. This is being carried out in pilot sites Khar, Api Nampa Conservation Area in far western part of Nepal in Kailash landscape. The information obtained through the participatory methods is coupled with remote sensing and geospatial databases that helps to bring the ground information in larger perspective. While Participatory GIS is not an essential component of PNRM, if used adequately and considering sensitivity for issues of ownership, legitimacy and local knowledge, it can contribute to the empowerment of communities in solving spatial planning problems (Dunn, 2007; McCall, 2003). This offers chances to develop an alternative scenario for every landuse plan adopted and its associated trade-offs. The visualisation of futuristic scenarios help to gauge the effect of land management practices and how multiple factor interact in response to management treatment, and how their landuse choices would involve trade-offs with ecosystem services.
The dataset develop by the partner institution is further expanded at the landscape level to see the impact of ongoing development and conservation initiatives, e.g. forest protection, afforestation, forest fire management, plantation of medicinal plants, harvesting regime for high value NTFP, grazing management, habitat range of endemic species etc. This information provides handles for prioritising conservation and development option vis-à-vis direction for future investment of scarce resources of development funding and manpower.
The Kailash landscape is also a centre for high value NTFP trade such as Cordyceps sinensis (Yarsagumba), Girardinia diversifolia (Himalayan Giant Nettle), Sapindus detergents ( Soapnut/Ritha), Diploknema butyracea (Chyura) where huge number of communities are involved in extraction, processing and marketing of these products to domestic as well as international markets. To add to the ongoing trade, selective NTFP’s are being prioritised for value chain development. Use of GIS technology for supply chain management is widely known. However, such attempts are rarely seen in value chains for the NTFP’, perhaps owing to its high transaction costs. With advances of technology at cheap prices, the GIS system is being executed to inform the local people with market rates for the product on updated basis. Furthermore the trade routes are being mapped for each value chain product to better visualise physical restraint in the product movement from farm to the market so that the development efforts are routed to gain maximum returns on investments. Geospatial technology is also being applied to understand the threats of climate change to the NTFPs (Shrestha and Bawa, 2014) that could potentially cause mammoth loss to
locals. This is one application that provides the advantage in making a better decisions for the local businesses.
Similarly HKH region is a global hotspot of tourism with millions of domestic and international tourist making visit to the region. Owing to its aesthetic and cultural significance, these areas are centre to a travellers wish. To exploit these opportunity for offering an alternative livelihood, geospatial technology is being used to develop tourism product e.g. maps, atlas, mobile applications to improve the experience of a tourist at the same time assess the threats to the tourist sites due to infrastructure and climate change. The concept of geo-fencing is being piloted under the Kailash transboundary conservation and development initiative.
4.7. Long Term Ecological And Social Monitoring
Monitoring is a process of repeated gathering information about variables to assess the state of the system and draw inferences about changes over time (Yoccoz et al., 2001). The complexity and compounding characteristics neither can be understood in isolation nor on short temporal scale. Therefore long term and diverse sets of mutually independent parameters need to be monitored. Understanding long-term ecological interactions at multiple spatial and temporal scales is difficult or, in some cases, impossible without a foundation of long-term socioecological observations. But, they are important to define the range of natural variability of socio-ecological systems and provide a baseline from which one can determine if a system has changed significantly; to detect cause-effect relationship relationships among slowly changing components of socio-ecological systems. Comparisons of long-term observations or experiments across multiple sites can lead to a more generalized understanding than that gained from individual sites alone. It could provide reliable data for policy influence as well as timely decision making in management and development interventions.
Under the transboundary landscape programme, the Long Term Ecological and Social Monitoring Program framework has been developed (Chettri et al., 2014, 2008b). In this context, Geospatial technology has a tremendous application owing to its scalability. Remotely sensed data facilitates temporal and spatial monitoring of species distribution, plant phenology, invasive species spread, animal moment, ecosystem vulnerability, productivity, natural capital, natural hazards, landuse change, fragmentation, snow, ice and glaciers mass balance, water yield, migration trends and demographic distribution of human populations (Chettri et al., 2014).
Under the transboundary landscape initiative several metrological stations and GLORIA sites have been established for long term monitoring of climatic and biodiversity characters of the area. Such points of information are curial to upscale the information to landscape and later collectively to regional scale. This will add immensely in data void mentioned by Assessment report 4 of IPCC (Solomon, 2007).
5. CONCLUSIONS AND RECOMMENDATIONS
transboundary management. Further combination of information technology augments the communication of authentic and reliable knowledge that supports the decision making at local, regional to global level. It also provides a timeline data that can be used to study impacts and corrective course of actions in future. The mode of data visualization and communication can be utilised to otherwise complex information to the decision makers as well as public in general.
6. ACKNOWLEDGEMENT
We would like to thank Arnout van Soesbergen, UNEP-WCMC, Cambridge, UK for his valuable assistance in running costing nature model for the Kailash area.
7. REFERENCES
Bajracharya, B., Uddin, K., Chettri, N., Shrestha, B., Siddiqui, S.A., 2010. Understanding land cover change using a
harmonized classification system in the Himalaya: A case study from Sagarmatha National Park, Nepal. Mt. Res. Dev. 30, 143– 156.
Beier, P., Majka, D., Jenness, J., 2007. Conceptual steps for designing wildlife corridors. Corridor Design Ariz. USA.
Brandon, K., Redford, K.H., Sanderson, S., 1998. Parks in peril: people, politics, and protected areas. Island Press.
Butchart, S.H., Scharlemann, J.P., Evans, M.I., Quader, S., Arico, S., Arinaitwe, J., Balman, M., Bennun, L.A., Bertzky, B., Besancon, C., 2012. Protecting important sites for
biodiversity contributes to meeting global conservation targets. PLoS One 7, e32529.
Butchart, S.H.M., Walpole, M., Collen, B., van Strien, A., Scharlemann, J.P.W., Almond, R.E.A., Baillie, J.E.M., Bomhard, B., Brown, C., Bruno, J., others, 2010. Global biodiversity: indicators of recent declines. Science 328, 1164– 1168.
CBD Secretariat, 2010. Global Biodiversity Outlook 3, in: Secretariat of the Convention on Biological Diversity.
Champion, S.H., Seth, S.K., 1968. A revised survey of the forest types of India.
Chettri, N., Bubb, P., Kotru, R., Rawat, G.S., Murthy, M.S.R., Wallrapp, C., Pauli, H., SHRESTHA, A.B., Mool, P.K., Chaudhary, D., Chaudhary, R.P., Mathur, P.K., Peili, S., Ning, W., Sharma, E., 2014. Long term environmental and socio-ecological monitoring in transboundary landscapes (Draft). International Centre for Integrated Mountain Development (ICIMOD), Kathmandu, Nepal.
Chettri, N., Shakya, B., Sharma, E., 2008a. Biodiversity conservation in the Kangchenjunga landscape. International Centre for Integrated Mountain Development.
Chettri, N., Sharma, E., Thapa, R., 2008b. Long term monitoring using transect and landscape approaches within Hindu Kush Himalayas, in: Proceedings on ‘International Mountain Biodiversity Conference'. pp. 16–18.
Chettri, N., Uddin, K., Chaudhary, S., Sharma, E., 2013. Linking Spatio-Temporal Land Cover Change to Biodiversity
Conservation in the Koshi Tappu Wildlife Reserve, Nepal. Diversity 5, 335–351.
Dawson, T.P., Jackson, S.T., House, J.I., Prentice, I.C., Mace, G.M., 2011. Beyond predictions: biodiversity conservation in a changing climate. Science 332, 53–58.
Dunn, C.E., 2007. Participatory GIS —a people’s GIS? Prog. Hum. Geogr. 31, 616–637. doi:10.1177/0309132507081493 Forman, R.T., 1995. Land mosaics: the ecology of landscapes and regions. Cambridge university press.
Hunzai, K., Gerlitz, J.Y., Hoermann, B., others, 2011. Understanding mountain poverty in the Hindu Kush-Himalayas: regional report for Afghanistan, Bangladesh, Bhutan, China, India, Myanmar, Nepal, and Pakistan. International Centre for Integrated Mountain Development (ICIMOD).
ICIMOD, 2012. Towards developing the Brahmaputra -Salween Landscape – Report on the experts regional consultation for transboundary biodiversity management and climate change adaptation. (ICIMOD Working Paper No. 2012/4),
Transboundary Landscape. Kathmandu, Nepal.
ICIMOD, MoFSC, 2014. An integrated assessment of the effects of natural and human disturbances on a wetland ecosystem: A retrospective from the Koshi Tappu Wildlife Reserve, Nepal. International Centre for Integrated Mountain Development (ICIMOD), Kathmandu, Nepal.
ICIMOD, RSPN, 2014. An integrated assessment of the effects of natural and human disturbances on a wetland ecosystem: A retrospective from Phobjikha Conservation Area, Bhutan. Kathmandu. International Centre for Integrated Mountain Development (ICIMOD), Kathmandu, Nepal.
Joppa, L.N., Loarie, S.R., Pimm, S.L., 2008. On the protection of “protected areas”. Proc. Natl. Acad. Sci. 105, 6673–6678.
Luck, G.W., Harrington, R., Harrison, P.A., Kremen, C., Berry, P.M., Bugter, R., Dawson, T.P., De Bello, F., Díaz, S., Feld, C.K., others, 2009. Quantifying the contribution of organisms to the provision of ecosystem services. Bioscience 59, 223–235. McCall, M.K., 2003. Seeking good governance in
participatory-GIS: a review of processes and governance dimensions in applying GIS to participatory spatial planning. Habitat Int., Governance and the Use of GIS in Developing Countries 27, 549–573. doi:10.1016/S0197-3975(03)00005-5 McShane, T.O., Hirsch, P.D., Trung, T.C., Songorwa, A.N., Kinzig, A., Monteferri, B., Mutekanga, D., Thang, H.V., Dammert, J.L., Pulgar-Vidal, M., Welch-Devine, M., Brosius, J.P., Coppolillo, P., O’Connor, S., 2011. Hard choices: Making trade-offs between biodiversity conservation and human well-being. Biol. Conserv. 144. doi:10.1016/j.biocon.2010.04.038
MEA, 2005. Ecosystems and human well-being. Millennium Ecosystem Assessment. Island Press Washington, DC.
Murthy, M., Giriraj, A., Dutt, C., 2003. Geoinformatics for biodiversity assessment. BIOL. LETT 40(2):75-100.
Nagendra, H., 2001. Using remote sensing to assess biodiversity. Int. J. Remote Sens. 22, 2377–2400. doi:10.1080/01431160117096
Naveh, Z., 1994. From Biodiversity to Ecodiversity: A Landscape-Ecology Approach to Conservation and Restoration. Restor. Ecol. 2, 180–189.
doi:10.1111/j.1526-100X.1994.tb00065.x
Nelson, E., Mendoza, G., Regetz, J., Polasky, S., Tallis, H., Cameron, Dr., Chan, K.M., Daily, G.C., Goldstein, J., Kareiva, P.M., Lonsdorf, E., Naidoo, R., Ricketts, T.H., Shaw, Mr., 2009. Modeling multiple ecosystem services, biodiversity conservation, commodity production, and tradeoffs at landscape scales. Front. Ecol. Environ. 7, 4–11. doi:10.1890/080023 Opdam, P., Wascher, D., 2004. Climate change meets habitat fragmentation: linking landscape and biogeographical scale levels in research and conservation. Biol. Conserv. 117, 285– 297.
Phillips, A., Union, W.C., 2002. Management guidelines for IUCN category V protected areas: Protected
landscapes/seascapes. IUCN–the World Conservation Union. Pressey, R.L., Cabeza, M., Watts, M.E., Cowling, R.M., Wilson, K.A., 2007. Conservation planning in a changing world. Trends Ecol. Evol. 22, 583–592.
Rawal, R.S., Rastogi, A., Palni, L.M.S., 2012. Journey through a sacred land. GBPIHED, Kosi-Katarmal, Almora, India.
Roy, P.S., Kushwaha, S.P.S., Musrthy, M.S.R., Roy, A., Kushwaha, D., Reddy, C.S., Behra, M.D., Mathur, V.B., Padalia, H., Saran, S., others, 2012. Biodiversity characterisation at landscape level: national assessment. Indian institute of remote sensing, Dehradun, India. ISBN 81-901418-8-0.
Sandwith, T., Union, W.C., 2001. Transboundary protected areas for peace and co-operation: Based on the proceedings of workshops held in Bormio (1998) and Gland (2000). IUCN–the World Conservation Union.
Sayer, J., 2009. Reconciling conservation and development: are landscapes the answer? Biotropica 41, 649–652.
Sayer, J., Campbell, B.M., 2004. The science of sustainable development: local livelihoods and the global environment. Cambridge University Press.
Sayer, J., Sunderland, T., Ghazoul, J., Pfund, J.-L., Sheil, D., Meijaard, E., Venter, M., Boedhihartono, A.K., Day, M., Garcia, C., others, 2013. Ten principles for a landscape approach to reconciling agriculture, conservation, and other competing land uses. Proc. Natl. Acad. Sci. 110, 8349–8356. Scherr, S.J., McNeely, J.A., 2008. Biodiversity conservation and agricultural sustainability: towards a new paradigm of “ecoagriculture”landscapes. Philos. Trans. R. Soc. B Biol. Sci. 363, 477–494.
Sharma, E., Chettri, N., 2005. ICIMOD’s Transboundary Biodiversity Management Initiative in the Hindu Kush– Himalayas. Mt. Res. Dev. 25, 278–281. doi:10.1659/0276-4741(2005)025[0278:ITBMII]2.0.CO;2
Shrestha, T.B., Lillesø, J.P.B., Dhakal, L.P., Shrestha, R., 2002. Forest and vegetation types of Nepal: MFSC, HMG/Nepal. Nat. Resour. Manag. Sect. Assist. Programme NARMSAP Tree Improv. Silvic. Compon. TISC Kathmandu.
Shrestha, U.B., Bawa, K.S., 2014. Impact of climate change on potential distribution of Chinese caterpillar fungus
(Ophiocordyceps sinensis) in Nepal Himalaya. PloS One 9, e106405.
Singh, J.S., Roy, P.S., Murthy, M.S.R., Jha, C.S., 2010. Application of landscape ecology and remote sensing for assessment, monitoring and conservation of biodiversity. J. Indian Soc. Remote Sens. 38, 365–385. doi:10.1007/s12524-010-0033-7
Solomon, S., 2007. Climate change 2007-the physical science basis: Working group I contribution to the fourth assessment report of the IPCC. Cambridge University Press.
TEEB, 2013. In-Country studies. Econ. Ecosyst. Biodivers.
Tripathi, N., Bhattarya, S., 2004. Integrating indigenous knowledge and GIS for participatory natural resource management: state of the practice. Electron. J. Inf. Syst. Dev. Ctries. 17.
Uddin, K., Shrestha, H.L., Murthy, M.S.R., Bajracharya, B., Shrestha, B., Gilani, H., Pradhan, S., Dangol, B., 2014. Development of 2010 national land cover database for the Nepal. J. Environ. Manage.