INVESTIGATING THE EFFECT OF FOCUS STACKING ON SFM-MVS ALGORITHMS
G. Kontogianni1*
,
R. Chliverou1, A. Koutsoudis2, G. Pavlidis2, A. Georgopoulos11 Laboratory of Photogrammetry, School of Rural and Surveying Engineering, National Technical University of Athens –
15780 Zografou Athens, Greece
[email protected] [email protected] [email protected]
2 ‘Athena Research Centre, University Campus at Kimmeria, PO BOX 159, GR-67100, Xanthi, Greece
[email protected] - [email protected]
Commission II
KEY WORDS: Focus Stacking, SfM-MVS, 3D reconstruction
ABSTRACT:
The Depth of Field (DoF) is a vital factor in photogrammetric applications. Its effect is in most cases pretty obvious especially when capturing small artefacts. It is very important to observe its behaviour as it affects the ability to capture all the details of an object. Focus stacking is a technique in computational photography, in which a set of images focused on different planes with limited DoF are combined in order to considerably extend the DoF. Today, there is a number of focus stacking methods that can be applied in order to produce a full-focus image. In this paper, we investigate the application and effects of focus stacking on SfM-MVS 3D reconstruction. Specifically, our experiment involves the 3D reconstruction of a selected artefact using both traditional all-focus photography and focus stacking. The artefact has already been digitised with a high accuracy and resolution structured light 3D scanner, and that 3D model served as the reference model, with which SfM models were compared. We discuss on these fist results and present some preliminary assessment on the application of focus stacking for the SfM-MVS-based 3D reconstruction.
* Corresponding author
1. INTRODUCTION
The depth of field (DoF) defines a range of distances, in which a scene appears to be acceptably sharp. It is affected by a number of factors but it is mainly attributed to a camera’s focal length, the lens aperture and its focusing distance. The sharpness in images due to the DoF does not change abruptly, but occurs as a gradual transition. This means that everything that is in front or behind the focus plane appears to lose sharpness. The effect is not always detectable by the human eye or indeed by the resolution of the camera, especially when the pixel pitch is large. The circle of Confusion is a term, which defines the maximum diameter of a circle formed by a point imaged blurred, beyond which the point is perceived as non-sharp. When the circle of confusion becomes visible to the human eye, this region is outside of the DoF and it is depicted blurry (Cambridge in Colour, 2017).
The effect of a shallow DoF in photogrammetry and especially in close range applications is in most cases prominent. Specifically in the case of capturing small artefacts, where it is more difficult to capture all the details of the objects, the alignment process with shallow DoF images is expected to be based on a limited amount of salient points from regions in focus. This could affect the point matching procedure, the number of conjugate points determined and the resolution of the produced 3D model. In addition, in a worst-case scenario, it may lead to a very sparse set of points with areas on the surface of an object with no point correspondences.
The basic goal of this paper is to investigate how focus stacking can affect the creation of a 3D model with the use of SfM-MVS algorithm. The rest of the paper is organized as follows. In
Section 2 we give an overview of the focus stacking method, while in section 3 we describe the experimental approach that has been followed. Section 4 describes how these data were integrated and in Section 5 we present some preliminary results and comparisons between the produced models. Finally, in Section 6 we provide some concluding remarks.
2. FOCUS STACKING
Focus stacking is a technique in computational photography, in which a set of images of typically shallow DoF and in different focusing distances is being used in order to extend the DoF in the captured scene. This technique is most useful in close-up and macro photography as even the smallest aperture is often insufficient to capture the whole range of distances required (Cambridge in Colour, 2017). Changing the focusing distance can be achieved with several methods. In cases, in which the camera is fixed on a tripod, the focusing distance can be changed manually or automatically by software that usually accompanies a camera, like Helicon Remote, ControlmyNikon, Canon EOS Utility etc. On the other hand, when a fixed-focus lens is being used, the camera is forced to move on a micrometre rail (Clini et al. 2016). Furthermore, the focusing distance can be adjusted with the use of the tilt movement of a tilt-shift lens.
Many techniques and algorithms are offered as software solutions that allow the creation of focus stacked images. Some of the most popular techniques are the pyramid approach, the depth map approach and the weight pixel approach. In the pyramid approach, for each image a Laplacian pyramid is created (Wang & Chang, 2011) and then all pyramids are fused to produce an extended DOF image (Automated Focus
Stacking, 2017). The depth map approach detects the regions in a sequence of images on which the sharpest pixels exists. With this method it is important for the images to be captured in a sequential order, from first to last or vice versa. The weight pixel approach computes the weight of each pixel based on its contrast value. Then all pixels from all the source images are averaged according to their weights (HeliconSoft, 2017). The focus stacking technique has been used in 3D digitisation in order to create 3D models of small objects, such as archaeological artefacts, insects, etc. Clini et al. (2016) used focus stacking for the development of the 3D model of a small statue and compared the result with a 3D model created with the Konica Minolta Range 7 laser triangulation scanner. Brecko et al. (2014) used focus stacking in macro photography, in order to evaluate different focus stacking software and to create 3D models of insects. In another work, Gallo et al (2012; 2014) presented a new methodology for the 3D reconstruction of small artefacts. The reconstruction is based on a multi-view stereo (MVS) algorithm applied on a sequence of macro images by using open source SfM-MVS software. In this case, the results were compared with 3D models created with the use of a NextEngine laser triangulation scanner. In another application (Plisson & Zotkina 2015), focus stacking and photogrammetry were used to 3D record the millimetric and submillimetric details of prehistoric petroglyphs and paintings.
3. EXPERIMENTAL SETUP
In this section, we discuss on our experimental setup. Specifically, we briefly describe the object used in our experiments, including the ground truth 3D model used for the objective comparison of the SfM-MVS-based 3D models, along with the focus stacking approach and generation of the focus-stacked (FS) and all-focus (AF) 3D models.
3.1 The Case Study Object
The object being used in our experiment is a replica of a Native American bird effigy bowl that was discovered in the upper Nodena site in Arkansas, USA and it is exhibited in the Hampson Archaeological Museum (Hampson Archaeological Museum, 2016). The original artefact is considered a strong representative of a distinct shape category found in the museum. This replica was created by a sculptor within the framework of the PRESIOUS EU project (PRESIOUS project, 2017), based on both subjective and objective criteria such as visual and metric information that was extracted by studying the original artefact’s 3D replica in MeshLab software.
3.2 The Ground Truth 3D Model
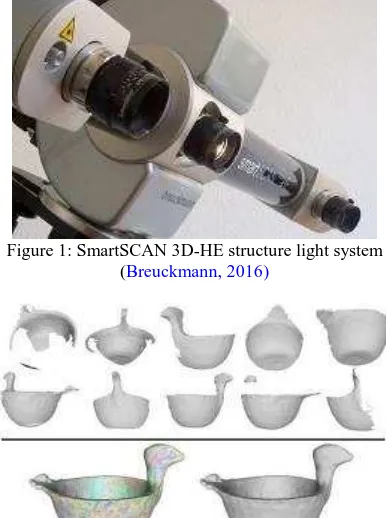
We have based our evaluation tests on a 3D model of our case study model that has been captured by a structured-light scanner. More specifically, the replica was digitised in 3D with a Smartscan3D-HE produced by Breuckmann (Breuckmann, 2016) (Figure 1).
For the efficient digitisation of the replica, a computer-controlled turntable was employed to semi-automate the acquisition process and thus reduce the data collection time. In order to produce a complete 3D model a number of partial scans were captured. This is a common procedure when working with a structured-light scanner. Eighteen partial scans were captured in total. The post-processing (cleaning, alignment and merging) of the partial scans was performed in the Optocat software suite that was provided by Breuckmann along with their digitisation systems. The average distance between two consecutive points on the 3D model was ~200μm and the accuracy of each
measurement was ~40μm. Figure 2 depicts some of the partial scans along with the complete 3D model produced. Colours in Figure 2 indicate data from different partial scans.
Figure 1: SmartSCAN 3D-HE structure light system (Breuckmann, 2016)
Figure 2: Partial scans and the complete ground truth model.
Figure 3: Data acquisition set-up
3.3 Focus Stacking
For the experimental application of focus stacking, a number of photos with varying focusing distances were taken with a Canon EOS 40D DSLR camera, which employs a CMOS sensor 22,2x14,8 mm and a CANON EF 135mm lens providing an f/2 maximum aperture. The camera was fixed on a tripod while the object was placed on a turntable to allow small rotational steps of about 10 degrees. This is a common approach which simulates the camera’s movement around the object (Figure 3). For each rotational step of 10 degrees, two measurements of the object distance were taken: one for the part of the object nearest to the camera and one for the farthest part, in order to estimate the boundaries of the focusing distance.
A different number of shots (14 to 24) were taken from each shooting position by manually rotating the focus ring of the lens, between the two boundaries of the focussing distance, The International Archives of the Photogrammetry, Remote Sensing and Spatial Information Sciences, Volume XLII-2/W3, 2017
which is related to closest and farthest parts of the object. The number of photos depended on the ‘depth’ of the object at every position, since it is not rotationally symmetric. Figure 4 illustrates an image with narrow DoF, which was used in the focus stacking procedure.
In the particular experimental setup, the DoF has been calculated with the use of the DoF application for Android devices (DoF application, 2017). The application calculates the DoF by using as input the camera model, the focal length, the focussing distance and the aperture value. In the present case, the average focusing distance was about 1.20m and the aperture value was f/4, so the DoF was estimated to 0.01cm.
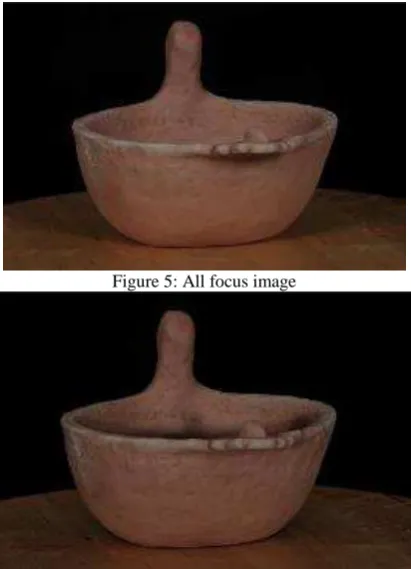
A large aperture (f/4) was selected to attain a shallow DoF. It should be noted that in all shots the combination of the sensor ISO 100, the aperture value (f/4) and the shutter speed (1/60) were the same, while all photos were taken under the same lighting conditions. Furthermore, a photo was taken at every rotational position, i.e. every 10 degrees, with the combination of the smallest aperture value (f/32) available, ISO 100 and shutter speed 1/60, in order to acquire the largest DoF photo for the particular lens, for the production of the all-focus 3D model (Figure 5).
For the control of the lighting conditions and shadow softening, professional lighting system consisting of two Bowens Duo Lite studio flashlights and their control panel (Bowens lights, 2017) with 40x50cm soft boxes were used. For the focus stacking photo session, these flashlights were placed approximately 3m away from the object at 45 degrees, right and left, and they were operated at their minimum luminance. For the wide DoF photo session the flashlights remained at the same orientation, but their luminance power was increased to maximum and they had to be moved closer to the object (at approximately 1m distance).
4. DATA INTERGRATION
The first step was the creation of the focus-stacked images (Figure 6), which was performed in the Zerene stacker software (Zerene Stacker, 2017). The software offers two methods for focus stacking, the pyramid approach (Pmax) and the Depth Map approach (Dmax). Both methods were tested and it was decided to use the pyramid approach as it produced better results than the depth map when creating the 3D models. The Agisoft Photoscan software was used for the 3D reconstruction of the object (Figure 7).
Figure 4: Image with narrow DoF
Figure 5: All focus image
Figure 6: Example of a focus-stacked image
Figure 7: 3D textured model by focus stacking technique
Two models were created using the SfM-MVS algorithm offered by the software, the first one with the use of the focus-stacked images (FS) and the second one with the use of the all-focus (AF) images. The produced 3D models (FS and AF) were based on a single closed-loop image sequence depicting the object from a sequence of viewpoints lying on a circle. This resulted a partial 3D reconstruction of the replica as parts of its interior are missing. Nevertheless, important morphological features (head, body and tail of the artefact) of the reconstructed surfaces were adequate for the purposes of our experiment. The two 3D models (FS and AF) were exported using the OBJ file format.
5. DATA EVALUATION
An objective evaluation of the quality of the produced 3D models can be based on the number of vertices produced during the spatial alignment of the photos (bundle adjustment) and the number of vertices produced during the dense point cloud reconstruction. Table 1 depicts these values.
An increase in the total number of vertices (matched corresponding points) produced during the image alignment when using the FS image set is an indicator that the focus The International Archives of the Photogrammetry, Remote Sensing and Spatial Information Sciences, Volume XLII-2/W3, 2017
stacking approach does affect the process. In turn, a higher number of vertices was also produced after the application of the dense stereo reconstruction. This is also visible in the total number of facets that each mesh carries. Although these values are not sound quality evaluation metrics, they can be considered as indicators that the focus stacking is positively affecting the reconstruction pipeline.
All-focus
(AF)
Focus stacking (FS) Number of vertices in Sparse
Point Cloud 41.799 47.623
Number of vertices in Dense
Point Cloud 4.067.367 4.236.623
Meshes 813.473 847.324
Table 1: Results from Agisoft Photoscan
5.1 3D Mesh Alignment and Registration
In order to compare the two SfM-MVS models (AF and FS) with the ground truth (GD) model produced by the structured-light system it was necessary for all of them to share the same reference system. This is vital step when performing objective comparisons. The Meshlab (MeshLab, 2017) software was used to transform and scale the AF and FS models in the same reference system as the GD. Once this was done, those scaled models were compared against the GD model using the CloudCompare software, in order to estimate any surface deviations. Of course, the models had to be aligned, and this was also done in CloudCompare; this was a semi-automated procedure, as initial common points were manually selected between each pair of models (AF-GD and FS-GD) (Figure 8). Table 2 presents the RMS error estimated after the alignment of each of the two model pairs.
5.2 3D Model Surface deviation
For comparing the surface deviation between each model pair (AF-GD and FS-GD) the cloud-to-mesh distance function was used as it is considered more robust to local noise. Specifically, the function computes the distances between each vertex of the point cloud to the nearest triangle of the mesh surface. The distance between two models is calculated as follows: in cases in which the orthogonal projection of the vertex lies inside the surface defined by a triangle, then the distance between the vertex and its point-of-intersection on the surface is calculated; otherwise, the algorithm estimates the distances between the vertex and its projection to the nearest edge or to the nearest vertex of the triangle (Koutsoudis et al., 2013). The models produced with SfM-MVS (AF and FS) were used as point clouds, whereas the GD model was a triangular mesh.
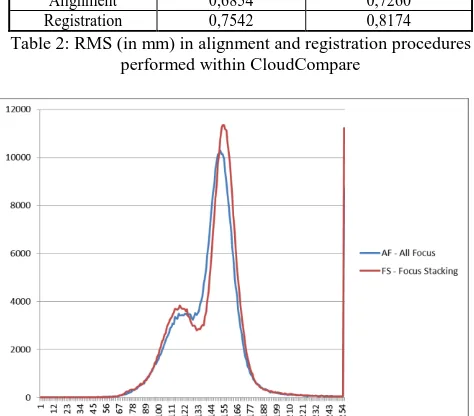
The comparison function produced a set of histograms (Figure 9), one for each pair of compared models. Each histogram bin represents a given Euclidian distance between a vertex and a facet ranging from -1mm up to 1mm and each bin holds a specific number of distances that fall within a given range. Thus, a higher concentration of distances close to zero (bin 128) indicates a smaller deviation between two models and hence an approach that performs closer to the ground truth. A total of 407,554 distances were evaluated in the AF-GD comparison and a total of 424,474 distances in the case of the SF-GD. This is due to the fact the SF model has a higher number of vertices in relation to the AF one.
The histogram presented in Figure 10 holds 256 bins where the middle bin (128) represents the best possible matching range (-0.007-0.001mm) between two surfaces. In this middle bin the AF model holds a total of 3,074 distances while the FS model holds 3,309 distances. A large number of outliers exist in the most distant bin on the positive side of the histogram. These are outliers that are delivered when comparing a complete 3D model (GD) with partials. AF and SF models are not complete – the replica’s interior is missing due to occlusions that were present from the single photoshooting angle.
In addition, as the bins that are closer to the centre of the above histogram are of greater importance due to the fact that they represent surfaces that are similar to the GD, it is also important to evaluate the performance of the two approaches in that area. In our experiments, we have expanded this comparison and selected as the most significant bins those that represent distances ranging from -0.08 to 0.08mm (Bins 118-138). In this area of the histogram the AF model holds a total of 75,500 distances while the SF holds 68,343.
Figure 8: Point selection for the alignment of the compared meshes
Procedure All Focus
AF-GD
Focus Stacking FS-GD
Alignment 0,6854 0,7260
Registration 0,7542 0,8174
Table 2: RMS (in mm) in alignment and registration procedures performed within CloudCompare
Figure 9: Surface Deviation of AF and FS in relation to GD The International Archives of the Photogrammetry, Remote Sensing and Spatial Information Sciences, Volume XLII-2/W3, 2017
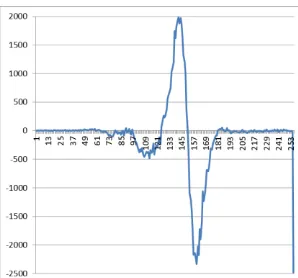
Figure 10: Histogram bin values deviation between AF and SF when compared with GD
Figure 11: Binary representation of bins with lower number of distances. Value One indicates SF and Value Zero indicates AF
In the case of AF these distances are divided to 31,102 that are on the negative side (-0.08 – 0mm) and 44,398 that are on the positive side (0-0.08mm). These equivalent values of SF are 32,726 and 35,617. Note that each model shows a better performance in one direction.
In addition, Figure 10 depicts the differences between the number of distances found at each histogram bin of the AF and FS models.
Moreover, Figure 11 depicts a binary representation of whereas a bin of the histogram in Figure 9 holds a lower number of distances for each of the two cases (AF and SF). In cases where the SF model has a lower number of distances in a specific bin then the histogram below has a value of one. On the other hand, it has a value of zero. According to Figure 11, the SF model has a total of 112 bins for which a lower number of distances exist.
6. COCLUDING REMARKS
This paper represents a first attempt towards an in-depth analysis and experimental evaluation of the effects of focus stacking in SfM-MVS-based 3D reconstructions. The work is considered to be a work-in-progress and further investigation is needed, as the attained results do not clearly indicate whereas the method allows the generation of more accurate 3D models. Currently, this experiment is being extended by using other camera lenses and set-ups, in order to be able to thoroughly assess if focus stacking is able to systematically offer an improvement in photogrammetric 3D reconstruction. In addition, several different objects are being considered for experimentation, so that objective and generalised conclusions are possible.
REFERENCES
Clini, P., Frapiccini, N., Mengoni, M., Nespeca, R. & Ruggeri, L., 2016. SFM Technique and Focus Stacking for Digital Documentation of Archaeological Artifacts. ISPRS - International Archives of the Photogrammetry, Remote Sensing
and Spatial Information Sciences, Volume XLI-B5, pp. 229-236.
Gallo, A., Bruno, F., Muzzupappa, M. & La, M. F., 2012. Multi-view 3D reconstruction of small stone samples deteriorated by Marine organisms. 18th International Conference on Virtual Systems and Multimedia (VSMM), IEEE, pp. 181-187.
Gallo, A., Muzzupappa, M. & Bruno, F., 2014. 3D reconstruction of small sized objects from a sequence of multi-focused images. Journal of Cultural Heritage, 15(2), pp. 173-182.
Koutsoudis, A., Vidmar, B., Arnaoutoglou F., Performance evaluation of a multi-image 3D reconstruction software on a low-feature artefact. Journal of Archaeological Science, 40(12), pp. 4450-4456.
Plisson, H. & Zotkina, L. V., 2015. From 2D to 3D at macro-and microscopic scale in rock art studies. Digital Applications in Archaeology and Cultural Heritage, 2(2), pp. 102-119.
Wang, W. & Chang, F., 2011. A multi-focus image fusion method based on Laplacian pyramid. Journal of Computers, 6(12), pp. 2559-2566.
Automated Focus Stacking,
http://web.engr.illinois.edu/~goodsit2/cs498dwh/final/ (last accessed 01/2017)
Bowens Lights, http://www.bowens.co.uk/, (last accessed 01/2017)
Breuckmann, smartSCAN 3D-HE,
http://www.eotech.fr/Fiches/produits/36_smartScan_HE_e_web .pdf,(last accessed 11/2016)
Cambridge in Colour, Focus stacking & depth of field,
http://www.cambridgeincolour.com/tutorials/focus-stacking.htm, (last accessed 01/2017)
CloudCompare, http://www.danielgm.net/cc/ (last accessed 01/2017)
DoF application for Android devices,
https://play.google.com/store/apps/details?id=com.aimenrg.dof
(last accessed 01/2017)
Hampson Archaeological Museum,
http://hampson.cast.uark.edu/, (last accessed 11/2016)
HeliconSoft, Understanding the focus stacking parameters,
http://www.heliconsoft.com/helicon-focus-main-parameters/, (last accessed 11/2016)
MeshLab software, http://www.meshlab.net/ (last accessed 01/2017)
PRESIOUS project, http://www.presious.eu/, (last accessed 01/2017)
Zerene stacker software, http://zerenesystems.com/cms/home
(last accessed 01/2017)