LIDAR-INCORPORATED TRAFFIC SIGN DETECTION FROM VIDEO LOG IMAGES
OF MOBILE MAPPING SYSTEM
Y. Lia, J.Fana, Y. Huanga,∗, Z. Chena
a
School of Remote Sensing and Information Engineering, Wuhan University, 129 Luoyu Rd, Wuhan, China, 430079
-(Liying1273, hycwhu, zychen)@whu.edu.cn,[email protected]
Commission I, WG I/Va
KEY WORDS:Traffic Sign Detection, Mobile Mapping System, RANSAC, Random Forest, Camshift, Kalman Filtering
ABSTRACT:
Mobile Mapping System (MMS) simultaneously collects the Lidar points and video log images in a scenario with the laser profiler and digital camera. Besides the textural details of video log images, it also captures the 3D geometric shape of point cloud. It is widely used to survey the street view and roadside transportation infrastructure, such as traffic sign, guardrail, etc., in many transportation agencies. Although many literature on traffic sign detection are available, they only focus on either Lidar or imagery data of traffic sign. Based on the well-calibrated extrinsic parameters of MMS, 3D Lidar points are, the first time, incorporated into 2D video log images to enhance the detection of traffic sign both physically and visually. Based on the local elevation, the 3D pavement area is first located. Within a certain distance and height of the pavement, points of the overhead and roadside traffic signs can be obtained according to the setup specification of traffic signs in different transportation agencies. The 3D candidate planes of traffic signs are then fitted using the RANSAC plane-fitting of those points. By projecting the candidate planes onto the image, Regions of Interest (ROIs) of traffic signs are found physically with the geometric constraints between laser profiling and camera imaging. The Random forest learning of the visual color and shape features of traffic signs is adopted to validate the sign ROIs from the video log images. The sequential occurrence of a traffic sign among consecutive video log images are defined by the geometric constraint of the imaging geometry and GPS movement. Candidate ROIs are predicted in this temporal context to double-check the salient traffic sign among video log images. The proposed algorithm is tested on a diverse set of scenarios on the interstate highway G-4 near Beijing, China under varying lighting conditions and occlusions. Experimental results show the proposed algorithm enhances the rate of detecting traffic signs with the incorporation of the 3D planar constraint of their Lidar points. It is promising for the robust and large-scale survey of most transportation infrastructure with the application of MMS.
1. INTRODUCTION
The improvement of Intelligent Transportation System is not on-ly beneficial to our daion-ly transportation but also gathering more intelligence in predicting the possible risk of driving. Traffic sign plays a significant role in regulating and controlling traffic ac-tivities, and ensures a safe and smooth traffic. The accurate de-tection and localization information of traffic signs are necessary for many intelligent transportation-related applications, like those systems of autonomous driving and driver assistance. As a result, automated traffic sign detection and recognition techniques are crucial for the transportation agencies to update the traffic sign inventory timely, and to improve the traffic quality and safety quickly.
Traditionally, most of the traffic sign detections are based on tex-tual and color details of video log images. But only images can hardly achieve precise detection results. It is challenging to cope with the complex texture and color corruption in the urban envi-ronment. With the laser profiler and digital camera, mobile map-ping system (MMS) provides an effective way for acquiring very dense point clouds as well as road video log images in a scenari-o. Mobile laser scanning (MLS) has proven to be very efficient in acquiring very dense point clouds (over 800 points per square meter) along road corridors. Integrated in a mobile mapping sys-tem, the data acquired by laser scanners can be used to robustly capture the geometry of the road environment and be the basis for the recognition of a wide range of objects.
∗Corresponding author
However, to take full advantage of using MMS, they must be used in optimal applications. Unlike other literatures, the 3D point cloud will play a special role in traffic sign detection. In this study, we focus on the detection and tracking of traffic signs using 3D Lidar points and 2D video log images by considering the imaging geometry and GPS movement. The global strategy for detection and tracking by filtering the noise point through set-ting distance and elevation thresholds, the rough area of traffic sign can be obtained. Then we project the candidate planes fit-ted by RANSAC onto the image, regions of Interest (ROIs) of traffic signs are localized in the video log images. At this stage, Random Forest is adopted to detect the traffic signs among these ROIs. Finally, a tracking algorithm is proposed to analyze this temporal context by combining the Camshift and Kalman filter-ing together.
2. TRAFFIC SIGN LOCALIZATION
The proposed traffic sign detection algorithm first focuses on us-ing the distance and elevation information to segment the traffic signs from the point cloud. By filtering the noise point through setting distance and elevation thresholds, the rough area of traffic sign can be obtained. Then we project the candidate planes fitted by RANSAC onto the image, regions of Interest (ROIs) of traffic signs are localized in the video log images.
2.1 Pre-processing
We need to handle laser point clouds to reduce the amounts of data to process or it will be time-consuming. The 3D data we ac-quire includes pavements, traffic signs, buildings, billboards, it is important to extract the local interest information instead of the whole data. Those points consist mainly of two types: one is on the ground such as traffic signs, billboards, trees and guardrail-s; the other is ground segments like pavements, lane markings. Considering the data of each photo contains the trajectory po-sition of the vehicle, the range containing the road as well as the traffic sign can be located temporally from a large scenari-o. Within a certain distance and height of the pavement boundary and plane respectively, points of the overhead and roadside traf-fic signs can then be obtained through the setup specitraf-fication of traffic signs.
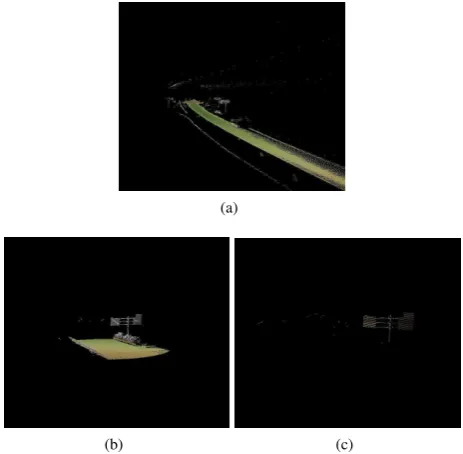
Since the point cloud data contains huge information and involves in thousands of pictures like Figure.3(a), we need to set values for distance and elevation to obtain necessary points for single image. The classification starts with the distance from the 3D points to the sensor is computed, and points further than 20 me-ters are filtered out. At this case, it is obvious that the remaining points contain a set of points that belong to traffic signs, but they still include points on the floor, on lane markings and on near-by buildings, as Figure.3(b) Among the whole points, traffic sign points are mostly in higher altitude compared to other belong-ings. According to the Chinese road traffic laws, the traffic sign is placed on the edge of the road shoulder, and its height is 2 to 2.5 meter away from the road. We reserve those points whose elevation is 1.8 meters higher than the average, the general road plane’s height. As we can see from the Figure.1(c), only the in-formation of the traffic sign where the MMS is traveling will be kept for further processing.
2.2 RANSAC
After the first pre-processing step, the remaining point clouds contain mainly the road sign. The 3D candidate planes of traf-fic signs are then fitted using the RANSAC plane-fitting strategy
(a)
(b) (c)
Figure 1: Different results after pre-processing. (a) Original point clouds; (b) The remaining points after certain distance is set; (c)Only the points around the traffic sign is reserved.
among those points.
The RANSAC algorithm is a learning technique to estimate pa-rameters of a mathematical model from a set of observed data contains both inliers and outliers. Inliers can be explained by a model with a particular set of parameter values, while outliers do not fit that model in any circumstance. The voting scheme is used in RANSAC to find the optimal fitting result. The im-plementation of this voting scheme is based on two assumptions: the entire data we are observing consists of both inliers and out-liers, and a process which can optimally estimate the available parameters of the chosen model from the inliers. The input to the RANSAC algorithm is a set of observed data values including point clouds produced from previous step, a way of fitting some kind of model to the observations, and some confidence param-eters. The RANSAC algorithm is essentially composed of two steps that are iteratively repeated:
• Firstly, a sample subset containing minimal data items is randomly selected from the input dataset. We can get the fitting model and the corresponding model parameters by computing the elements of this sample subset. The cardinal-ity of the sample subset is the smallest sufficient to deter-mine the model parameters.
• Secondly, for all the points in our data, the distance to the fitting model is computed. A data element will be consid-ered as an outlier if its distance is larger than the threshold we set before the procedure.
An advantage of RANSAC is its ability to estimate the model parameters robustly. But, RANSAC can only do the estimation of the parameter model we want for a particular data set, i.e. if the data contains traffic sign and greenbelts, the plane fitted by RANSAC may fail to find either one.
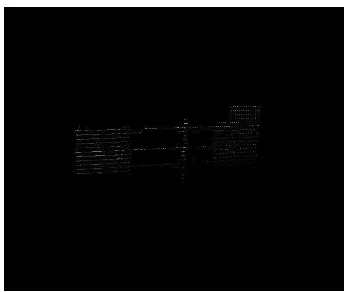
Figure 2: The plane result fitted by RANSAC.
2.3 Projection
During the third phase of our procedure, the projection of traffic signs plane is accomplished by using co-linearity equation, via shooting rays from the image to the 3D geometry. Traditional road sign detection is carried out using 2D image only, this may would not guarantee high accuracy. Also, the spatial resolution of a point cloud is not enough to recognize traffic sign. The best source of information that the MMS provides for the recogni-tion task are RGB cameras, whose internal calibrarecogni-tion and exter-nal orientation parameters with respect to the vehicle are known. The relative registration between laser point clouds and array C-CD images is achieved by using POS data and relative position of each sensor.
Letx,yrefer to a coordinate system with thex-axis andy-axis in the sensor plane. Denote the coordinates of the point P on the object byxp,yp,zp, the coordinates of the image point of P on the sensor plane byxandyand the coordinates of the projection (optical) center byx0,y0,z0. As a consequence of the projection
Solving forλin the last equation and entering it in the others yields:
The point P is normally given in some coordinate system ”out-side” the camera by the coordinatesX, YandZ, and the pro-jection center byX0,Y0,Z0. These coordinates may be trans-formed through a rotation and a translation to the system on the camera. The translation doesn’t influence the differences of the coordinates, and the rotation, often called camera transformation, is given by a3×3-matrixR, transforming(X−X0, Y−Y0, Z−
Substitution of these expressions, leads to a set of two equations, known as the collinearity equations:
x−x0=−c The most obvious use of these equations is for images recorded by a camera. The projection process can be described by transfor-mations from object space(X, Y, Z)to image coordinates(x, y). It indicates that the image point (on the sensor plate of the cam-era), the observed point (on the object) and the projection center of the camera were aligned when the picture was taken. After projection, the candidate region is located shown as Figure.3(b)
3. TRAFFIC SIGN DETECTION
By projecting the candidate planes onto the image, Regions of Interest (ROIs) of traffic signs are found physically with the ge-ometric constraints between laser profiling and camera imaging. At this stage, Random Forest is adopted to detect the traffic signs among these ROIs.
Based on the blob feature of (Vicen-Bueno et al., 2005), a blob of 24*24 pixels for each component(R, G, and B) of each ROI of the video log image is sent to random forest classifier. The total dimension of the input vector is 51 nodes. They consists of 3 normalized average maximum pixel values, MR, MG and MB, 24 inputs from the vertical histogram (vh) and 24 inputs from the horizontal histogram(hh).
Random forests, introduced by Breiman and Cutler (Breiman, 2001), are an ensemble learning method for classification. It is operated by constructing a multiple of decision trees at training time and outputting the class. Each tree in the ensemble is built from a random sample of the original data with replacement from the original training data. The main steps of random forest are as follows:
• Take a subset from the whole set of data (training set).
• The algorithm clusters the data in groups and subgroups. If
and lines that connect subgroups into group etc. the struc-ture would look somewhat like a tree. This is called a deci-sion tree. At each split or node in this cluster/tree/dendrogram variables are chosen at random by the program to judge whether data points have a close relationship or not.
• The program makes multiple trees a.k.a. a forest. Each tree
is different because for each split in a tree, variables are cho-sen at random.
• Then the rest of the dataset (not the training set) is used to predict which tree in the forests makes the best classification of the data points (in the dataset the right classification is known).
• The tree with the most predictive power is shown as output by the algorithm.
The random forests achieve state-of-the-art performance in many multi-class classification applications. A further advantage is that they are fast to build, easy to implement in a distributed comput-ing environment
4. TRAFFIC SIGN TRACKING
The sequential occurrence of a traffic sign among consecutive video log images are defined by the geometric constraint of the imaging geometry and GPS movement. Candidate ROIs are ana-lyzed in this temporal context to double-check the salient traffic sign among video log images. In this section, a tracking algo-rithm is proposed to analyze this temporal context by combining the Camshift and Kalman filtering together. Camshift can track the moving objects quickly and robustly, using the color charac-teristics. Kalman filtering can predict the most probable object location in the next frame according to the geometric constraints and the updated observations in the current frame.
4.1 Camshift
The Camshaft algorithm is based on the color probability distri-bution of the target, so the changes of the object shape would not affect the result. By calculating similarity of the color probability distribution, the moving target in the current frame image location is taken as the initial location of the next frame. Its core algorithm is the Meanshift algorithm, a probability density estimation based on rapid non-parametric pattern. Meanshift looks for the maxima of a density function and Camshift is the extension of it. The flow of the algorithm is as follows:
1. Set the size of the search window(s) in the color probability distribution.
2. Calculate the zero moments:
M00=
Where,I(x, y)is the image element value of coordinates
(x, y), andxandychange in the scope of the search
win-4. The size of the search window that is the function of a color probability distribution of the former search window can be re-installed as s.
5. Repeat steps 2, 3, 4 until they are constringent (the change of the center of mass is less than the threshold value).
6. The major axis l, minor axis w and direction angle of the target can be obtained by calculating the second-order ma-trix.
Following the aforementioned procedures yields a window which is very likely to contain the original target. However, if the occlu-sion or large-scale similar color interference occur during track-ing process, Camshift algorithm will fail. In order to deal with such problem, we improves the Camshift algorithm in two ways: background subtraction algorithm and kalman algorithm.
4.2 Kalman filter
Before we do Camshift method, we need to judge the effects of background to the tracking. If the background color is too sim-ilar to the object, we need to use background subtraction first. It is a motion detection algorithm begins with the segmentation part where foreground or moving objects are segmented from the background. The simplest way to implement this is to take the previous image as background and take the current frames, de-noted by I to compare with the background image dede-noted by B. Here using simple arithmetic calculations, we can segment out the objects simply by using image subtraction technique of com-puter vision meaning for each pixels in I, take the pixel value denoted byP[I]and subtract it with the corresponding pixels at the same position on the background image denoted asP[B].
P[F] =P[I]−P[B], (22)
targets. The key of kalman filter is prediction and update. The state vectorXk = [x, y, Vx, Vy], measurement vector isYk =
[x, y]T
, WherexandVx are the target image in the horizontal direction of the position and velocity; yand Vy are the target image in the vertical position and velocity. The state equation of the system is (23), and observation equation is (24).
Xk+1=AkXk+Wk (23)
Yk+1=HkXk+Vk (24)
WhereAkis state transition matrix. Ykis measurement state of system. Hk is observation matrix. Wk is dynamic noise cor-responding to state vector, andVk is measurement noise corre-sponding to observation vector. The equation of prediction and update are as follows:
Prediction-equation1:
Xk′=F∗Xk−1 (25)
Prediction-equation2:
Pk′=F·Pk−1·F
T
+Q (26)
Kalman-gain-equation:
Kk′=Pk′·HT·(H·Pk′·HT+R)−
1
(27)
Update-equation1:
Xk=Xk′+Kk·(Zk−H·Xk′) (28)
Update-equation2:
Pk=Pk′−Kk·H·Pk′ (29)
where F is state transition matrix , H is measurement matrix, Q represents process noise covariance matrix and measurement noise covariance matrix is R.
The main steps are as follows:
• Whether the background color is similar to the object, if it is, we do background subtraction first.
• Initialize a search window.
• Search the target using CamShift algorithm in the estimated range to locate the possible position of target.
• Estimate the appearing position of target in the next moment by Kalman filter.
• If the diatance of Camshift predicted center and kalmans center is in the threshold, the search is seen as a success, and the observed value of Kalman filter will be regarded as the next window position.
5. EXPERIMENTAL RESULTS
In this section, the proposed algorithm is tested for the accuracy of traffic sign detection using the video log images and 3D point cloud of the MMS. The data is captured on May 19th 2013 in Ningbo, China and provided by Leador Spatial company. All the detection and tracking methods are programmed with VS2010 and are executed on a PC of 2.3GHz Pentium 4 with 6GB RAM with the Windows 64 bits operating system. The size of video image is 2448×2048.
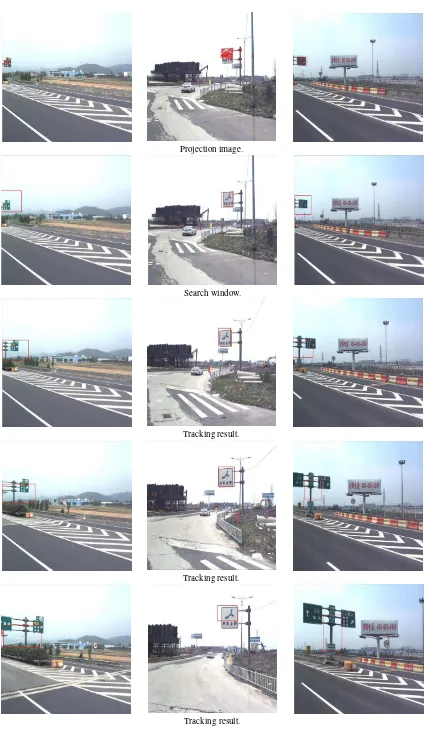
The experiments demonstrated the detection and tracking of the traffic sign. For most traffic sign which only appears in few im-ages, we project our 3D point cloud onto the first image involv-ing the traffic sign. After projectinvolv-ing the fitted planes onto the image, regions of interest of traffic signs are localized in the im-age. Then we use random forest to detect our traffic sign, the algorithm obtained a higher accuracy than traditional methods, which improves our detection efficiency quickly. Then we ini-tialize the search window for tracking according to the ROIs. The background of the video log image is similar to what we need to track, thus the search window we set is larger than ROIs but share the same center. By using Camshift and Kalman filter, our track-ing outputs are shown as Figure 4. In most cases, we can track the object successfully. One reason is the well-fused 3D point cloud with the video log image, through which we can narrow the search region in our images and eliminate the noise interference effectively. Besides, the RANSAC algorithm helps us screening out some noise points by fitting a cluster of point into a plane of a limited tolerance. If we track the object on a consecutive images successfully, for instance, in the first four images, we can tack the object in three or more images, a conclusion can be made that we definitely detect a traffic sign.
However, when traffic signs are mixed up together with trees, our pre-processing sometimes may fail to localize the traffic sign, as shown in Figure.5. The traffic sign sits in the bush, our RANSAC fitting of planes can not achieve high accuracy with the distur-bance of those points of trees, as shown in Figure.6. The con-trast between our traffic sign and background becomes low in Figure.7, where we can’t predict the right position and track the sign timely, as shown in Figure.8.
Figure 5: The traffic sign sits in the bush.
Projection image.
Search window.
Tracking result.
Tracking result.
Figure 7: The background of the video log image is similar to what we need to track.
Figure 8: The predicted position of the traffic sign is deviated from the right position.
6. CONCLUSION AND RECOMMENDATIONS
Mobile Mapping System (MMS) collects the Lidar points by the laser profiler, as well as the video log images in a scenario with the digital camera. However, most literature focuses on the textu-ral/color details of video log images and the 3D geometric shape of point cloud separately. In this paper, 3D Lidar points are in-corporated into 2D video log images to enhance the detection of traffic sign both physically and visually. By filtering the noise point through setting distance and elevation thresholds, the rough area of traffic sign can be obtained. Then we project the candi-date planes fitted by RANSAC onto the image , regions of Inter-est (ROIs) of traffic signs are localized and sent to random forInter-est classifier. Candidate ROIs will be tracked using the Camshift and Kalman filter among consecutive video log images. The proposed algorithm is tested on video logs with the size of 2448×2048.
Experimental results show the proposed algorithm can not only detect traffic signs but also track the next possible occurrence of candidate ROIs. It is promising for automatic identification of traffic signs.
Although the proposed algorithm demonstrates its capability for traffic sign detection, we recommend that:
• Reduce interference of billboards using the rule, which is lo-cated regularly alongside the pavement and larger than most road signs.
• Increase the exposure in areas with poor weather conditions, which will refine the candidate ROIs in tracking the similar color.
• Innovative formulation and application of such process as Camshift and Kalman filter.
ACKNOWLEDGEMENTS
The authors are grateful for the support of the program of Low-cost GNSS / INS Deep-coupling System of Surveying and Map-ping (Program NO 2015AA124001), State Key Technology Re-search and Development Program (863), China.This work was also jointly supported by the National Natural Science Founda-tion of China (No. 41271431), and the science and technology plan of sichuan bureau of surveying, mapping and geoinforma-tion(No. J2014ZC02).
REFERENCES
Barrile, V., Meduri, G. M. and Cuzzocrea, D., 2008. Automatic recognition of road signs by hough transform. Journal of Earth Science & Engineering.
Breiman, L., 2001. Random forests. Machine learning 45(1), pp. 5–32.
Crandall, D., Owens, A., Snavely, N. and Huttenlocher, D., 2011. Discrete-continuous optimization for large-scale structure from motion. In: IEEE Conference on Computer Vision & Pattern Recognition, pp. 3001–3008.
Fleyeh, H., 2006. Shadow and highlight invariant colour segmen-tation algorithm for traffic signs. In: Cybernetics and Intelligent Systems, 2006 IEEE Conference on, pp. 1–7.
Golparvar-Fard, M., Balali, V. and Garza, J. M. D. L., 2012. Seg-mentation and recognition of highway assets using image-based 3d point clouds and semantic texton forests. Journal of Comput-ing in Civil EngineerComput-ing.
Gomez-Moreno, H., Maldonado-Bascon, S., Gil-Jimenez, P. and Lafuente-Arroyo, S., 2010. Goal evaluation of segmentation al-gorithms for traffic sign recognition. IEEE Transactions on Intel-ligent Transportation Systems 11(4), pp. 917 – 930.
Heng, L., Lee, G. H., Fraundorfer, F. and Pollefeys, M., 2011. Real-time photo-realistic 3d mapping for micro aerial vehicles. In: IEEE/RSJ International Conference on Intelligent Robot-s & SyRobot-stemRobot-s IEEE/RSJ International Conference on Intelligent Robots & Systems, pp. 4012–4019.
Landesa-Vazquez, I., Parada-Loira, F. and Alba-Castro, J., 2010. Fast real-time multiclass traffic sign detection based on novel shape and texture descriptors. In: Conference Record - IEEE Conference on Intelligent Transportation Systems, pp. 1388– 1395.
Li, H., Sun, F., Liu, L. and Wang, L., 2015. A novel traffic sign detection method via color segmentation and robust shape match-ing. Neurocomputing 169, pp. 77–88.
Liu, C., Chang, F. and Chen, Z., 2014. Rapid multiclass traffic sign detection in high-resolution images. IEEE Transactions on Intelligent Transportation Systems 15(6), pp. 2394–2403.
Shadeed, W. G., Abu-Al-Nadi, D. I. and Mismar, M. J., 2003. Road traffic sign detection in color images. In: Electronics, Cir-cuits and Systems, 2003. ICECS 2003. Proceedings of the 2003 10th IEEE International Conference on, pp. 890 – 893 Vol.2.
Soiln, M., Riveiro, B., Martłnez-Snchez, J. and Arias, P., 2016. Traffic sign detection in mls acquired point clouds for geometric and image-based semantic inventory. Isprs Journal of Photogram-metry & Remote Sensing 114, pp. 92–101.
Vicen-Bueno, R., Gil-Pita, R., Jarabo-Amores, M. and Lopez-Ferreras, F., 2005. Complexity reduction in neural networks ap-plied to traffic sign recognition tasks. In: Signal Processing Con-ference, 2005 13th European, IEEE, pp. 1–4.
Yang, M., Gu, X., Lu, H., Wang, C. and Ye, L., 2015. Panorama-based multilane recognition for advanced navigation map gener-ation. Mathematical Problems in Engineering 2015, pp. 1–14.