UAV MULTISPECTRAL SURVEY TO MAP SOIL AND CROP FOR PRECISION
FARMING APPLICATIONS
Giovanna Sonaa*, Daniele Passonia, Livio Pintoa, Diana Pagliaria, Daniele Masseroni b, Bianca Ortuanib, Arianna Facchib a Dept.Eng.Civil and Environ., Politecnico di Milano, Piazza L.Da Vinci 32, 20123 Milano, Italy - (giovanna.sona, daniele.passoni,
livio.pinto, diana.pagliari)@polimi.it
b Dept. of Agricultural and Environmental Sciences, University of Milan, Via Celoria 2, 20123 Milano, Italy - (bianca.ortuani, arianna.facchi, daniele.masseroni)@unimi.it
Commission I, ICWG I/Vb
KEY WORDS: UAV, multispectral images, DEM, orthophoto, NDVI, precision farming, soil and crop characterization
ABSTRACT
New sensors mounted on UAV and optimal procedures for survey, data acquisition and analysis are continuously developed and tested for applications in precision farming. Procedures to integrate multispectral aerial data about soil and crop and ground-based proximal geophysical data are a recent research topic aimed to delineate homogeneous zones for the management of agricultural inputs (i.e., water, nutrients). Multispectral and multitemporal orthomosaics were produced over a test field (a 100 m x 200 m plot within a maize field), to map vegetation and soil indices, as well as crop heights, with suitable ground resolution. UAV flights were performed in two moments during the crop season, before sowing on bare soil, and just before flowering when maize was nearly at the maximum height. Two cameras, for color (RGB) and false color (NIR-RG) images, were used.
The images were processed in Agisoft Photoscan to produce Digital Surface Model (DSM) of bare soil and crop, and multispectral orthophotos. To overcome some difficulties in the automatic searching of matching points for the block adjustment of the crop image, also the scientific software developed by Politecnico of Milan was used to enhance images orientation.
Surveys and image processing are described, as well as results about classification of multispectral-multitemporal orthophotos and soil indices.
1. INTRODUCTION
Food security and environmental conservation are two of the greatest challenges facing the world today. It is predicted that food production must increase by at least 70% before 2050 to support continued population growth, although the size of the world’s agricultural area will remain essentially unchanged. An objective to face these challenges is the development of productive, sustainable and resource-efficient primary production systems. A more efficient use of agricultural inputs, i.e. water, nutrients and chemicals for crop protection, can improve the crop yield, both in quantity and quality, reducing the environmental impact of production as well. The adoption of site-specific (SS) management practices is fundamental for this objective. Indeed the SS management applies inputs with variable rates, taking into account the existing within-field variability of soil and crops, thus using resources more efficiently.
The SS management requires detailed information to characterise the within-field variability of soil, plant and crop yield and to delineate homogeneous sub-regions with similar properties affecting yield (Site Specific Management Units, SSMU). Mapping of soil electrical conductivity (EC) through geophysical proximal soil sensors is one of the most reliable and commonly used technique to obtain quick and high resolution soil maps (Corwin et al. 2003, Morari et al. 2009, Moral et al 2010, Meirvenne 2013). Nevertheless other type of ancillary data from optical sensors in the visible (VIS), near-infrared (NIR) and thermal near-infrared (TIR) regions can be combined with EC data to characterise the soil spatial variability (Corwin 2008) and to improve the delineation of SSMU (Lopez-Lozano et al. 2010, Scudiero et al. 2013). NIR reflectance has been correlated with many soil properties,
including total C, total N, water content and texture (Chang et al, 2001; Viscarra Rossel et al, 2006) whereas the vegetation index NDVI (Normalized Difference Vegetation Index), calculated as a combination of VIS and NIR data, is related with soil organic carbon (Gomez et al, 2008; Zhang et al., 2012). Recent works by Maltese et al. (2010) and Minacapilli et al. (2012) emphasize the use of optical sensors of new generation to acquire images of the bare soil in the VIS-NIR and thermal infrared (TIR) through which to evaluate the spatial distribution of the soil water content. In particular, the soil thermal inertia method is widely used to estimate soil moisture from spectral images of bare soil in the VIS-NIR and TIR regions (Lu et al., 2009; Minacapilli et al., 2009, 2012; Antonucci et al., 2011), by applying inversion procedures of the thermal inertia or of the apparent thermal inertia derived from the spectral images, for which only the soil porosity is required to be known.
Nowadays light and low cost optical and thermal cameras are available that can be mounted on lightweight UAV, thus providing an efficient way of collecting high resolution data. Moreover, considerable improvements in automatic and accurate processing of images have been reached, through the development of Structure from Motion based software. (Colomina and Molina, 2014, DeBell et al. 2016).
UAVs have already given evidence of being an appropriate platform for mapping forests and agricultural crops, when aerial or satellite images have poor spatial or temporal resolution (Laliberte et al, 2011; Gini et al, 2014, Dunford et al, 2009, Berni et al., 2009, Nebiker et al., 2008, Hunt et al., 2005). On the other hand, the so-called "precision agriculture" requires information on the inherent spatial variability of soil and crop properties, and uses this information to prescribe appropriate management strategy on a site-specific basis (Agüera et al., 2011). By using soil and crop indices derived from visible,
near-infrared, thermal infrared images and appropriate combinations it is possible to obtain information on soil water content and crop health, i.e. crop water and nitrogen status. UAVs are used in precision agriculture, in addition to ground observations. In recent years, extensive and accurate studies were done to enhance and speed up the spatial co-registration and the processing of images, to generate different kinds of thematic maps for agricultural crop monitoring.
Nevertheless, the production of soil or vegetation maps from UAV imagery still presents challenges. Although the spatial resolution is very high, the spectral and radiometric resolutions obtained by the low-cost compact cameras are relatively low. Moreover, poor radiometric and geometric calibrations are often achieved by using common digital cameras.
On the other hand, lightweight multispectral and hyperspectral sensors of high quality which can be mounted on mini-UAV are available only since few years and are not so wide spread due to their costs. Therefore, efforts have been done to optimize the procedures for acquisition and processing of images taken from UAV mounting low cost cameras, with low spectral resolution. The present photogrammetric workflow starts from the automatic search of matching points among images, in order to perform the block adjustment, then it determines a dense cloud of object points, from which a digital surface model (DSM) is formed.
The production of high resolution thematic maps from aerial images is based on the rigorous projection of oriented images on the DSM (orthophotos). , In case of images mostly covered by a regular texture, as for crops and ploughed soils, a critical point in this workflow is the initial step to search matching points. Images taken at low altitudes over vegetation, and the following usual configuration of photogrammetric blocks, can be difficult to process by automatic commercial software, because of the object distance and its shape, and of the overlappings along and across strips. Fine tuning is needed in flight planning in order to improve efficiency (Dandois et al., 2015).
This paper describes two multispectral surveys performed over a maize field on bare soil before sowing, and at a later time, on the crop, when maize was nearly at the maximum height, just before flowering.
The difficulties arisen in using automatic processing algorithms available in commercial softwares based on Structure for Motion algorithms are analyzed, and the corrective actions which were adopted are described. These actions imply the use of scientific software packages and iterative procedures to optimize the computations.
The procedures (not completely automatic) adopted to produce DSM, orthophotos and maps of spectral indices are illustrated. Finally a first analysis of soil classification, obtained by a joint use of aerial optical data and ground geophysical data, is presented.
2. AREA TEST AND DATA CAPTURE
2.1 Area test
The experimental site is a 96 m × 192 m plot of sandy-loam soil located within an arable field in Northern Italy (Landriano – PV, 521109E 5018754N), 20 km south from Milan.
Topography is relatively homogeneous and flat. Site aspect is north-south, whereas the average slope in the N–S direction is around 0.3 %.
The monitoring activities were conducted from October 2014, after crop harvesting, to August 2015. The field was sowed with Zea-mays at the beginning of April 2015, and the harvest was at the end of August 2015.
2.2 Photogrammetric data capture
A photogrammetric test was carried out to map the crop height; two different surveys were needed to this aim: the first one was performed on 8 April 2015 on bare soil before sowing (maize completely absent); the second one was performed on 23 June 2015 on crop just before the flowering.. The UAV Hexakopter by MikroKopter was used. The system is equipped with a low cost GPS receiver (Ublox LEA GH) and a triaxial magnetometer. The vehicle is characterized by limited weight (∼ 1200 g) and a payload of 500g. These features make it suitable for photogrammetric flights over limited areas (about 0.03 km2) to obtain very high spatial resolution images (1–2 cm of ground sample distance, GSD). The propulsion is electric, with a maximum flight time around 15 min. The nominal cruise speed is ∼ 18 km h−1, with a radio link range about 0.5 km from the master station on the ground. The hexacopter is able to perform pre-planned flights in a fully automated mode, since it continuously analyzes data from the onboard GPS/IMU system. However, the operator can always recover full control of the system. The UAV can be mounted with a compact color camera Canon EOS M and a false-color camera Tetracam ADCLite (Agricultural Digital Camera).
The Canon EOS M has a fixed focal length equal to 22 mm and the sensor size of 22.3 × 14.9 mm2, with a resolution of 18 Mpixel. The Tetracam ADCLite (Tetracam, 2012) is a lightweight camera (200g) especially designed for UAV applications and it features a single CMOS sensor of 3.2 megapixels. The focal length is about 8 mm. It is optimised to capture visible wavelengths (> 520 nm) and NIR wavelengths up to 920 nm. In particular, the three bands are approximately equal to TM2, TM3 and TM4 (Thematic Mapper sensor of the Landsat satellite series). The resulting NIR-RG (Near InfraRed, Red and Green) imagery is suitable to derive several vegetation indices, canopy segmentation and NIR/Green ratios.
The case study here presented should be classified in the context of noncritical operations, conducted in Visual Line of Sight (VLoS). For these situations, the rules of the Italian Civil Aviation Authority (Ente Nazionale Aviazione Civile, ENAC) require that the pilot can maintain a direct eye contact with the UAV, to monitor the flight with respect to other aircraft, infrastructure and people in order to avoid collisions. Therefore operations in VLoS are allowed up to a maximum horizontal distance of 50m and a maximum height of 150m above ground level. Moreover, all the operations must be conducted safely and without harm to third parties. The flights realized at the Landriano site were designed following all these regulations. The RGB and NIR-RG flights were designed with a maximum height equal to 45 m over the soil, and an average GSD equal to 0.009 m and 0.017 m respectively. Flight plans were organized in 4 strips for the RGB flight (Figure 1, above), and in 6 strips for the NIR-RG one (Figure 1, below), due to the different image footprint.
The photogrammetric block relative to the April flights was georeferenced using 19 Ground Control Points (GCPs), marked with square targets of size 0.30 × 0.30 m2 divided in black and white triangles. Each GCP was surveyed with a dual frequency GNSS receiver with the antenna mounted on a pole. The receiver can work in RTK mode, using the differential correction send by NETGEO permanent network (Topcon Positioning). The GCPs accuracy was about 2-3 cm.
Figure 1. The flight paths: RGB (above), NIR-RG (below).
The photogrammetric block relative to the June flights was georeferenced with only 13 GCP. The targets were located on poles 2.5m high and the RTK-GNSS survey was realized on the side of the markers. For this reason the GCPs accuracy was about 30 cm.
2.3 Geophysical soil sensing and crop yield measurements
The Profiler-EMP400 (by Geophysical Survey Systems Inc., Nashua, New Hampshire, USA) was used to measure soil EC with non-contact methods based on the principle of electromagnetic induction (EMI). The Profiler-EMP400, which is a multi-frequency EMI sensor, was used in vertical dipole orientation mode, with selected frequencies 5 kHz, 10 kHz and 15 kHz
EMI surveys were carried out on bare soil in two soil water conditions slightly different, even if both were near the field capacity, at the end of October 2014 and at the beginning of April 2015, just before sowing. The measurements were acquired along 9 transects 12 m apart and 192 m long.
The EC data were interpolated on a regular grid with 1 m spacing and the interpolated values were converted into electrical resistivity (ER) values to derive three ER maps corresponding to the increasing soil depths with the decreasing selected frequencies.
Finally, crop yield was measured at the end of August 2015 in 14 plots (2 m × 2 m) randomly distributed (Ortuani et al., 2016).
3. PHOTOGRAMMETRIC PROCESSING
3.1 DSM and orthophotos on bare soil
3.1.1 RGB image block
The surveys, performed as described in section 2, produced 121 images suitable for processing (out of 187 acquired). The image
block was processed with Agisoft Photoscan (Agisoft, 2016), in the reference system EFRF2000 and the map projection UTM32N. Only 11 out of the 19 GCP were used for exterior orientation, due to poor observation or because the points were external to the images. In Table 1 the global accuracies of GCPs are summarized, in terms of statistics of the absolute values of residuals. The values in the last row are the theoretical accuracies, computed assuming the normal case configuration; the experimental accuracies are coherent with them.
East Nord Up
Mean [m] 0.006 0.005 0.002
Std.Dev. [m] 0.005 0.003 0.002
Max [m] 0.014 0.011 0.006
"a priori" RMS [m] 0.009 0.009 0.073
Table 1. Statistics of residuals on GCPs for RGB survey on bare soil.
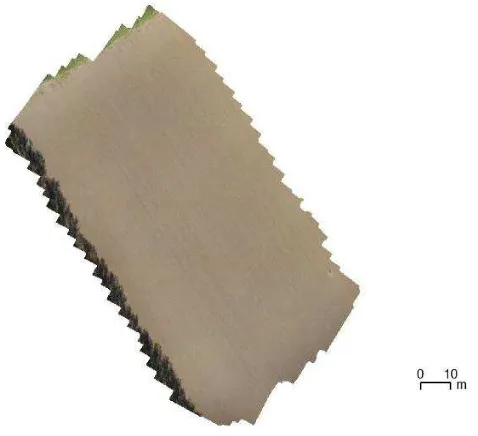
In Figure 2 the bare soil orthophoto is presented (ground pixel 5 cm).
Figure 2. Color (RGB) orthophoto of bare soil, computed with Agisoft Photoscan
3.1.2 NIR-RG image block
Both Agisoft Photoscan and PhotoModeler (Photomodeler, 2012), which were used to orient the images taken with Tetracam ADCLite on bare soil, didn't produced a straightforward solution. Therefore another software was exploited, Pix4D (Pix4D, 2015), that includes the used camera in its specific database., The block orientation was achieved by selecting 165 images among the 210 acquired. The NIR-RG orthophoto was produced with the oriented images, and the DSM obtained from the RGB block processing,.
A first visual check of it pointed out a set of problems in computing the block orientation parameters, providingthe discontinuities in the soil features. An attempt was done, to
improve the quality of results, working on smaller blocks of images, that were separately oriented and projected, thus obtaining more uniform sub-plots. The orthophoto of the whole area was produced by merging these parts in ArcGIS (ArcGIS, 2016).
Figure 3 shows the mosaicked orthophoto, characterized by a good geometric accuracy (tracks and lines are properly aligned inside and among blocks) but some visible discontinuities in radiometry between sub-blocks. These dishomogeneities, however, do not affect the computation of the required indices, obtained through ratios. Planimetric coordinates of GCPs were determined on the final orthophoto in order to validate it through comparison with those obtained by GPS survey.
Figure 3. NIR-RG orthophoto of bare soil, computed with Pix4D and mosaicked in ArcGIS
Statistic of absolute residuals are reported in Table 2. Two points were discarded as outliers, due to their very large values of residuals; they belong indeed to a small sub-block at the edge of the area. As the statistics of GCP residuals were coherent with the orthophoto pixel dimension of 5cm, this solution was chosen as the final one.
East Nord
Mean [m] 0.053 0.077
Std.Dev. [m] 0.033 0.047
Max [m] 0.113 0.181
Table 2. Statistics of residuals on GCPs for NIR-RG survey on bare soil.
.
3.1.3 Radiometric indices of bare soil
After completion of block orientation and orthophoto production, maps of soil variability were computed, based on radiometric indices, representative of the soil moisture content. To this aim the first index considered was the NDVI, that can be computed from the available spectral information.
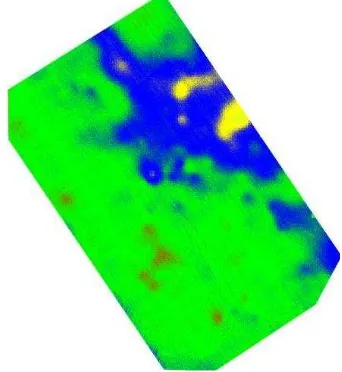
These steps were performed with commercial software ENVI (ENVI, 2013), widely used for remote sensing processing of satellite images. The NDVI computation was implemented on orthomosaic of Figure 3, at the same spatial resolution (GSD of 5 cm). The result is shown in Figure 4.
Most of the values (95%) are in the range [-0.2, 0.2], therefore coherent with typical soil values. From literature (Gholizadeh et al. 2013) is known that positive NDVI values up to 0.1 are typical of bare soils; null or slightly negative values reveal soil moisture.
Figure 4. NDVI map of bare soil computed with ENVI.
3.2 DSM and orthophotos on maize crop
As previously mentioned, in June 2015, when maize was at its maximum growth, a second survey was performed. Both cameras were used, Canon EOS for RGB images, and Tetracam ADCLite for NIR-RG images, but the processing of images obtained by the latter incurred great difficulties in matching and orientation steps. At present, only RGB orthophoto is completed.
The whole RGB data set consists of 130 images that formed an adequate photogrammetric block. Due to the recursive texture, extremely disadvantageous and to insufficient overlappings (75% along strip, 50% across) the automatic orientation procedure, performed as usual by processing the whole image data set with packages that apply algorithms of Structure from Motion (SfM), failed. Only small sub-blocks could be separately oriented, that contained images at the edges of the field, where the texture was different, or where some trees or sharp shadow contrast appeared.
In order to solve the problem, 400 tie points were manually selected on couple or triplet of images, and the computation of exterior orientation parameters was performed with photogrammetric scientific software CALGE (Forlani, 1990). The statistic of residuals on GCP (in absolute value) is shown in Table 3, where mean errors are around 40 cm, compatible with the accuracy of GCP coordinates (RTK survey on the side of the marker).
East Nord Up
Mean [m] 0.443 0.399 0.458
St.Dev. [m] 0.156 0.212 0.441
Max [m] 0.624 0.720 1.528
Table 3. Statistics of residuals on GCPs for RGB survey on maize.
The automatic processing failed also in computing the DSM, due to the difficulties in matching points search. An alternative strategy was therefore used, by interpolating the ground coordinates (obtained with CALGE) of manually selected tie points. Some outliers were rejected, keeping the points with up coordinate higher than the ground (Z > Zsoil).
Images projection on the obtained DSM was finally performed with Agisoft Photoscan, but with the exterior image orientations computed offline. The final orthophoto is shown in Figure 5. The analysis of GCP residuals, directly measured on the orthoimage gives a RMSE around 40 cm, compatible with the accuracies of block orientation.
Figure 5. RGB orthophoto on maize crop, obtained with Agisoft PhotoScan with exterior orientation parameters from CALGE.
4. CLASSIFICATION RESULTS
Finally, the data sets available for soil characterization, derived by multispectral surveys and geophysical soil sensing, were: ER maps, NDVI map on bare soil, crop height map (obtained as difference between maize crop and bare soil DSMs) and RGB orthophoto on maize field. Moreover, maize crop yield measurements were available, and they were used for the final validation.
Only the ER maps for the frequencies 15 kHz and 10 kHz were related to soil depths of agronomical interest and they were considered to delineate the SSMUs (Ortuani et al., 2016), by using the MZA software (Fridgen et al, 2004) implementing a fuzzy c-means unsupervised clustering method (Odeh et al., 1992). Three zones (i.e., a, b, c) were delineated for both cases related to the EMI data acquired in October 2014 and April 2015 (Facchi et al., 2015). Moreover, the two zonation maps were quite similar (Facchi et al., 2015).
The SSMU delineation obtained with MZA was validated through ANOVA evaluating the significant differences of crop yield across the SSMUs (Ortuani et al., 2016; Facchi et al., 2015). The ANOVA results suggested that the distinction between zones b and c had no significant effects on the crop yield.
Also the ENVI package was used to carry out the classification of the ER maps, implementing a simple unsupervised clas-sification (K-Means method),. The results were similar to those ones obtained with MZA software. The classification of the ER maps (at 10 kHz and 15 kHz) and the NDVI map on bare soil, delineated two zones, corresponding to the zones showing significant effects on the crop yield (Fig.6).
Figure 6. Classification of the ER maps and NDVI map on bare soil with ENVI.
The crop growth map, obtained as the difference between maize crop and bare soil DSMs, confirmed this subdivision (Fig.7)
Figure 7. Classification of ER and NDVI maps and crop growth map with ENVI.
On the other hand, the use of optical data only (NDVI of bare soil and crop height) resulted to be not sufficient to identify the two areas. However, other classifications have still to be performed, by using the NDVI map computed over the maize crop.
5. CONCLUSIONS
The implementation of common photogrammetric procedures, by using wide spread commercial packages, gave evidence to the difficulties that can be met in orientation of images taken over soil or vegetation, for both RGB and NIR_RG sensors. These difficulties are due to the imaged objects, with uniform and recursive pattern, and probably to sub-optimal flight configuration. Indeed, images of objects with a uniform texture make the automatic search of matching points very demanding. The problem have been partially overtaken at the cost of lowering the accuracy of the final products (though sufficient for the purpose of the survey) and increasing the processing time, with the need of manual tie point selection and of orientation refining through scientific software calculations. Geometric configuration for image block acquisition, determined with standard criteria of photogrammetric flight planning and well-assessed in previous UAV surveys, were in this case unsuitable; higher overlappings along and across tracks should be considered. New surveys (over soils, maize and other crops) are underway, that will allow to verify these hypotheses and to assesses the repeatability and the optimization of the post-processing.
Nevertheless, the results gave evidence that multispectral images acquired by UAV can be usefully integrated with ground geophysical data to obtain a proper soil characterization.
The unsupervised classifications of different stacks of data set (ER, different channels of multispectral orthoimages, crop height, radiometric indices) produced a zonation map that found a strict correspondence in maize yield, showing the potentiality of UAV surveys applied to soil characterization to support site specific techniques in precision agriculture.
ACKNOWLEDGEMENTS
This research was funded by the Department of Agricultural and Environmental Sciences of the University of Milan (UNIMI) through the Development Plan UNIMI 2014 and, partially, by the Italian Ministry of Education, Universities and Research, through the Italian Research Project of Relevant Interest (PRIN) 2010-2011, prot. 20104ALME4: “National network for monitoring, modelling, and sustainable management of erosion processes in agricultural land and hilly-mountainous area” (PI Mario Aristide Lenzi).
REFERENCES
Agisoft, 2006. Agisoft software from http://www.agisoft.com
Agüera, F., Carvajal, F., Pérez, M., 2011. Measuring sunflower nitrogen status from an unmanned aerial vehicle-based system and an on the ground device. ISPRS Archives, UAV-g 2011, 14-16 September, Zurich, Switzerland, Vol. 38(1)/C22, pp. 33-37.
Antonucci, F., Pallottino, F., Costa, C., Rimatori, V., Giorgi, S., Papetti, P., Menesatti, P., 2011. Development of a Rapid Soil Water Content Detection Technique Using Active Infrared
Thermal Methods for In-Field Applications. Sensors, 11, pp. 10114-10128.
ArcGIS, 2016. ArcGIS software from http//:www.arcgis.com
Berni, J.A.J., Zarco-Tejada, P.J., Suárez, L., Fereres, E., 2009. Thermal and narrowband multispectral Remote Sensing for vegetation monitoring from an Unmanned Aerial Vehicle. Geoscience and Remote Sensing, Vol. 47(3), pp. 722-738.
Chang, C.W., Laird, D., Mausbach, M.J., Hurburgh, C.R.Jr., 2001. Near-Infrared Reflectance Spectroscopy–Principal Components Regression Analyses of Soil Properties. Soil Sci. Soc. Am. J., 65, 480–490.
Colomina, I., Molina, P., 2014. Unmanned Aerial Systems for Photogrammetry and Remote Sensing: a review. ISPRS Journal of Photogrammetry and Remote Sensing, Vol. 92, pp. 79-97.
Corwin, D.L., Lesch, S.M., Shouse, P.J., Soppe, R., Ayars, J.E., 2003. Identifying Soil Properties that Influence Cotton Yield Using Soil Sampling Directed by Apparent Soil Electrical Conductivity. Agron. Journal, 95, pp. 352-364
Corwin, D.L., 2008. Past, Present, and Future Trends of Soil Electrical Conductivity Measurements Using Geophysical Methods. In: Allred, B.J., Daniels, J.J., Reza Eshani, M., editors. Handbook of Agricultural Geophysics. CRC Press, Taylor & Francis Group; New York, NY, USA., pp. 17–44
Dandois J.P., Olano M., Ellis E.C., 2015. Optimal Altitude, Overlap, and Weather Conditions for Computer Vision UAV Estimates of Forest Structure, Remote Sensing 7, 13895-13920.
DeBell L., Anderson K., Brazier R.E., King N., Jones L., 2015. Water resource management at catchment scales using lightweight UAVs: current capabilities and future perspectives. Journal of Unmanned Vehicle Systems 3.1 pp 1-24.
Dunford, R., Michel, K., Gagnage, M., Piegay, H., Trémelo, M.L, 2009. Potential and constraints of Unmanned Aerial Vehicle technology for the characterization of Mediterranean riparian forest. International Journal of Remote Sensing, Vol. 30(19), pp. 4915-4935
ENVI, 2013. ENVI software from http://www.exelisvis.com/ ENVIProducts
Facchi et al. 2015. Report of the Project “STeP – Sensing Technologies for Precision Agriculture”, funded by the Department of Agricultural and Environmental Sciences of the University of Milan (UNIMI) through the Development Plan UNIMI 2014.
Forlani, G., 1990. Compensazione congiunta di osservazioni geodetiche e fotogrammetriche: il programma calge e la simulazione di un esempio per cartografia a grande scala. Ricerche di Geodesia e Fotogrammetria. Vol. 8. Casa Editrice Clup. Milano.
Gholizadeh A., Boruvka L., Saberioon M., Vasat R. , 2013. Visible, near-infrared and mid-infrared spectroscopy applications for soil assessment with emphasis on soil organic matter content and quality: state of the art and key issues. Applied spectroscopy 67 (12), pp 1349-1362.
Fridgen J.L., Kitchen N.R., Sudduth K.A., Drummond S.T., Wiebold W.J., Fraisse C.W. 2004. Management zone analyst
(MZA): Software for sub-field management zone delineation. Agron. J., 96, pp. 100-108
Gini, R., Passoni, D., Pinto, L., Sona, G., 2014. Use of Unmanned Aerial Systems for multispectral survey and tree classification: a test in a park area of northern Italy. European Journal of Remote Sensing, Vol. 47, pp. 251-269.
Gomez, C., Viscarra Rossel, R.A., McBratney, A.B., 2008. Soil organic carbon prediction by hyperspectral remote sensing and field vis-NIR spectroscopy: An Australian case study. Geoderma, 146, pp. 403–411
Hunt, E.R.J., Cavigelli, M., Daugherty, C.S.T., McMurtrey, J.E., Walthall, C.L., 2005. Evaluation of digital photography from model aircraft for Remote Sensing of crop biomass and nitrogen status. Precision Agriculture, Vol. 6, pp. 359-378.
Laliberte, A. S., Goforth, M.A., Steele, C.M., Rango, A., 2011. Multispectral Remote Sensing from Unmanned Aircraft: image processing workflows and applications for rangeland environment. Remote Sensing, Vol. 3(11), pp. 2529-2551.
López-Lozano, R., Casterad, M.A., Herrero, J., 2010. Site-specific management units in a commercial maize plot delineated using very high resolution remote sensing and soil properties mapping. Computers and Electronics in Agriculture, 73, pp. 219-229
Lu, S., Ju, Z., Ren, T., Horton, R., 2009. A general approach to estimate soil water content from thermal inertia. Agricultural and. Forest Meteorology., 149, pp. 1693–1698
Maltese, A., Cammalleri, C., Ciraolo, G., D'Asaro, F., 2010. A thermal inertia model for soil water content retrieval using thermal and multispectral images. Proc. SPIE 7824, “Remote Sensing for Agriculture, Ecosystems and Hydrology XII”, 78241G.
Minacapilli, M., Cammalleri, C., Ciraolo, G., D'Asaro, F., Iovino, M., Maltese, A., 2012. Thermal Inertia Modeling for Soil Surface Water Content Estimation: A Laboratory Experiment. Soil Science Society of Amrica Journal, 76, pp. 92– 100.
Minacapilli, M., Iovino, M., Blanda, F., 2009. High resolution remote estimation of soil surface water content by a thermal inertia approach. Journal of. Hydroogy, 379, pp. 229-238
Moral, F.J., Terron, J.M., Marques da Silva, J.R., 2010. Delineation of management zones using mobile measurements of soil apparent electrical conductivity and multivariate geostatistical techniques. Soil and Tillage Research, 106, pp. 335–343
Morari, F., Castrignanò, A., Pagliarin, C., 2009. Application of multivariate geostatistics in delineating management zones within a gravelly vineyard using geo-electrical sensors. Computers and Electronics in Agriculture, 68, pp. 97–107.
Nebiker, S., Annen, A., Scherrer, M., Oesch, D., 2008. A light-weight multispectral sensor for micro UAV - Opportunities for very high resolution airborne Remote Sensing. ISPRS Archives, ISPRS Congress, 3-11 July, Beijing, China, Vol. 37/B1. pp. 1193-1199.
Odeh, I.O.A., McBratney, A.B., Chittleborough, D.J., 1992. Soil pattern recognition with fuzzy c-means: Application to
classification and soil-landform interrelationships. Soil Science Society of America Journal, 56, pp. 506-516
Ortuani B., Chiaradia E.A., Priori S., L'Abate G., Canone D., Comunian A., Giudici M., Mele M., Facchi A. 2016. Mapping soil water capacity through EMI survey to delineate site specific management units within an irrigated field. Soil Science (in press).
Photomodeler, 2012. Photomodeler scanner software from http://www.photomodeler.com
Pix4D, 2015. Pix4D software from http//:www.pix4d.com
Scudiero, E., Teatini, P., Corwin, D.L., Deiana, R., Berti, A., Morari, F., 2013. Delineation of site-specific management units in a saline region at the Venice Lagoon margin, Italy, using soil reflectance and apparent electrical conductivity. Computers and Electronics in Agriculture, 99, pp. 54-64
Tetracam, 2012. Tetracam ADCLite http://www.tetracam.com
Van Meirvenne, M., Islam, M.M., De Smedt, P., Meerschman, E., Van De Vijver, E., Saey, T., 2013. Key variables for the identification of soil management classes in the aeolian landscapes of north–west Europe. Geoderma, 199, pp. 99–105.
Viscarra Rossel, R.A., Walvoort, D.J.J., McBratney, A.B., Janik, L.J., Skjemstad, J.O., 2006. Visible, near infrared, mid infrared or combined diffuse reflectance spectroscopy for simultaneous assessment of various soil properties. Geoderma 131, pp. 59-75
Zhang, W., Wang, K., Chen, H., He, X., Zhang, J., 2012. Ancillary information improves kriging on soil organic carbon data for a typical karst peak cluster depression landscape. Journal of the Science of Food and Agricolture, 92, pp. 1094– 1102