Unmanned aerial vehicles produce high-resolution, seasonally-relevant imagery for classifying
wetland
vegetation
James V. Marcaccio, Chantel E. Markle and Patricia Chow-Fraser
Department of Biology, McMaster University, 1280 Main St. West, Hamilton, ON L8S 4K1, Canada.
J. V. Marcaccio email: [email protected], C.E. Markle email: [email protected], P. Chow-Fraser email: [email protected]
KEY WORDS: Unmanned aerial vehicle, habitat mapping, vegetation classification, wetlands, multi-rotor, mapping
ABSTRACT
With recent advances in technology, personal aerial imagery acquired with unmanned aerial vehicles (UAVs) has transformed the way ecologists can map seasonal changes in wetland habitat. Here, we use a multi-rotor (consumer quad-copter, the DJI Phantom 2 Vision+) UAV to acquire a high-resolution (< 8 cm) composite photo of a coastal wetland in summer 2014. Using validation data collected in the field, we determine if a UAV image and SWOOP (Southwestern Ontario Orthoimagery Project) image (collected in spring 2010) differ in their classification of type of dominant vegetation type and percent cover of three plant classes: submerged aquatic vegetation, floating aquatic vegetation, and emergent vegetation. The UAV imagery was more accurate than available SWOOP imagery for mapping percent cover of submergent and floating vegetation categories, but both were able to accurately determine the dominant vegetation type and percent cover of emergent vegetation. Our results underscore the value and potential for affordable UAVs (complete quad-copter system < $3,000 CAD) to revolutionize the way ecologists obtain imagery and conduct field research. In Canada, new UAV regulations make this an easy and affordable way to obtain multiple high-resolution images of small (< 1.0 km2) wetlands, or portions of larger wetlands throughout a year.
INTRODUCTION
Recent advancements in technology have opened up a new source for aerial images: unmanned aerial vehicles (UAVs), commonly referred to as drones. These systems fly without an onboard operator and are controlled remotely from the ground. While best known for their large-scale militaristic applications, small drones have become popular recreational tools whose only payload is a camera. Recreational UAVs are available in both plane and multi-rotor format, in an array of sizes and prices. The proliferation of the ‘flying camera’ market has permitted lower prices with consistent improvement in quality. One of the most important additions to UAVs has been live-feeds of video, or first person view (FPV), and global positioning systems (GPS). With these equipped, operators can view what the camera is recording in real time, while having their position maintained and corrected for in three-dimensional space.
Many potential uses of this new technology in the field of ecology are being explored, although not all have yet been attempted or brought to their full realization, especially for time-sensitive research (Rose et al., 2014). Martin et al. (2012) have brought this to light, using an artificial study identifying randomly placed and randomly covered tennis balls in the hopes that it can provide a crucial positive application to conservation. Researchers have attempted to quantify the accuracy (e.g. Chabot & Bird, 2013; Gómez-Candón et al., 2013) and savings (e.g. Brekenridge et al., 2012) of a UAV-based mapping approach. Breckenridge et al. (2012) have found that using a helicopter-style UAV for
2009). An approach with fixed-wing, plane-style UAVs has also been used, which yielded highly accurate images (Koh & Wich, 2012; Chabot & Bird, 2013). Gómez-Candón et al. (2013) used a quad-copter to produce imagery suitable for monitoring
agricultural crops. Moreover, they determined that flight paths 30 metres above ground only required a few ground-control points to maintain spatial accuracy of these images.
In addition to acquiring high-resolution imagery, UAVs can be deployed more often to meet specific research requirements. Researchers in Germany were able to accurately assess floor-level biodiversity in two forested areas by observing vegetation visible through natural or man-made forest canopy gaps (Getzin et al., 2012). With advances in three-dimensional image creation and interpretation, Lucieer et al. (2014) used UAVs to map
microtopography in Antarctic moss beds to a resolution of 2 cm. Vegetation structure in canopies can also be ascertained, and combined with the same colour imagery used to create the 3D point clouds for better remote sensing of forest vegetation (Dandois & Ellis, 2013). Even individual tree heights have been quantified with an error of less than 15% at reasonable flight heights (Zarco-Tejada et al., 2014). Collecting these types of data are next to impossible with traditional large plane or satellite platforms and these studies provide a glimpse of the possibilities for UAVs to enhance future research.
The use of UAVs in ecological research is rapidly expanding and the capability of these systems can change the way we address problems. When it comes to conservation, aerial imagery is a prerequisite to creating effective management plans. The conventional method, using sensors mounted on planes or satellites, can cost tens or hundreds of thousands of dollars depending on the region of interest (Anderson & Gaston, 2013). As well, it can be difficult to obtain imagery for a specific time of interest. For instance, satellites can only obtain photos on days when the image sensor is in line with the study area, and then these photos take time to come to market. Air photos require detailed planning and can be limited by weather and flight regulations. The "ideal" imagery may never be obtained for a study site, and consequently researchers and management agencies often have to settle for whatever imagery is available. For example, the timing of aerial imagery can limit our ability to investigate animal movement patterns and habitat use, carry out
change-detection analyses, and monitor the spread of invasive species. Without seasonal imagery to quantify seasonal habitats, especially in a dynamic wetland system, it can be difficult to improve our management and recovery strategies.
The purpose of our study is to compare the ability of UAV-derived imagery and conventional orthophotography to produce imagery that permits accurate mapping of wetland vegetation in the province of Ontario. We have chosen to use orthophotos that are generally available through the Southwestern Ontario Orthophotography Project (SWOOP), in which true colour orthophotos are acquired every four years during spring when vegetation are in leaf-off conditions. The most up-to-date images were acquired during 2010 and are usually available without additional cost to university researchers. While many studies have assessed the merits of these technologies with respect to object-based image classification (Laliberte et al., 2011; Laliberte et al., 2012; Knoth et al., 2013), we present a comparison directly between imagery and field measures. We also investigate how UAVs are used for enhanced research in ecology and in conservation.
Study Site
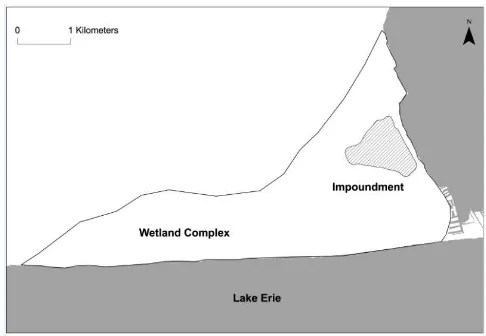
Our study took place in a 90-ha impounded wetland located within a larger wetland complex along the northern shore of Lake Erie, Ontario (Figure 1). The owner of the dyked wetland regulates water levels within the impounded area to discourage establishment of invasive emergent species like the non-native Phragmites australis australis and consequently only a few of
these are found within the impoundment. This is in striking contrast to the edge of the impoundment, which is covered with this invasive subtype. Overall, the most common emergent vegetation (EM) in this area is cattail (Typha spp.) and swamp loosestrife (Decodon verticillatus), along with a variety of floating aquatic vegetation (FL) (e.g. Nymphaea odorata, Nymphoides peltata) and submerged aquatic vegetation (SAV) (e.g.
Ultricularia spp., Potamogeton spp.). This diverse and dynamic
Figure 1: Our study took place in an impoundment (stipled) along the northern shore of Lake Erie.
MATERIALS AND METHODS Image acquisition
The conventional images used in this study are from SWOOP (South-Western Ontario Orthophotography Project, Ontario Ministry of Natural Resources). The image acquisition is a joint project between governmental agencies and local townships to capture spring imagery on a consistent annual basis (the most recent, 2010, is used here). The imagery is 20 centimetre resolution with 50 centimetre horizontal accuracy.
The UAV we used in this study was a DJI Phantom 2 Vision+ (DJI, Nanshan district, Shenzen, China), which was operated with Samsung Galaxy S3 (running Android 4.3 “Jelly Bean”) and the DJI Vision application. We kept the remote control at factory settings and flew the UAV with both S1 and S2 levers in the upright position. The UAV was operated with the lens in the 90 degrees position for the duration of the imaging process, and all images were acquired from a height of 120 m. We opted to fly the UAV manually rather than use the built-in autopilot system as the latter significantly restricted the area that could be imaged. Consequently, we were unable to obtain comprehensive coverage of the entire dyked impoundment because after changing the batteries and re-launching the UAV, it was difficult to ascertain where the previous flight path had stopped, and this led to blank spots where image acquisition was missed. We set the camera on the Phantom 2 Vision+ to take photos every 3 seconds (time lapse mode), and set the camera to auto white balance and auto
exposure with no exposure compensation. Flight speeds were maintained between 10 and 15 km/h to allow for sufficient overlap in post-processing (i.e. image stitching).
We began flights at 9:00 a.m. on 8 August 2014 and ended at noon. The UAV was operated from a small grassy patch located on the east side of the impoundment. For safe operation, no one was allowed within 30 m during take-off and landing. We completed three flights in favourable weather conditions with low winds and limited cloud cover, each lasting approximately 22 minutes in length (battery life was approximately 25 minutes of flight time). This provided sufficient coverage for the entire area (90 ha), except for the omitted portion as previously described. We processed the images in Adobe Photoshop Lightroom 5.0 (Adobe Systems Incorporated, San Jose, California, USA) using the lens-correction algorithm provided by DJI for the Vision camera. We cropped images to squares in order to remove the distortion inherent in the 140 degree fisheye Vision+ lens. No other modifications were made to the photos. We then used Microsoft ICE (Image Composite Editor; Microsoft Corporation, Redmond, Washington, USA) to stitch together the suite of photos and used the planar motion 1 option to avoid skewing and distortion. This treatment assumes that all of the photos were taken at the same angle, but may have differences in orientation or height above the ground. The mosaic was visually assessed for accuracy stitching before being used in a GIS.
Field validation data
As part of a separate study on habitat use by several species at risk, we had conducted vegetation surveys of the impounded wetland between 14 July and 14 August 2014. Using a quadrat (2m x 2m), we estimated the percent cover of each of the three aquatic vegetation groups (i.e. EM, SAV and FL). Separately, each vegetation group was assigned to one of the 6 categories: 0-10%, 11-20%, 21-40%, 41-60%, 61-80%, 81-100%. If any vegetation was present within the quadrat, we determined the dominant vegetation as that with the highest cover. In total, we collected vegetation information in this way for 176 quadrats. To permit statistical comparisons, we converted the data to three relative percent cover categories: none, < 50% cover, or > 50% cover. When percent cover was recorded as 41-60%, the result was counted as >50% if only that class existed, or another species of the same class (e.g. Typha and grasses are both emergent) was present in another category other than 0-10% so that total cover would be over 50%.
Statistical analyses
We imported GPS locations from field survey plots into ArcGIS 10.2. At each field survey site, we identified percent cover for each vegetation type (EM, SAV and FL) as well as the dominant vegetation for the UAV and SWOOP image. These data were then compiled into 3 x 3 matrices to compare percent cover results to our field data.
Matrices were created to compare each imagery source (UAV, SWOOP) to the field classification separately for each vegetation category (EM, SAV, FL and dominant vegetation). We then performed a Fisher’s exact test in R 3.1.2 (R Core Team) to complete the analyses. The Fisher’s exact test was used instead of a chi-square analysis because there were too few observations in some cells (< 5) and it provides a more robust analysis (Fisher 1964).
RESULTS
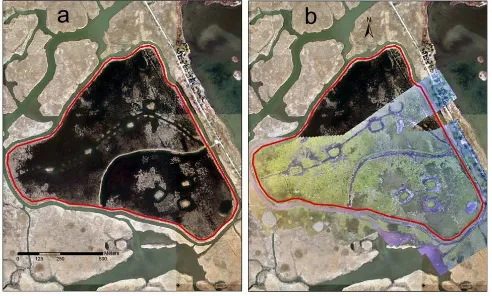
We recorded and stitched over 800 images in the Microsoft ICE software. All computations were performed on a Lenovo desktop computer (equipped with Windows 7 64-bit, Intel Core i7-4770 CPU, 12.0 GB RAM, Intel HD Graphics 4600, and a 1TB hard drive), and the entire process took approximately 6-8 hours to create a TIFF file (4.02 GB). Based on 6 ground control points, the total root mean square error for the completed image was below 5.0, and visual observations confirmed a good fit of the UAV-acquired image to the SWOOP dataset. Once geo-rectified, the image had a resolution of less than 8.0 cm/pixel as defined in ArcGIS (Figure 2).
Figure 2: a) Photo of the 2010 SWOOP image alone. b) Photo showing the UAV-acquired mosaic image on top of the 2010
SWOOP image. The red line indicates the boundary of the impoundment.
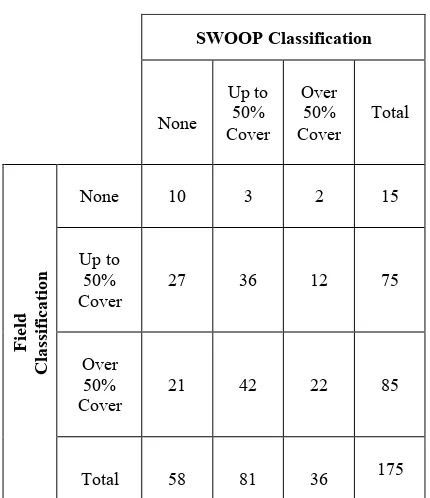
Table 3: A 3 x 3 matrix comparing the UAV classifications to the
field classifications for percent cover of submerged aquatic vegetation (p < 0.001).
Table 4: A 3 x 3 matrix comparing the SWOOP classifications to the field classifications for percent cover of submerged aquatic
vegetation (p = 1.0).
Table 6: 3 x 3 matrix comparing the UAV classifications to the field classifications for percent cover of emergent vegetation (p <
0.001).
Table 7: 3 x 3 matrix comparing the SWOOP classifications to the field classifications for percent cover of emergent vegetation
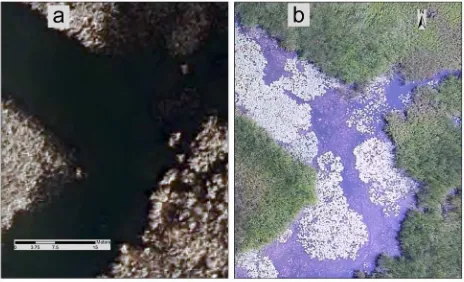
Figure 5: Comparison of a) SWOOP imagery with b)
UAV-acquired imagery. Notice details associated with the floating and submersed aquatic vegetation in (b) that is absent in (a).
DISCUSSION
Habitat mapping is an essential activity for ecologists who are interested in studying animal movement patterns and habitat use, conducting change-detection analyses, and determining the spread of invasive species. Management agencies charged with designing and recommending conservation strategies for vital wetland habitats and sensitive species rely heavily on habitat mapping. In both cases, it is customary nowadays to use the most recently available orthophotography or satellite imagery to produce these maps in a GIS, unless the research budget can accommodate new photos to be acquired concurrently with field surveys. Often, the amount of time between date of aerial-photo acquisition and field collection can be relatively long (approximately 5 years in the case of our SWOOP imagery). Where the SWOOP image is concerned, the bigger problem is that these photos were taken during spring, long before FL and SAV are fully established. This makes it very difficult to see SAV, and FL is not present which limits analysis (Figure 5). Hence, we found that presence and percent cover of both vegetation classes could not be identified correctly in the SWOOP photo. By comparison, presence of the senesced emergent vegetation (mostly Typha spp.) is still visible during spring in the SWOOP photo, and were therefore more accurately identified. Since the timing of acquisition of the UAV-based imagery was very close to that when field data were collected, we observed very accurate identification of all three vegetation classes. UAV technology can thus allow researchers to acquire aerial images of their study sites at a time in the year that is most relevant to their study objectives. When compared to aerial
imagery acquired by mounting cameras on an airplane, the UAV is also much more cost-effective. While up to $5,000 CAD would be required to map even a small area by plane, the DJI Phantom 2 Vision+, with extra batteries, case, and a tablet or phone for viewing, would cost less than $3,000 CAD. In addition, once purchased, the UAV can be flown multiple times at different sites and times for minimal maintenance costs (spare propellers, the most frequently broken part, can be obtained for $5 each). For a wetland of this size (approximately 90 ha), it would take six to eight days for all of the field work to be completed to generate a habitat map. By comparison, acquiring images with the UAV only took 3 hours. With the addition of computer processing and manual geo-rectification, the complete process takes less than two days to complete. We attempted automatic geo-rectification to reduce the time required, but the GPS accuracy on the DJI Phantom 2 Vision+ was too low for this purpose. Recently, Pix4D have released an Android application to improve mapping and geo-rectification called Pix4DMapper (Pix4D, Xuhui District, Shanghai, China), but it requires the use of their own software and can only map relatively small areas at one time (maximum 200 m by 120 m; 2.4 hectares) compared to manual flight (with sufficient overlap, approximately 20 hectares). In total, using autopilot would have garnered less than 20% of the area. As the technology develops, automatic geo-rectification will probably become possible for larger mapping expeditions.
In November 2014, Transport Canada created new rules for flying UAVs such as the quad-copter used in this study. UAVs used for research or commercial purposes cannot be flown at heights above 90 m without a Special Flight Operations Certificate (SFOC), and any observers not part of the research/commercial team must remain at least 30 m from the take-off and landing zone. Neither of these would have had a large effect on our study, as the reduced flight ceiling would have merely increased resolution and slightly increased flight times, and we ensured observers were not in the vicinity of our take-off or landing zone.
CONCLUSION
The resulting high-accuracy imagery and derived data will permit the investigators to ask questions previously limited by traditional imaging technologies. We confirmed that the UAV-acquired imagery could be used to accurately estimate the percent cover of three broad classes of wetland vegetation (submerged aquatic vegetation, floating aquatic vegetation, and emergent vegetation). By comparison, imagery from SWOOP was unable to accurately determine percent cover for submerged and floating aquatic vegetation, which comprise a large portion of the study site in the summer season.
As demonstrated, the timing of aerial imagery acquisition can limit the extent of our research. Seasonal imagery can greatly improve our mapping of dynamic wetland ecosystems and allow managers to develop more effective recovery strategies for species at risk. Acquiring images multiple times during a single season would have been prohibitively expensive with traditional large plane or satellite platforms, but with low-cost UAVs, this is no longer an obstacle. Researchers no longer need to use
commercially available imagery that are out-of-date or taken at the wrong season, and instead, learn to create their own. We hope that this study will affirm the use of UAVs in ecological research while encouraging more research into this emerging and inexpensive remote sensing platform.
ACKNOWLEDGEMENTS
We would like to thank Julia Rutledge and Rebecca Graves for their assistance in collecting the field data for this project. We also acknowledge CGS-D Scholarship to CEM from the Natural Sciences Engineering Research Council of Canada, the Species at Risk Stewardship Fund to PC-F from the Ontario Ministry of Natural Resources, and a research grant from the Sierra Club Canada Foundation.
LITERATURE CITED
Anderson, K., & Gaston, K.J. (2013). Lightweight unmanned aerial vehicles will revolutionize spatial ecology. Frontiers in Ecology and the Environment, 11(3), 138–146.
doi:10.1890/120150
Breckenridge, R.P., Dakins, M., Bunting, S., Harbour, J.L., & Lee, R.D. (2012). Using Unmanned Helicopters to Assess Vegetation Cover in Sagebrush Steppe Ecosystems. Rangeland Ecol Manage, 65(4), 362–370. doi:10.2111/REM-D-10-00031.1
Chabot, D., & Bird, D.M. (2013). Small unmanned aircraft: precise and convenient new tools for surveying wetlands. Journal of Unmanned Vehicle, 1(1), 15–24.
Dandois, J.P., & Ellis, E.C. (2013). High spatial resolution three-dimensional mapping of vegetation spectral dynamics using computer vision. Remote Sensing of Environment, 136, 259–276. doi:10.1016/j.rse.2013.04.005
Fisher, R.A. (1964). The Significance of Deviations from Expectation in a Poisson Series. Biometrics, 20(2), 265–272.
Getzin, S., Wiegand, K., & Schöning, I. (2012). Assessing biodiversity in forests using very high-resolution images and unmanned aerial vehicles. Methods in Ecology and Evolution, 3(2), 397–404. doi:10.1111/j.2041-210X.2011.00158.x
Gómez-Candón, D., De Castro, A.I., & López-Granados, F. (2013). Assessing the accuracy of mosaics from unmanned aerial vehicle (UAV) imagery for precision agriculture purposes in wheat. Precision Agriculture, 15(1), 44–56. doi:10.1007/s11119-013-9335-4
Knoth, C., Klein, B., Prinz, T., & Kleinebecker, T. (2013). Unmanned aerial vehicles as innovative remote sensing platforms for high-resolution infrared imagery to support restoration monitoring in cut-over bogs. Applied Vegetation Science, 16(3), 509–517. doi:10.1111/avsc.12024
Koh, L.P., & Wich, S.A. (2012). Dawn of drone ecology: low-cost autonomous aerial vehicles for conservation. Tropical
Conservation Science, 5(2), 121–132.
Laliberte, A.S., Browning, D.M., & Rango, A. (2012). A comparison of three feature selection methods for object-based classification of sub-decimeter resolution UltraCam-L imagery. International Journal of Applied Earth Observation and
Laliberte, A.S., Goforth, M.A., Steele, C.M., & Rango, A. (2011). Multispectral Remote Sensing from Unmanned Aircraft: Image Processing Workflows and Applications for Rangeland Environments. Remote Sensing, 3(12), 2529–2551. doi:10.3390/rs3112529
Laliberte, A.S., & Rango, A. (2009). Texture and Scale in Object-Based Analysis of Subdecimeter Resolution Unmanned Aerial Vehicle ( UAV ) Imagery. IEEE Transcations on Geoscience and Remote Sensing, 47(3), 761–770.
Lucieer, A., Turner, D., King, D.H., & Robinson, S.A. (2014). Using an Unmanned Aerial Vehicle ( UAV ) to capture micro-topography of Antarctic moss beds. International Journal of Applied Earth Observations and Geoinformation, 27, 53–62.
doi:10.1016/j.jag.2013.05.011
Martin, J., Edwards, H.H., Burgess, M.A, Percival, H.F., Fagan, D.E., Gardner, B.E., Ortega-Ortiz, J.G., Ifju, P.G., Evers, B.S., Rambo, T.J. (2012). Estimating distribution of hidden objects with drones: from tennis balls to manatees. PloS One, 7(6), e38882. doi:10.1371/journal.pone.0038882
R Core Team (2012). R: A language and environment for statistical computing. R Foundation for Statistical Computing, Vienna, Austria. ISBN 3-900051-07-0, URL http://www.R-project.org/


