URBAN DENSITY INDICES USING MEAN SHIFT-BASED UPSAMPLED ELEVATION DATA
E. Charou a *, S. Gyftakis a,c, E. Bratsolis b, c, T. Tsenoglou c, Th.D. Papadopoulou ac and N. Vassilas c
a
Institute of Informatics & Telecommunications, NCSR Demokritos 15310 Agia Paraskevi, Greece - [email protected] b
Department of Physics, National University of Athens, 15784 Athens, Greece - [email protected] c
Department of Informatics, Technological Educational Institute of Athens, 12210 Aigaleo, Greece
KEY WORDS: urban density, LiDAR, Neural Networks, classification, land management.
ABSTRACT:
Urban density is an important factor for several fields, e.g. urban design, planning and land management. Modern remote sensors deliver ample information for the estimation of specific urban land classification classes (2D indicators), and the height of urban land classification objects (3D indicators) within an Area of Interest (AOI). In this research, two of these indicators, Building Coverage Ratio (BCR) and Floor Area Ratio (FAR) are numerically and automatically derived from high-resolution airborne RGB orthophotos and LiDAR data. In the pre-processing step the low resolution elevation data are fused with the high resolution optical data through a mean-shift based discontinuity preserving smoothing algorithm. The outcome is an improved normalized digital surface model (nDSM) is an upsampled elevation data with considerable improvement regarding region filling and “straightness” of elevation discontinuities. In a following step, a Multilayer Feedforward Neural Network (MFNN) is used to classify all pixels of the AOI to building or non-building categories. For the total surface of the block and the buildings we consider the number of their pixels and the surface of the unit pixel. Comparisons of the automatically derived BCR and FAR indicators with manually derived ones shows the applicability and effectiveness of the methodology proposed.
1. INTRODUCTION
Urban density is an important factor for several fields, e.g. urban design, planning and land management. Moreover, building density affects the dispersion of atmospheric pollutants (Theodoridis and Moussiopoulos, 2000), the access of sunlight and solar radiation (Lam, 2000; Miguet and Groleau, 2002; Oke,1988; Yu et al., 2009a), the interior temperatures of buildings (Mills, 1997), the surface thermal conditions (Streutker, 2003). Kubota et al. (2008) investigated the relationship between the building density of a residential neighborhood and the average wind speed at pedestrian level. They found that by increasing the building’s coverage ratio, the wind speed decreases.
The most commonly used indices for quantifying the building density at land lot scale are the Building Coverage Ratio (BCR) and Floor Area Ratio (FAR). The BCR is defined as the ratio of the building coverage area (i.e. the area of building footprint) to the size of land lot (Eq. (1))
BCR= S/ SL equation (1)
where S is the building coverage area, and SL is the area of land lot. Once the association between building footprints and land lots is determined, the BCR for each land lot can be computed using Eq. (1). The BCR measures the building density in two-dimension (2D) space.
The FAR is defined as the ratio of gross building floor area to the size of land lot (Eq. (2))
FAR= (∑i (Hi /C) Si)/ SL equation (2)
where Hi is the height of the ith building, C is the average height of each floor and Si is the ith building coverage area. As the value of FAR is determined not only by the planimetric shape of the building, but also by the vertical distribution of the floors in different height, it depicts the three-dimensional (3D) building density. Higher FARs tend to indicate more urban (dense) construction.
The traditional method to calculate the BCR and FAR indicators is to manually survey the area to obtain the heights and shapes of all buildings. In the last years, the Light Detection and Ranging (LiDAR) technology has efficiently replace traditional topographic methods to extract information of urban buildings. The surface elevation samples from airborne LIDAR are much more accurate, reliable and denser than those from the traditional photogrammetric techniques (Paolo Gamba and Houshmand, 2000, 2002; Priestnall et al., 2000; Stilla et al., 2003). The capability of airborne LiDAR in gathering highly accurate and densely sampled surface elevation measurements over urban areas allows for an accurate delineation of the footprints of buildings (Ma, 2005; Yu et al., 2009b; Zhang et al., 2006) and reconstruction of the 3D building shapes (Forlani et al., 2006; Gamba and Houshmand, 2002; Rottensteiner, 2003). For the determination of BCR and FAR indicators the LIDAR data have been effectively combined and used with other data. Yu et al. (2010) proposed an automated derivation of urban building density information using LiDAR data and aerial color infrared imagery and an object-based method.
The objective of this work is to propose an automated methodology to estimate urban density indicators, namely BCR and FAR using LIDAR data and high resolution aerial orthophotos.
preprocessing. In Section 4 the BCR and FAR indicators are calculated and, finally, in section 5 the conclusion is drawn.
2. DATA DESCRIPTION
Our original dataset considers an Area of Interest (AOI) in the Kallithea suburb of Athens, Greece. It includes LiDAR data and aerial orthophotos in the RGB color space (Fig. 1) LiDAR data was acquired by the GeoIntelligence SA over the above area and is in the form of a Digital Surface Model (DSM), containing relative height information of man-made and natural objects rising above the ground at a spatial resolution of 1m and vertical (elevation) resolution of 20 cm. The acquisition date is 2003. A Digital Terrain Model (DTM) acquired by the GeoIntelligence SA at a spatial resolution of 2m is also available. In addition, orthophotos from color (channels Red, Green, Blue) aerial imagery acquired by the National Cadaster and Mapping Agency of Greece from the same urban region were available. The spatial resolution of orthophotos is 20 cm i.e. five and ten times higher resolution than DSM and DTM respectively. The acquisition date of the orthophotos is 2007. Both, the various resolution and different acquisition dates brings an extra challenge to the processing of our dataset towards the BCR and FAR estimation.
3. PREPROCESSING METHODOLOGY
The proposed preprocessing methodology consists of the following steps
Step1 Generation of nDSM
Initially a Nearest Neighbor interpolation was performed to increase the spatial resolution of DTM to that of the DSM (1m). Then, a normalized DSM (nDSM) was computed as the difference between DSM and DTM (Haala and Brenner, 1999). Thus the net building heights rather than the absolute elevations was obtained and it is shown in Fig. 2.
Step2 Mean shift improvement of nDSM
To upsample the nDSM, we employed a preprocessing technique described in Gyftakis et al, (2014) Based on the implicit assumption that the optical data can provide the necessary information about the significant edges of the scene, we fuse the elevation information with a high resolution ortho-photo color image of the same region. The aim is to use the high detail content of the color image as a guide for improving the quality of the elevation image. Nevertheless, the optical data also contain a great amount of unnecessary noisy edges caused by uneven painting of the terraces or objects such as solar panels. So, our problem is twofold: (a) to improve the significant elevation edges and (b) to reduce height variations, caused by noise, in areas with flat color content while ignoring small color variations in areas of small elevation variations The proposed methodology is autonomous and adaptive. It can be described as a two-step approach. First, an initial upsampling using the typical nearest neighbor interpolation technique is performed on the low resolution elevation data (nDSM) to increase its size to the size of the color image.
Next, in order to improve the quality of the result and eliminate the staircase effects of nearest neighbor upsampling near elevation discontinuities, we perform a restricted mean shift-based smoothing that selectively preserves the discontinuities
on the elevation data.
To achieve this, we modify the mean shift algorithm that was proposed by Comaniciu, and Meer (Comaniciu, and Meer,2002) Our variant of the algorithm operates, at each pixel, jointly on the optical and elevation data seeking the most prominent color and elevation values in its neighborhood. This process is iterative and once it has converged, the final values are assigned to the pixel.
The edge enhancement of the elevation data is due to the interdependency of the color and the elevation values during iterative process. At each pixel the algorithm performs a selective kernel based averaging of the elevation values in its neighborhood that is controlled by its color similarity to that of its neighbors. For example, if either the color or the elevation values of a neighbor differ considerably from the corresponding values of a pixel then this neighbor will not contribute in the computation of the elevation mean update of the pixel.
The contribution of a neighbor to the update depends on the form of the kernels used for the averaging and their spread (called the bandwidths). We have chosen all kernels to be of Gaussian form.
The bandwidths of the kernels control the degree of variability that a neighboring value is allowed to have in order to contribute to the sum. They are adapted to the local statistical characteristics of the neighborhood of each pixel. They are computed once, at the beginning of the iterative smoothing process, based on the original data. At each pixel their values are the root mean square deviation of the corresponding feature values of the pixel and those of its neighbors.
The only user provided value is the spatial bandwidth which nevertheless corresponds to actual distance value. This value defines the size of the spatial neighborhood of each pixel.
It should be noted that, at each pixel, the computation of the update value depends only on the initial range (color and elevation) and the value computed in the previous iteration for that pixel (i.e. it does not depend on the updated values of the neighboring pixels). For this reason, the update computation can be done in parallel i.e. simultaneously for all pixels. It should also be noted that, by the construction of the mean-shift the size of the update step is adaptive thus increasing the efficiency of the algorithm by avoiding oscillatory phenomena or slow convergence.
Unavoidably, however, as the iterations progress, data coupling will also cause over-smoothing of important edges. To control it we have introduced an additional constraining factor. It also has a Gaussian form and its argument depends on the color difference between a pixel and those of its neighbors in the initial image. It allows neighboring pixels with small (spurious) color variations in the original data to merge while it prevents merging when the initial color variations are larger than certain threshold. That way it counterbalances the gradual smoothing of the data values caused by the iterative process. The threshold defines the bandwidth (spread) of the kernel and depends on the direction, thus making this factor anisotropic. For each direction, formed by the center pixel and one of its neighbors, the bandwidthis the root mean square over the whole image of the color difference between pixels in the same direction.
significantly in detail and sharpness with the different elevation surfaces becoming much better discriminated.
Although the color images contained a lot of clutter and the elevation data were also noisy and of low spatial resolution, our algorithm was robust because it was able to automatically adapt its parameters to the local data values. It should be noted that extract the buildings. If the base building height H0 is too high, many true buildings will be missed. On the other hand, if the selected base building height H0 is too low, some small non-building objects like automobiles will be detected as non-buildings. Different threshold values have been chosen to extract building objects in previous studies, e.g., 3 m in Ma (2005), 3.5m in Yu et al (2010) and 4 m in Yu et al., 2009a and Yu et al., 2009b. After experimenting with different threshold values we chose 3 m as the threshold value for our case study.
Step 4 Automatic classification in Building- Non Buildings According to our previous investigation (Bratsolis et al, 2013, Gyftakis et al, 2014) automatic segmentation in Buildings-Non Buildings could be efficiently performed when using Multilayer Feedforward Neural Network (MFNN). The input layer of the MFNN consists of four nodes: 3 nodes for the 3 channels (Red, Green, and Blue) of the orthophoto and one node for values of the Mean-Shifted and thresholded nDSM. All values were normalized in the same range [0, 255]. The MFNN was trained with the Levenberg-Marquardt algorithm (Haykin, 1994). Following experimentation with several architectures we eventually selected a network with two hidden layers of 50 and 10 neurons respectively. A training phase of less than 30 epochs was enough for convergence of the classifier. The training process was designed to avoid overtraining. Overtraining is a well-known problem in neural network training and is due to a high tuning of the ANNs on the examples of the training set, usually resulting to poor generalization. To alleviate this problem, the data set is split into a training set and a validation set. While the training set is used to train the networks, the validation) along with their correct classification and have been extracted from a different region of Kallithea suburb by specifying small polygons representing the two classes: buildings and non-buildings. Following training, test results have been obtained regarding the central urban block (including patio pixels in the middle of the block).
The corresponding prototype building block mask to which the results were compared is shown in Fig. 5 and the overall image area from which we assess classification accuracy for is an inflated (dilated by a few pixels) version of the minimum area bounding rectangle around the central building block as shown in Fig. 4.
In the classification results the buildings are shown as white and non-buildings as black pixels (Fig 6). For the evaluation the classification results were compared with the prototype mask of Fig. 5 through statistical measures. Results proved very accurate with Kappa coefficient 0.8060 and Overall Accuracy 90.83%.
4 BCR AND FAR ESTIMATION
The BCR and FAR indicators for the whole AOI were calculated based on the automatically segmented AOI in Buildings –Non Buildings. The Eq (1) and Eq (2) were used, assuming a value of C = 3m for the average height of each floor. For the total surface of the block and the buildings we consider the number of their pixels and the surface of the unit pixel. The BCR and FAR values resulted are shown in Table1, 1st column. For the evaluation reasons, an experiment was contacted in a smaller, test area. The test area was extracted from the AOI using the binary mask of Fig. 4. For this test area, both, the manually segmented (Fig 5) and the automatically segmented in Buildings Non Buildings are available and used for the BCR and FAR indicators numerical calculation.
As it is shown in Table 1, the values of BCR and FAR when calculated based on the manually segmented test area (Table 1, 2nd column) are very close to the ones derived when the automatically segmented test area is considered (Table 1, 3rd column) This encourages as to use this automated method to calculate the BCR and FAR in the whole area of Interest.
Building
Table1. BCR and FAR indicators on AOI and test area.
5 CONCLUSION
The main contribution of this work is the development of an accurate and automatic data processing method to estimate the BCR and FAR urban density indicators. The approach is based on a combination of a variant of the mean shift algorithm and a neural network based classification.
The input data comprised of low resolution Lidar data and high resolution optical (RGB) data. Our approach efficiently combined the two data types resulting in an edge-preserving smoothing of the elevation image. We showed this to be especially beneficial for the separation of Buildings using a Multilayer Feed Forward Neural classifier. Comparisons of the BCR and FAR indicators with ground truth values on a test area shows the efficiency of our methodology and encourages us for the expansion of the methodology to other Building Density indicators.
ACKNOWLEDGMENT
Fig. 1 Orthophoto RGB image of the AOI.
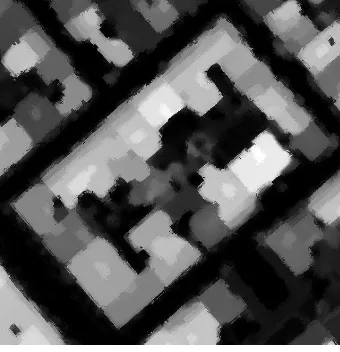
Fig. 2 The nDSM elevation data of the AOI.
Fig. 3 The Mean-Shift preprocessed nDSM
Fig. 4 Test area binary mask.
Fig. 5 Test area with Buildings manually identified
REFERENCES
Bratsolis, E., Gyftakis, S., Charou, E., and Vassilas, N., Comparative analysis of classification techniques for building block extraction using aerial imagery and LiDAR data. Proc. 13th IEEE International Symposium on Signal Processing and Information Technology (ISSPIT 2013), 80-85 (2013).
Comaniciu, D., and Meer, P. Mean shift: A robust approach toward feature space analysis, IEEE Transactions on Pattern Analysis and Machine Intelligence, 24(5), pp. 603–619, 2002. Forlani, G., Nardinocchi, C., Scaioni, M., Zingaretti, P., 2006. Complete classification of raw LIDAR data and 3D reconstruction of buildings. Pattern Anal. Appl. 8 (4),357–374. Gamba, P., Houshmand, B., 2000. Digital surface models and building extraction: a comparison of IFSAR and LIDAR data. IEEE Trans. Geosci. Remote Sens. 38 (4), 1959–1968.
Gamba, P., Houshmand, B., 2002. Joint analysis of SAR, LIDAR and aerial imagery for simultaneous extraction of land cover, DTM and 3D shape of buildings. Int. J. Remote Sens. 23 (20), 4439–4450.
Gyftakis, S., Tsenoglou. T., Bratsolis, E., Charou, E., Vassilas, N., Fusion of aerial images with mean shift-based upsampled elevation data for improved building block classification, SPIE Remote Sensing, Amsterdam, Netherlands, 22/09/2014, Eds: Lorenzo Bruzzone, Proc. of SPIE, v. Vol. 9244 , pp. 1-10. Haala, N., Brenner, C., 1999. Extraction of buildings and trees in urban environments.ISPRS-J. Photogram. Remote Sens. 54 (2–3), 130–137.
Haykin, S., Neural Networks: A Comprehensive Foundation, Macmillan, New York, (1994).
Kubota, T., Miura, M., Tominaga, Y., Mochida, A., 2008. Wind tunnel tests on the relationship between building density and pedestrian-level wind velocity: development of guidelines for realizing acceptable wind environment in residential neighborhoods. Build. Environ. 43 (10), 1699–1708.
Lam, J.C., 2000. Shading effects due to nearby buildings and energy implications Energy Conv. Manag. 41 (7), 647–659. Ma, R.J., 2005.DEMgeneration and building detection from Lidar data. Photogramm. Eng. Remote Sens. 71 (7), 847–854. Miguet, F., Groleau, D., 2002. A daylight simulation tool for urban and architectural spaces – application to transmitted direct and diffuse light through glazing.Build. Environ. 37 (8– 9), 833–843.
Mills, G., 1997. Building density and interior building temperatures: a physical modeling experiment. Phys. Geogr. 18 (3), 195–214.
Oke, T.R., 1988. Street design and urban canopy layer climate. Energy Build. 11 (2),103–113.
Priestnall, G., Jaafar, J., Duncan, A., 2000. Extracting urban features from LiDAR digital surface models. Comput. Environ. Urban Syst. 24 (2), 65–78.
Rottensteiner, F., 2003. Automatic generation of high-quality building models from Lidar data. IEEE Comput. Graph. Appl. 23 (6), 42–50.
Stilla, U., Soergel, U., Thoennessen, U., 2003. Potential and limits of InSAR data for building reconstruction in built-up areas. ISPRS-J. Photogram. Remote Sens. 58 (1–2), 113–123 Strauker D. R. 2003, Satellite-measured growth of the urban heat island of Houston, .Texas Remote Sens. Environ. 85 (3), 282–289.
Theodoridis, G., Moussiopoulos, N., 2000. Influence of building density and roof shape on the wind and dispersion characteristics in an urban area: a numerical study. Environ. Monit. Assess. 65 (1–2), 407–415.
Yu, B., Liu, H., Wu, J., Lin, W.-M., 2009a. Investigating impacts of urban morphology on spatio-temporal variations of solar radiation with airborne LiDAR data and a solar flux
model: a case study of downtown Houston. Int. J. Remote Sens. 30(17), 4359–4385.
Yu, B., Liu, H., Zhang, L., Wu, J., 2009b. An object-based two-stage method for a detailed classification of urban landscape components by integrating airborne LiDAR and color infrared image data: a case study of downtown Houston. In: Paper presented at the 2009 Joint Urban Remote Sensing Event, Shanghai.
Yu, B., Liu, H., Wu, J., Hu, Y., Zhang, L. 2010. Automated derivation of urban building density information using airborne LiDAR data and object-based method. Landscape and Urban Planning, 98, pp. 210–219