DEVELOPMENT OF A SERVICE ORIENTED ARCHITECTURE BASED GEOGRAPHIC
INFORMATION SYSTEM IN EARTH SCIENCES
G. Toz a , A. Dogru b, *
a ITU, Civil Engineering Faculty, 34469 Maslak Istanbul, Turkey - [email protected] b
Bogazici University, Kandilli Observatory and Earthquake Research Institute, Geodesy Department, 34680 Cengelkoy Istanbul, Turkey - [email protected]
KEY WORDS: Earth crust deformation, Geodesy, Geographic information system, Service-oriented architecture
ABSTRACT:
The studies of recent crustal movements are based on analyses of repeated geodetic measurements, and their combination with results of geophysical and geological investigations. It is obvious that a single data producer can not produce useful datasets and
information without integrating data from others because one scientist’s results become another’s data. So, the problem to be solved naturally has an interdisciplinary character. However, Earth scientists traditionally work on one aspect of the problem and they have a tradition of sharing of data but they are willing to share it if asked. Because of this, the resources are being wasted in duplicative efforts. However, the goal is for data to evolve it into information, and then into knowledge as quickly and effectively as possible. In order to do this, calculations and analysis need to bring to the desktops of researchers, decision-makers, and educators. The aim of this study is to develop a service-oriented architecture (SOA) based Geographic Information System (GIS) that enables linking and sharing multidisciplinary Earth science data, tools, and software and to provide a wide range of users access to the system and in this way to build an easy-to-use interactive access to data and analysis environment to study earthquakes in Turkey.
1. INTRODUCTION
1.1 Geosciences and Information Technology
Earth sciences (a.k.a. Geosciences), is a term for the sciences related to the Earth. While data and compute-intensive nature of this discipline makes reaching results difficult, there are still duplicative efforts on data collection, conversion, reformatting and tool development which cause waste of labour and time. Therefore, building mechanisms which are capable to share these data and tools is the key for the next generation of Earth science research. These platforms include databases, networks, visualization, analytical tools, computational resources, and so on. There are a lot of efforts such as data collection from field observations and sensors, database creation, software development, data integration, and data management. Moreover, each of them has its own various problems. The need is to provide access to all of existing resources and support interoperability among them by using information technologies. Today, there are an increasing number of applications using spatial data on the Web benefiting from such technologies. Some of them are Earth sciences applications including GIS and web-mapping implementations from major institutions in the world such as US Geological Survey, Geosciences Network, and the Incorporated Research Institutions for Seismology, and European-Mediterranean Seismological Centre. They have capabilities and limitations, too. In general, applications include interactive maps showing location of the earthquakes, seismicity of the region, seismic hazard and earthquake density, GPS sites, their displacement history and also some geophysical data. Most of these applications are for earthquake monitoring.
Turkey is an earthquake country. 96 percent of the land containing 66 percent of the active faults is affected by earthquake hazards and 98 percent of the population lives in these regions. North Anatolian Fault Zone of Turkey is a natural
laboratory for Earth scientists where various tectonic landforms exist. Particularly on the western part of it, a lot of geodetic projects have performed for monitoring crustal movements over three decades. There are an increasing number of data inferred from these tectonic studies. In order to avoid repeated efforts and to analyze these data rapidly, use of information technology is necessary. GIS is one of the information technology tools to accomplish such comprehensive studies and solving complex problems in Earth sciences. Clearly, GIS provides a convenient platform for data collection, organization, and research with multidisciplinary data sets. As more groups adopt GIS applications, the earth sciences community will be in a position to prepare a unified global database for more efficient, productive, and rewarding research [1].
The other one can be the implementation of Service Oriented Architecture (SOA) in the Web environments (Web services) for Earth science applications that increases the speed of the scientific discovery process. A Web service can be defined that a programmable application which is accessible using standard Internet protocols. Web services can be any piece of code that is available over the Internet and they can be written in any language. Reuse of existing tools, lower cost of maintenance and reduced impact of change are the most important benefits of Web services. The application of this study is built in a service-oriented architecture for reusability and interoperability of its components.
1.2 System Overview
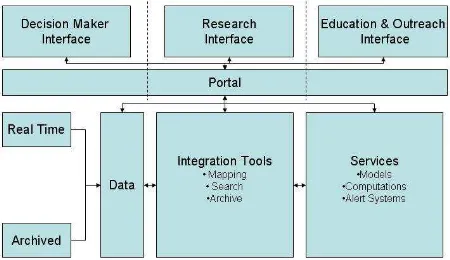
The scope of the study covers obtaining and processing Earth science data and tools, and integrating in a GIS environment using information technologies, and then transmitting to the users via the Internet. Figure 1 displays the architecture of the system design.
Figure 1. System design
This study is divided into short-term and long-term objectives. The short-term objective is to develop a prototype system that is capable of being expanded to a larger system that links multiple datasets and tools. The long-term objective is to extend the prototype system and develop more Web services and portal framework for efficient access to data and tools. In this study, geodetic and geophysical data, software packages and scientific applications were compiled and a system has been developed. There had been two primary aims in this development. The first is to create a tool as part of the system services which will compute strain by geodetic GPS velocities and earthquake focal mechanisms data. The second is to make the users retrieve maps on the Internet, which is one of the realizations of integration tools of the system design. The study combines two software programs ArcIMS [2] and GMT [3] with FORTRAN programs in ASP.NET environment.
In this study, the developed system brings the complex strain analysis procedure developed by [4] and [5] to a level that can be used by anyone efficiently and effectively using Web services approach. The calculation process of strain programs and the other codes created during this study is pretty much complex. There are over 30 programs to be able to use mentioned method and to see the results obtained. Some modifications were done to increase portability and IO performance. There were a number of places where the codes require user interaction by entering some input parameters using command line. These codes were removed, and input parameters were arranged to be entered from the graphical user interface. FORTRAN codes were compiled in Windows OS and performed batch file scripting to run all programs as one program. Creating Web service and connecting the application to ArcIMS were the next steps of the study.
ArcIMS is an internet mapping software. It brings GIS to the Web by providing the ability to generate maps on the fly and also integrate data from different sources for display, query, and analysis. Interactive maps served with ArcIMS include maps with layers that can be turned on and off, or with features containing attributes that can be queried. A web browser is just needed by the user, and the database is maintained on the server side. ArcIMS uses ArcXML to receive and respond to requests from the client. ArcIMS needs a Web server that can be extended to run Java code. Apache Web Server was used in the implementation. ArcIMS installation also needs a servlet engine installation. Servlet engines extend Web servers with a common API and allow them to process Java code. J2SDK was also installed in a Windows Server 2003 machine for ArcIMS. GMT is a visualization tool widely used in the Earth science. GMT is
an open source collection of about 60 UNIX tools, which was developed by the School of Ocean and Earth Science and Technology (SOEST) of University of Hawaii. It allows users to manipulate datasets and produce images.
2. CODE DEVELOPMENT
2.1 Computational Background
In the study, there are two types of geospatial data: geodetic
velocities provided by GPS and earthquakes’ focal mechanisms.
A file-based database is used in the study. There are three input files to run the algorithm for strain calculation. They are ASCII files which have columns and rows. Columns have fixed-width data formatting and the files do not include header lines. The two files are the data files and the other one is the geometry file. There is no relationship or link between these files. Geometry file is semi-static. It is modelled considering Turkey’s active faults, tectonic settings and seismicity. Users can create a new file based on the default geometry file changing the grid size of the algorithm. Focal mechanisms file includes all records (since 1976) for entire Turkey. A user by selecting area using latitude and longitude boxes on the interface can create a new focal mechanisms file. And the GPS file can be uploaded by the user to the system using web interface. Though the system is uses a static GPS file in its current form. Users can perform the inversion using only focal mechanisms data or only GPS data or both together. Then the output files are reformatted and image files are created by reading each line of these files. First request by the user creates a directory with unique id using time, then the input files, exe files which run the strain calculation algorithm and all output files are stored in that directory. For a selected 0.5 degree grid size, 2500 image files (each 1 kb in size) are stored in the directory to be used as layers of ArcXML file.
2.2 Data for Input Files
GPS velocity data are related to Marmara region of the country which involves strike slip faulting. The area has a high seismic
hazard and risk because of the region’s tectonics. GPS data
consists of the information related to 65 GPS points including longitude and latitude values, eastward velocities, northward velocities, uncertainties of eastward velocities, uncertainties of northward velocities, and correlation between eastward and northward components. A program written in C language, which assigns number of rotation values to the GPS points was used for the creation of the GPS input file. 65 GPS velocities come from GPS campaigns performed between the years of 2003 and 2005 in Marmara region by Geodesy Department of Kandilli Observatory and Earthquake Research Institute of Bogazici University (BU). These campaigns were performed by a collaborative project among BU, MIT (Massachusetts Institute of Technology), TUBITAK-MRC (Turkish Scientific and Technological Research Council - Marmara Research Center), GCM (General Command of Mapping), and ITU (Istanbul Technical University).
A focal mechanism solution is the result of an analysis of
waveforms generated by an earthquake. An earthquake’s focal
mechanism provides important information, including the origin time, epicenter location, focal depth, seismic moment, and the magnitude and spatial orientation of the moment tensor. Earthquake focal mechanisms data is provided by Global Seismology Centroid Moment Tensor catalog. This catalog
contains solutions for events with magnitude about and greater than 5.5. There are 275 earthquakes (M0<1*1020) for the study area and the August 17 earthquake was excluded since it decreases the strain rates. Thus earthquakes input file includes 274 earthquakes in a time interval of 30 years. For the creation of the earthquake focal mechanisms input file, a Java program was created and these data updated periodically in the application. Global CMT catalog uses cm unit. 1 dyne-centimeter is equal to 1E-007 Newton-meter. Sparse coordinate system for moment tensor components is different from this catalog and also from [6]. Therefore conversion is needed for both notation and direction of the axis (mxx= mpp, myy= mtt, mxy=-mtp).
2.3 Strain Algorithm
Strain is relative movement of the points on the Earth’s surface and caused by continental plate movement.
In two dimension, two lines form the axes of the strain ellipse. The principal axes of strain
1 and
2 are given by: rate and velocity model, is followed to carry out this research. A comprehensive overview of the methodology can be found in rectangular grid using bi-cubic spline interpolation. These values are obtained from least-squares inversion between observed and predicted values of strain rate and velocity. Depending on the data distribution on the study region, smoothing between neighbouring grid cells is required. No smoothing takes no account of how the strain rates are distributed in neighbouring rectangles, in which the strain rates may be significantly higher or lower. In the case of seismic data inversion, strain rates are estimated from Kostrov summation [7]: the earthquake record, M0 is the scalar seismic moment, and mij is the unit moment tensor. Shear modulus is taken as estimated strain rates. Programs to calculate strain rate consist of over 20 open source FORTRAN programs which run on Linux operating system. Content of the input files vary depending on the inversion type, selected area and data used. Creation of these files which may contain over hundreds of lines requires programming. These initial files include data pertaining to geometry, earthquakes and GPS. In addition, programs need some other input files which created during the run process. The geometry file is to create a rectangular grid for the area of interest. A sample of the content of the geometry file is as follows: which each grid area is in 0.5x0.5 degree size (50 grids between 20 < longitude (E) (X) < 45 and 30 grids between 30 < latitude (N) (Y) < 45). So the total number of grid areas is 1500 and the number of deforming grid areas is 1081. In other definition, the total number of knot points is 1581 and the number of deformation points is 1053. The results are velocities at 1581 points and strain rates at 1081 points. The number of rigid blocks is 3, and it is assumed that rigid plates are not deforming. 34 grids cover AR rigid block, 135 grids cover AF rigid block, and 250 grids cover EU rigid block in the study (Figure 2).Figure 2. Grid geometry for the study area with known active faults of the region
The extent of the rigid blocks is based on the seismicity [8], [9], [10]. Strain programs assigns “rotation value numbers” in a
specific order to the deformation points. The geometry file consists 3,163 lines in case of 0.5x0.5 degree size grid area for the study area so that a program was written to create this geometry data file automatically. In order to inverse GPS data with seismic constraint (seismic style and direction) to obtain strain rates and velocity field, two files, one from seismic inversion and the other from GPS inversion, needed to be combined. In order to be able to do that, a Java program was written. Strain programs give output files as ASCII files, as well. For instance, in order to draw velocity error ellipses, the diagonal values in the variance-covariance matrices from strain programs must be used (following some mathematical calculation). The first and second values in the diagonal of the matrices are the standard errors of east and north velocities, and the third one is correlation coefficient. And this has to be done for each of inversions. A sample of variance-covariance matrices obtained from strain programs is as follows:
no. 1 LAT.= 30.00000 LONG.= 20.00000 0.65244146E-01 -0.35264134E-01 0.24350502E+00 -0.35264134E-01 0.65459771E-01 -0.37096604E+00 0.24350502E+00 -0.37096604E+00 0.28188015E+01 For analyzing output files as a whole and getting the strain and velocity results, visualization of these files are absolutely needed. In order to do this, GMT program was used. Nevertheless, GMT requires input files in a specific form (for strain crosses, input file columns must include respectively long, lat, eps1, eps2, azimuth of eps2 values - for velocity arrows and ellipses, columns must include long, lat, eastward velocity, northward velocity, uncertainty of eastward velocity, uncertainty of northward velocity, correlation between eastward and northward components, station name) to visualize ASCII outputs. Therefore a program was written for converting matrix form data to one line form. As it can be seen here, the creation of IO files is pretty much complex. There are over 30 programs to be able to use this method and to see the results obtained. In order to shorten the time for obtaining results and speeding up the scientific discovery, all of these programs are wrapped as Web services. Thus, it prevents redundancy of development efforts.
3. USER INTERFACE
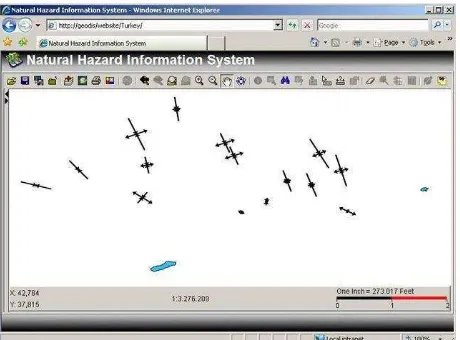
Easiness is targeted in the design of the user interface. The user interface was developed using ASP.NET as shown in Figure 3. ASP.NET is used to create Web pages and Web services. ASP.NET provides developers easy programming environment and makes exposing and calling XML Web Services simple. The interface has many functions including a brief information part about the system, frequently asked questions section where the users of the system can find descriptions of terms and additional information, a newsletter section which is a periodic publication of system related news, a messaging part for communication among users, and a contact information page for
the user feedback and inquiries. Archive section is for users’
application history storage and search.
Figure 3. Web interface
Users are able to select a region by latitude/longitude boxes and specify the grid size, then compute strain rates using inversion Web services. The methods created in this web services can be used by any application on the Internet. After entering the parameters, each request is given a unique id number according to the time the request arrived at the web server. Then input files are created and stored in the workspace. The application runs the programs and output files are created. GMT is executed for each line in those files including strain and velocity information. GFW (world files for gif images) files are created for georeferencing strain and velocity images in ArcIMS environment. Batch files which run GMT creates PS files. Then ImageMagick [11] program converts PS (postscript) files to GIF (Graphics Interchange Format) files. ImageMagick is free software to create, edit, and compose bitmap images from the command line. In order to create a service in ArcIMS, a map configuration file (with axl extension) must be created first. The map configuration file is a text file that stores information about map design. This file is written in ArcXML, which is an XML used specifically for creating Web-based products. ArcIMS Author is for creating AXL file, the Administrator creates and starts ArcIMS Services, and the Designer is for creating the look of the web site. In the application for each request,
ArcIMS’s ArcXML file is created and GIF images are embedded into ArcXML file as a layer (Figure 4). ESRI.ArcIMS.Server.dll is to provide a connection between the client and ArcIMS Application Server.
Figure 4. Output map showing strain crosses
4. CONCLUSION AND FUTURE DIRECTIONS
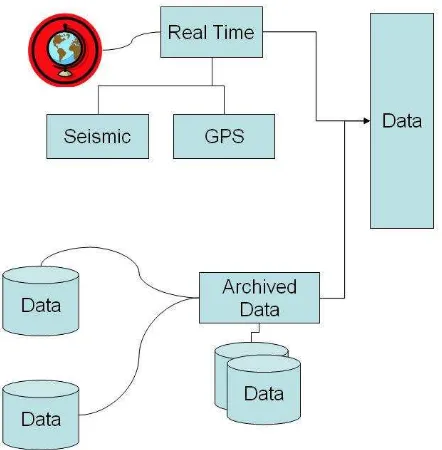
GPS data from various sources can be currently uploaded into the system. Since the study is an open-end one, any kind of data, which contributes valuable information, can be added into the system. As new datasets are being added, new applications become possible. This development model can generate many innovative applications. The integration of real-time GPS data from continuous GPS stations will be studied in the scope of the future applications (Figure 5).
Figure 5. Current and future data streaming to the system
Service-oriented architecture of the application allows its components to be used by other applications and users over the Internet. Since reusability of components was provided, it minimized the need for new coding. Its infrastructure is ready to be used for other applications in Earth science. There is a need for bridging between Earth science and Computer science. Earth sciences need information technologies to solve data related problems.
REFERENCES
1. Seber, D., Vallve, M., Sandvol, E., Steer, D., Barazangi, M., 1997. Middle East Tectonics: Applications of Geographic Information Systems (GIS), GSA Today, 7, No. 2, February.
2. Environmental Systems Research Institute, Inc. (ESRI), Computer Software, 380 New York Street, Redlands, CA 92373-8100, USA.
3. Wessel, P., and W. H. F. Smith, 2001, The Generic Mapping Tools (GMT) version 3.4 Technical Reference & Cookbook, SOEST/NOAA.
4. Haines, A.J. and Holt, W.E., 1993. A procedure to obtain the complete horizontal motions within zones of distributed deformation from the inversion of strain rate data, Journal of Geophysical Research, 98, 12,057-12,082.
5. Haines, A.J., Jackson, J.A., Holt, W.E., Agnew, D.C., 1998. Representing distributed deformation by
continuous velocity fields, Institute of Geological and Nuclear Sciences science report, 98/5, Wellington, New Zealand.
6. Aki, K. And Richards P. G. , 2002. Quantitative Seismology, University Science Books, New York, USA.
7. Kostrov, V.V., 1974. Seismic Moment and Energy of Earthquakes, and Seismic Flow of Rocks, Izv Acad. Sci., USSR, Phys, Solid Earth, English Translation, 1, 23-44.
8. Ambraseys, N.N. and Finkel, C.F., 1995. The Seismicity of Turkey and Adjacent Areas, A Historical Review, 1500-1800, Eren, Istanbul, Turkey.
9. Global CMT Catalog, 2006. Global Centroid Moment Tensor Project, May 2006,
<http://www.globalcmt.org/>.
10. KOERI NEMC, 2006. Bogazici University, Kandilli Observatory and Earthquake Research Institute, National Earthquake Monitoring Center Home Page, February 2007,
<http://www.koeri.boun.edu.tr/sismo>. 11. ImageMagick, 2007. ImageMagick Home Page,
February 2007, <http://www.imagemagick.org>.