VHRS STEREO IMAGES FOR 3D MODELLING OF BUILDINGS
A. Bujakiewicz *, M. Holc
Department of Photogrammetry, Remote Sensing and Spatial Information Systems, Faculty of Geodesy and Cartography Warsaw University of Technology, Plac Politechniki 1, Warsaw, Poland
abujak7@wp.pl, malgota@wp.pl
Commission IV/3
KEY WORDS: Orientation, Extraction, Modelling, High Resolution, Ikonos
ABSTRACT:
The paper presents the project which was carried out in the Photogrammetric Laboratory of Warsaw University of Technology. The experiment is concerned with the extraction of 3D vector data for buildings creation from 3D photogrammetric model based on the Ikonos stereo images. The model was reconstructed with photogrammetric workstation - Summit Evolution combined with ArcGIS 3D platform. Accuracy of 3D model was significantly improved by use for orientation of pair of satellite images the stereo measured tie points distributed uniformly around the model area in addition to 5 control points. The RMS for model reconstructed on base of the RPC coefficients only were 16,6 m, 2,7 m and 47,4 m, for X, Y and Z coordinates, respectively. By addition of 5 control points the RMS were improved to 0,7 m, 0,7 m 1,0 m, where the best results were achieved when RMS were estimated from deviations in 17 check points (with 5 control points)and amounted to 0,4 m, 0,5 m and 0,6 m, for X, Y, and Z respectively. The extracted 3D vector data for buildings were integrated with 2D data of the ground footprints and afterwards they were used for 3D modelling of buildings in Google SketchUp software. The final results were compared with the reference data obtained from other sources. It was found that the shape of buildings (in concern to the number of details) had been reconstructed on level of LoD1, when the accuracy of these models corresponded to the level of LoD2.
1. INTRODUCTION
In the last decade the Very High Resolution Satellite images have proved to be very useful for generation of cartographic products. The popular satellite orthomaps are usually used for mono plotting of 2D vector data. The accuracy of such data is compatible with the accuracy of middle scale aerial photography, however their content is reduced and the object elevations can not be determined. The procedure of image orientation can be performed in various environments, for example PCI Geomatica. This software applies the RPC coefficients together with a number of control points measured on each image separately. Development of stereo digitalization modules of photogrammetric digital workstations has made possible to execute the stereoscopic measurement of data and therefore to increase orientation accuracy of VHRS stereo pair images. Consequently it is possible to acquire 3D products, such as DSM/ DTM and vector data for buildings reconstruction and modelling (Eisenbeiss and others, 2004; Toutin,2004a,b; Kaczynski and others, 2004; Zhang, Fraser, 2008). In general, according to (Kolbe and others, 2005), 3D models of buildings can be reconstructed in respect to five levels of details (LoD)
defined in CityGML scale, due to their accuracy and details’
description. In research published by (Ulm, 2003; Kocaman and others, 2006), it has been found that 3D building models from stereo satellite VHRS imagery with 0.5 – 1.0 meter resolution, such as QuickBird or Ikonos-2, can be reconstructed with standards of LoD1 – LoD2. In case of buildings reconstruction on level LoD1, a simple shape of block models with flat roofs and the accuracy of 5 meter in horizontal (XY) and vertical (Z) positions, are required. For level of LoD2, the texture model with real shape of roofs and accuracy of 2 meters for XY and 1 meter for Z, are requested.
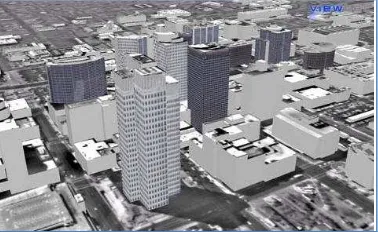
In research carried out by (Kocaman and others, 2006), the specific difficulty for recognition of roofs types and their small features, was found. The example of area with 3D building models reconstructed from the QuickBird images with the CC-Modeler is shown in figure 1.
Fig. 1 3D city model from QuickBird images reconstructed by the CC-Modeler (Kocaman and others, 2006)
2. PRINCIPLES OF THE APPLIED APPROACH
identified control points which were measured on image in mono mode. The stereo approach, applied in photogrammetric digital workstations, allows to increase the orientation accuracy of satellite images, by including in this process some stereo measured tie points (of any type including poorly identified) in addition to a very few control points with known field location (Holc, 2011). When the suitable number of tie points is uniformly distributed around 3D photogrammetric model then the required control points (surveyed in field) would be significantly reduced. In such case not only the accuracy of exterior orientation of imagery is increased but also a load of field work is much decreased. The most important advantage of using a photogrammetric digital workstation is a possibility to generate a 3D model and measure all specific spatial vector data for each building within the area, in process of stereo- digitization. When the photogrammetric system, such as Summit Evolution, is on-line integrated with 3D GIS platform, such as ArcGIS (ArcMap module), then all measured feature data are directly transferred to the selected layers of GIS database and supplemented with the attributes acquired from photographs or some other sources [Bujakiewicz, Preuss, 2010]. Such data subsequently can serve for 3D modelling of buildings and visualization. Direct connection of the measuring photogrammetric system with 3D data base allows also to superimpose all available data which are archived in this base, such as ground footprints from the cadastral files or from orthophoto, to the photogrammetric model generated from VHRS images. This is helpful not only for stereo-digitization of the new 3D vector product but also to control and update the existing data. However, in any stereo photogrammetric system, the accuracy of measurement and recognition and discrimination of object’ features depend on type and resolution of source images. As it was investigated in some earlier research, concerning processing of data from VHRS images, the accuracy of features measurement can be assumed due to standard of LoD2, but recognition and discrimination of some features qualify such 3D models rather to level LoD1.
3. PRESENTATION AND ANALYSIS OF RESULTS
In the experiment, two stereo IKONOS-2 panchromatic images of one of the Cracow city districts were used. They were acquired by the Satellite Center of Regional Operations (SCOR) in Komorow, Poland in May 2005, with time interval of 1 minute. The stereo images used in this experiment had been reprocessed by the cubic convolution resampling, due to spatial and radiometric resolution. The images were delivered with RPC coefficients and file of metadata with all detailed information. The part of Cracow area selected for photogrammetric stereo compilation is shown in figure 2.
Fig. 2 Area of Cracow city selected for compilation (maps.google.pl)
To support exterior orientation and for the final accuracy evaluation, some well identified man-made control and check points were surveyed in field. The example of such type of point is shown in figure 3.
Fig. 3 Image location of one of control point
Other data available for the purpose of this project were: terrain elevation data - DTED Level 2 (in NATO standard format) and digital orthophoto from midle scale photography, which was used for mono plotting of building basements and consequently served as the reference data.
Process of exterior orientation of two Ikonos images and their stereo compilation were carried out on the photogrammetric system Summit Evolution combined with ArcGIS, which accepts the Ikonos imagery and their corresponding RPC coefficients. The wide range of the Summit Evolution projects (depending on various input data) is shown in the figure 4.
Fig. 4 Window of Summit Evolution showing the possible input data (Manual of Summit Evolution)
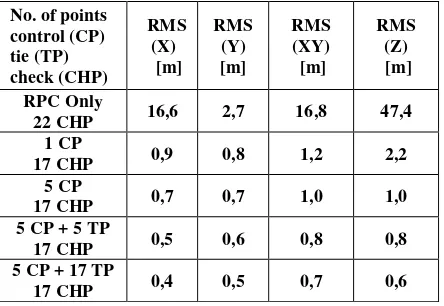
coefficients only, and in addition, including 1 or 5 control points (CP), supported also by 5 or 17 tie points (TP). When orientation of images has been executed only with RPC coefficients (in Summit Evolution), only the approximate orientation of 3D model was achieved and its stereo viewing was disturbed. The RMS for X,Y,Z calculated from differences between field coordinates of check points and the corresponding points measured on such oriented 3D photogrammetric model was: RMS[X]=16,6m, RMS[Y]=2,7m and RMS[Z]=47,4m. Exterior orientation by use RPC coefficients only, was also executed with remote sensing PCI Geomatica software and the RMS (only for XY) were: RMS (X) =17,3 m RMS (Y) =3,9 m. As it can be seen from the above, the accuracy of RPC orientation by both systems is similar, however the advantage of the photogrammetric approach is reconstruction of 3D model and stereo measurement not only X and Y but also Z coordinate. The results of other cases (executed in stereo Summit Evolution system), with inclusion of 1 or 5 control points only and in addition to 5 control, 10 and 17 tie points (stereo measured), are presented in table 1.
Tab. 1 RMS (X,Y and Z) for check points in 3D models reconstructed with RPC only, and in addition, with 1 or 5 control points supported by 5 or 17 tie points.
No. of points only by RPC coefficients, the RMS (XY) and (Z) are very large and also the very high affinity can be observed between X and Y coordinates. Inclusion of 1 or 5 control points (CP) for external orientation, has improved significantly the accuracy of 3D model reconstruction. The RMS evaluated for the horizontal and vertical coordinates of 17 check points was decreased 14 or 17 times for XY and 22 or 47 times for Z respectively, regarding to accuracy of orientation by RPC coefficients only. Stereo-measuring of tie points, in addition to a few control points, gives the next accuracy improvement. As it is shown in table 1, more tie points involved better accuracy achieved. Using for orientation 5 control points and in addition 5 or 17 tie points, can decrease the RMS(XY) decreased to 0,8m or 0,7m and RMS(Z) to 0,8 or 0,6m, respectively. The advantage of tie points inclusion is not only accuracy improvement but their stereo measurement which allows choosing any type of natural terrain point, even of very poor quality.
In the experiment, all the measurements were performed on the photogrammetric station (Summit Evolution) integrated online with ArcGIS system (platform). This solution has allowed transferring directly all measured data directly to GIS database and has given a number of possibilities such as snapping, attributing objects and as a result creating 2D/3D databases online. Databases in ArcGIS provide various formats of the files. The creation of the shape files and definition of the coordinate system is possible in the ArcCatalog module. In this
project, a geobase was created with separate shape files for points, lines, polygons, multi-points and multi-patch objects. All of those formats can store height information, but only multi-patch objects can deal with 3D data (such as blocks).
For registration and edition of the measured data, ArcMap module is used. Connection of Summit Evolution with ArcMap is supported by three DAT/EM Tools (Capture, Drawing and Editing - fig. 5), which allow to determine a type of digitized object and its edition, information on elements, registration and edition of DTM points, creation of offsets and switching between platforms of Summit Evolution and ArcMap.
Fig.5 DAT/EM Capture Tools in ArcMap (Manual of SE).
In the process of orientation, coordinates of the ground points (control and check) archived in established GIS database were used. All these coordinates were transferred to Summit Evolution auxiliary file using the instruction Edit->Control File from tools set of Summit Evolution.
After orientation of stereo images, the 3D model was formed and stereo-digitization of all 3D data requested for reconstruction of buildings (edges of the roofs), has been executed and then transferred directly to the selected layers of ArcMap database. Stereo digitized roofs of buildings in the shape format are presented in figure 6.
Fig. 6 Stereo digitized roofs of buildings in the shape format
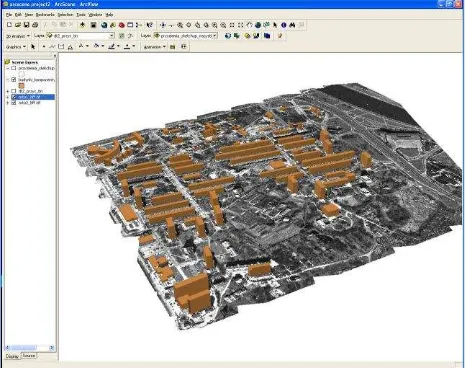
the roof edges. In order to limit the height of the pulled objects, the DTM surface was used. The final result, which was later exported back to the ArcGIS format, is presented in figure 7.
Fig. 7 3D models of buildings on the generated DTM
Acquired data was insufficient for the creation of a very precise 3D model of buildings and accurate projection of the details such as shape of the roofs or very small objects. The final 3D model of buildings was assigned to the LoD-1 level of details (simple shapes, block model), despite the fact that its precision has reached LoD-2 level (2m for XY, 1m for H). The last part of the experiment consisted of the final visualization. The 3D model of buildings was exported from the Google SketchUp to the ArcGis format (multi-patch shape file). Next, it was presented in ArcScene module of ArcGis – the 3D environment of this platform. The 3D model of buildings was superimposed to the DTM with overlaying orthomap. All of the used components had the same coordination system defined. The final result of 3D visualization of the selected Cracow city district is presented in figure 8.
Fig. 8 Final 3D visualization of selected Cracow city district
4. CONCLUSIONS
In last years Satellite Photogrammetry has become very popular. Its attractiveness is growing up because of very fast
development of the VHRS systems, which produce imagery of very high resolution, taken in blocks of overlapped images with various configuration. This allows to apply a block triangulation process for simultaneous orientation of all images and to reconstruct and measure 3D models, based on stereo pairs of images, to produce variety of photogrammetric 3D products. It can be also seen, that the new generation VHRS imagery of 0.4
– 0.5 meters resolution, has become very competitive to middle scale photography, not only in respect to accuracy of point determination but also to identification of smaller features. In earlier generation of VHRS imagery (such as Ikonos) a gap could be observed between accuracy and recognition of features. The panchromatic mode of 1m resolution images, makes the recognition of smaller details very difficult or impossible.
In respect of Ikonos images, the crucial aspect in further studies is the process of image orientation. RPC coefficients, attached to the original photographs are not sufficient for a precise reconstruction of the photogrammetric model and additionally measured terrain points should be used. This procedure can decrease the obtained RMS error up to 20 times for horizontal coordinates and almost 50 times for vertical. Photogrammetric workstation with a module for 3D Ikonos model reconstruction and stereodigitization (such as Summit Evolution) allows to limit considerably the number of control points with known ground coordinates by involvement of arbitrary number of tie points for exterior orientation to obtain the sufficient accuracy.
At the stage of stereodigitization, the compilation of 3D products with photogrammetric Station Summit Evolution connected on-line with ArcGIS system is very helpful and provides useful tools for direct transfer all measured 3D data to GIS database. The consequence of such arrangement is a possibility of on-line data control in respect to their content and accuracy and also to execute in the same time some additional data processing with ArcGIS software. Such approach, which has been applied in this project, allowed to achieve the suitable data for a 3D block model of buildings on the level LoD1-LoD2.
5. REFERENCES AND SELECTED BIBLIOGRAPHY
References from Journals
Grodecki, J., G. Dial, 2003. Block Adjustment of High- Resolution Satellite Images Described by Rational Polynomials, Photogrammetric Engineering and Remote Sensing, 69(1):59- 68
Toutin, Th., 2004a. Comparison of Stereo-Extracted DTM from Different High-Resolution Sensors: SPOT-5, EROS-A, IKONOS-II, and QuickBird, IEEE Transactions on Geoscience and Remote Sensing, 42(10): 2121-2129.
References from Other Literature
Bujakiewicz A., Preuss R., 2010. Extraction of 3D Vector Data in the Summit Evolution-ArcGIS Photogrammetric System with Inclusion of Roof Topology. Archives of Photogrammetry, Cartography and Remote Sensing, Wroclaw, Poland, Vol. 21, pp. 53-62.
Ewiak I., 2009. The Multisensor Satellite Triangulation. Archives of Photogrammetry, Cartography and Remote Sensing, Krakow, Poland, Vol. 19, pp. 101-110.
Holc M., 2011. Evaluation of usefulness of Very High Resolution Satellite images for generation of the vector data. MSc thesis, Warsaw University of Technology, pp. 1–117.
Kaczyński, R., Majde, A., Ewiak, I., 2004. Accuracy of DTM and ortho generated from Ikonos stero images.The International Archives of Photogrammetry and Remote Sensing, Istambul, Turkey Vol. XXXV, part B4, pp. 463–468.
Kocaman, S., Zhang, L., Gruen, A., Poli, D., 2006. 3D city modelling from high-resolution satellite images. The International Archives of Photogrammetry, Remote Sensing and Spatial Information Sciences, Ankara, Turkey, Vol. XXXVI, 1/W4 (CD-ROM)
Ulm, K., 2003. Improved 3D City Modelling With Cybercity Modeler using Aerial, Satellite Imagery and Laserscanner Data. The International Archives of Photogrammetry and Remote Sensing, Tarasp, Switzerland, Vol. XXXIV-5/W10. CD-ROM.
Zhang, C., Fraser, C., 2008. Generation of digital surface model from high resolution satellite imagery. The International Archives of Photogrammetry, Remote Sensing and Spatial Information Sciences, Beijing, China, Vol. XXXVII, part B1, pp. 785–790.
References from websites
Dial G., Grodecki J., 2004. Satellite Image Block Adjustment Simulations with Physical and RPC Camera Models. Proceeding of ASPRS Conference, Denver, Colorado CD-ROM. http:/www.geoeye.com/CorpSite/resource/white-papers.aspx
Kolbe, T., Groger, G., Plumer, L., 2005. City GML – Interoperable access to 3D city models.
http://www.gdmc.nl/events/gi4dm/presentations/02-Kolbe.pdf
Toutin, T., 2004b. Generation of DTM from stereo high resolution sensors.