INVESTIGATION OF 1:1,000 SCALE MAP GENERATION BY STEREO PLOTTING
USING UAV IMAGES
S. Rhee a, T. Kim b*
a 3DLabs Co. Ltd., 100 Inharo, Namgu, Incheon, Korea –[email protected]
b Dept. of Geoinformatic Engineering, Inha University, 100 Inharo, Namgu, Incheon, Korea –[email protected]
Commission VI, WG VI/4
KEY WORDS: UAV, external orientation, incremental bundle, stereoscopic plotting
ABSTRACT:
Large scale maps and image mosaics are representative geospatial data that can be extracted from UAV images. Map drawing using UAV images can be performed either by creating orthoimages and digitizing them, or by stereo plotting. While maps generated by digitization may serve the need for geospatial data, many institutions and organizations require map drawing using stereoscopic vision on stereo plotting systems. However, there are several aspects to be checked for UAV images to be utilized for stereo plotting. The first aspect is the accuracy of exterior orientation parameters (EOPs) generated through automated bundle adjustment processes. It is well known that GPS and IMU sensors mounted on a UAV are not very accurate. It is necessary to adjust initial EOPs accurately using tie points. For this purpose, we have developed a photogrammetric incremental bundle adjustment procedure. The second aspect is unstable shooting conditions compared to aerial photographing. Unstable image acquisition may bring uneven stereo coverage, which will result in accuracy loss eventually. Oblique stereo pairs will create eye fatigue. The third aspect is small coverage of UAV images. This aspect will raise efficiency issue for stereo plotting of UAV images. More importantly, this aspect will make contour generation from UAV images very difficult. This paper will discuss effects relate to these three aspects. In this study, we tried to generate 1:1,000 scale map from the dataset using EOPs generated from software developed in-house. We evaluated Y-disparity of the tie points extracted automatically through the photogrammetric incremental bundle adjustment process. We could confirm that stereoscopic viewing is possible. Stereoscopic plotting work was carried out by a professional photogrammetrist. In order to analyse the accuracy of the map drawing using stereoscopic vision, we compared the horizontal and vertical position difference between adjacent models after drawing a specific model. The results of analysis showed that the errors were within the specification of 1:1,000 map. Although the Y-parallax can be eliminated, it is still necessary to improve the accuracy of absolute ground position error in order to apply this technique to the actual work. There are a few models in which the difference in height between adjacent models is about 40 cm. We analysed the stability of UAV images by checking angle differences between adjacent images. We also analysed the average area covered by one stereo model and discussed the possible difficulty associated with this narrow coverage. In the future we consider how to reduce position errors and improve map drawing performances from UAVs.
1. INTRODUCTION
Many institutions and organization currently use aerial imagery to generate high-precision maps. For map generation using aerial image, precise position and orientation information are usually acquired together with images. It is possible to establish a collinear condition using EOPs (external orientation parameters) such as position and orientation of each image and IOPs (internal orientation parameters) such as a focal length and a pixel size. In particular, as the aerial photography technology has been is improved, the quality of the on-board sensors as well as images is improved. Direct geo-referencing using EOPs acquired directly from the aircraft is also increasing.
Map drawing using aerial photogrammetry has been accepted as a standardized map generation method. However, the demand of UAVs (Unmanned Aerial Vehicles) is rapidly increasing in recent years. UAVs can shoot images at a low altitude than aerial photographs. Such characteristics guarantee convenient operation and images with small GSD (ground sampling distance). In the meantime, 3D terrain reconstruction has been a major concern for the processing of UAV images (Remondino et
* Corresponding author
al, 2011). Large scale maps and image mosaics have become representative geospatial data that can be extracted from UAV images. Map drawing using UAV images can be performed by creating orthoimages and digitizing them. Maurice et al. (2015) reported a map generation of 1/1000 scale through digitizing using ArcMap software after UAV image processing. Kedzierski et al. (2016) performed orthoimage generation using UAV and updated the basic map. They reported a maximum RMSE of 0.23m. While maps generated by digitization may serve the need for geospatial data, many institutions and organizations require map drawing using stereoscopic vision on stereo plotting systems. However, there are not many examples of the digital topographic map by applying stereo plotting method to UAV images.
There are several aspects to be checked for UAV images to be utilized for stereo plotting. The first aspect is the accuracy of exterior orientation parameters (EOPs) generated through automated bundle adjustment processes. Accurate EOPs are pre-requisite for stereoscopic plotting. Without them, there will be significant Y-parallax between stereo images. Moreover, inaccurate EOPs will bring coordinate discrepancy among adjacent models. It is well known that GPS and IMU sensors mounted on a UAV are not very accurate. EOPs acquired directly The International Archives of the Photogrammetry, Remote Sensing and Spatial Information Sciences, Volume XLII-2/W6, 2017
from the sensors will create large Y-parallax and model errors. Therefore it is necessary to adjust initial EOPs accurately using tie points. For this purpose, incremental bundle adjustment based on the SfM (Structure-from-motion) approach has been proposed and implemented in most commercial UAV image processing software(Snavely and Bundler, 2011). Even if SfM algorithms greatly facilitate the production of detailed topographic models from UAV images, problems of EOPS with low accuracy are continuing (James et al, 2017). In this paper, we analyse the accuracy of EOPs adjusted from the initial EOPs through a photogrammetric incremental bundle adjustment procedure developed in-house.
The second aspect is unstable shooting conditions compared to aerial photographing. In order to construct a stable pointing environment, stability is required for the position (X, Y, Z) and attitude angles (Roll, Pitch, Yaw) of the air vehicle during the time of shooting. However, in the case of UAV, it is difficult to acquire stable images due to influence of weather or vibration during image acquisition. Unstable image acquisition may bring uneven stereo coverage, which will result in accuracy loss eventually. Oblique stereo pairs will create eye fatigue. This paper will discuss effects related to this aspect.
The third aspect is small coverage of UAV images. Unlike aerial images with high altitude and large format, the area covered by one UAV image is very limited. This aspect will raise efficiency issue for stereo plotting of UAV images. More importantly, this aspect will make contour generation from UAV images very difficult.
The next section briefly describes the photogrammetric incremental bundle adjustment procedure developed to accurately adjust initial EOPs.
2. PHOTOGRAMMERIC INCREMENTAL BUNDLE ADJUSTMENT
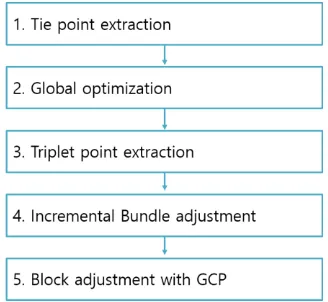
The accuracy of EOPs acquired with the image in the UAV is lower than that of airplanes. And, as mentioned in the introduction, this causes serious geospatial error and Y-parallax. Therefore, bundle adjustment of UAV images is required to update the EOPs to desirable accuracy. We developed a photogrammetric incremental bundle adjustment procedure and applied to stereo plotting of 1:1,000 map. The flow chart for the procedure is as follows.
Figure 1. Flow chart for the operation that includes incremental bundle
For automatic tie pint extraction, we used the FAST/ FREAK (Alahi et al, 2012) algorithm. About 60,000 features were
extracted per image and RANSAC was applied to eliminate outliers.
In the global optimization process, the selection of the optimal image pairs among all images that can represent all areas was selected. We first check the number of tie points per all image pair per a reference image. We calculated the convergence angle between the pair and filtered out the pairs with too large or too small angles. We select the best pair per image as the pair with the maximum tie points after convergence angle filtering. When the best pairs for all images were selected, the base image was selected as the image appeared most frequently in the best pairs.
In the triplet point extraction process, the base image, its best pair image and one other image that had largest tie points with the two images were selected. Using triplet points, common tie points among the three images, we found the points that satisfied coplanar conditions for all three image pairs through a RANSAC-manner. We calculated model coordinates of the triplet points through space intersection and set the coordinates as the reference points for the photogrammetric incremental bundle adjustment.
Next, photogrammetric incremental bundle adjustment was performed to other images with the reference triplet points. We selected an image that contained the reference triplets most, adjusted its initial EOPs through collinear conditions and updated the reference triplet set by adding new triplets acquired from the newly adjusted image. It is known that incremental bundle adjustment based on SfM approach applies a mathematical model such as DLT to bindle adjustment. Here we tried phogrammetrically more rigorous model for generating precise EOPs. EOPs from our approach has shown better accuracy compared to those from SFM approaches (Rhee and Kim, 2016; Rhee et al, 2017).
Next, we apply block adjustment with GCPs. Once all images have been adjusted, we applied GCPs to convert the whole model blocks into the absolute coordinate frames.
In this study, we tried the photogrammetric incremental bundle adjustment procedure to generate EOPs suitable for 1:1,000 scale map plotting.
Figure 2. 3DSuite-UAV (S/W developed in house) The International Archives of the Photogrammetry, Remote Sensing and Spatial Information Sciences, Volume XLII-2/W6, 2017
3. DATASET
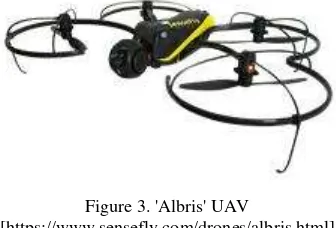
We used 221 number of images taken by UAV with 4.5 cm GSD for 0.8 km2 area. For data acquisition, 'Albris' UAV was used. And we used a camera attached to a UAV as the imaging device.
Figure 3. 'Albris' UAV
[https://www.sensefly.com/drones/albris.html]
Acquisition of the images took place at an altitude of about 250m. Target area is the downtown area with a lot of small and tall buildings. We set the coordinates system to UTM zone 52 S. A total of 12 GCPs were used for block adjustment. Figure 4 shows the target area and the flight path. Figure 5 show the acquired UAV sample images. Table 1 summarize the IO parameters of each image.
Figure 4. Target area and flight path
Figure 5. Experiment images
Table 1. Properties of UAV images (IO parameters)
4. EXPERIMENTS
Since accurate EOPs are pre-requisite for stereoscopic plotting, we applied the photogrammetric incremental bundle adjustment, explained earlier, to the UAV images acquired. Through the procedure, we derived adjusted EOPs and the best image pairs. We evaluated Y- parallax of the tie points extracted automatically among the best pairs. Table 2 shows the part of Y-parallax
calculated at the tie point for each generated image pair. It can be seen that parallax about 1 pixel occurred in most pairs. For all image pairs, we achieved the Y-parallax of 0.933 pixel MAE from 54 image pairs and 16,383 tie points
Pair ID Num of
Table 2. Y-parallax for each image pairs
We could confirm by a professional photogrammetrist that stereoscopic viewing was possible with the adjusted EOPs. Stereoscopic analysis was performed by randomly selecting adjacent pairs and judging by naked eyes with stereo plotter. Figure 6 show the stereo plotter.
Figure 6. Stereo plotter (HIST-DPW)
It is very difficult or impossible to draw a map if there is a height difference between adjacent stereo models. Therefore, the ground coordinates of each target were calculated from adjacent models composed of different images, and the difference in coordinates relative to the same target was analyzed.
Table 3 shows position errors of the same target in other stereo models. Experimental results show that the stereo models adjusted from the proposed bundle adjustment had high accuracy under 10cm both horizontal and vertical. It could be a proof that the relative sensor model between images is well established.
Target ID Horizontal Error
Table 3. Position difference of the same target in different stereo models (Rhee et al., 2017)
In order to verify the accuracy of the sensor model establishment, we also compared the ground coordinates measured by the GCP and plotting instrument. The accuracy of the model point was calculated as the average of the values measured in the model including each point. The horizontal error is less than 10cm and vertical error is about 15cm. And this accuracy satisfies the condition of 1/ 1,000 scale map. Note that by Korean mapping regulation, the allowable root mean square errors for 1:1,000 map are 20 cm in horizontal position and 30 cm in height.
We confirmed that using the photogrammetric incremental bundle technique, we can extract the adjusted EOPs and Y disparity can be eliminated. However, there are still some difficulties for map drawing. One of these is unstable shooting conditions compared to aerial photographing. In order to analyse the instability of UAV, we checked the images taken on the same strip.
Figure 7. UAV images acquired in the flight direction
Figure 7 is a sequential UAV images acquired in the flight direction. In this figure, it can be seen that the position and attitude angle of the image 110 and the image 112 change dramatically. We constructed the stereo pairs using the adjusted EOPs to determine the relative positions between the images.
Figure 8. Image boundaries of each stereo pair
In Figure8, we can see that the pair is constructed without large angle difference in 107-108. However, in other stereo pairs, an oblique pair was created due to a sudden change in position and attitude. Oblique stereo pairs will create eye fatigue. For this reason, stereo pairs with high eye fatigue were excluded when map drawing the target area.
A final aspect for map drawing with UAV is small coverage of UAV images. In the case of our dataset, the area covers 0.02km2 per image, and when stereo pairs are constructed using two adjacent images, an average 0.015km2 area can be stereoscopically viewed. Considering that 1:1,000 maps cover the 0.25km2 area, while a few stereo models are sufficient to cover one 1:1,000 scale map for aerial photographs, as many as 100 stereo images are required for UAV images. The difficulty of stereo drawing using a plurality of stereo models is that a large building area or a contour line cannot be shown by only one image pair. Also, even if the height difference between adjacent models is within the error range, it can be difficult to accurately draw the smooth contours and the height of the building.
5. 1/1,000 SCALE MAP PLOTTING
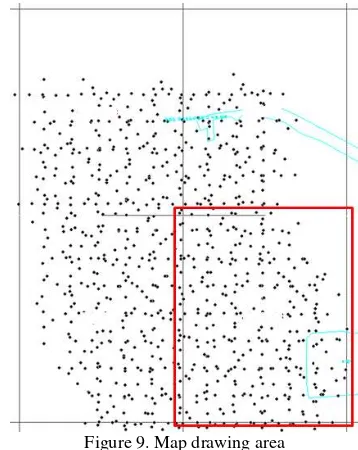
In this study, we tried to make a map of 1:1000 scale with EOPs adjusted by the proposed adjustment. The map drawing was performed only on the map including the largest part in the range of 1 / 1,000 of the captured images of the target area. The drawing area is shown in the figure below.
Figure 9. Map drawing area
Stereoscopic plotting instrument work was carried out by a professional photogrammetrist.
As a result of applying the proposed adjustment method, it was confirmed that the geometric problem which appeared when using the initial EOPs was improved considerably.
Figure 10 shows the result of comparing the horizontal position with the adjacent model after map drawing for a specific model. The green and red lines represent vector lines extracted from different stereo models. From the experimental results, we can confirm that the extracted vector lines are aligned with the boundaries of the building without large errors.
Figure 11 shows the comparison results of vertical positions with different models. Verification of height values was performed in flat areas such as roads. The two numbers shown in the figure are the height values extracted from each model.
Figure 10. Horizontal position comparison between adjacent models
Figure 11. Vertical position comparison between adjacent models
Experimental results show that when using the EOPs calculated by the proposed incremental bundle adjustment, it is possible to map drawing without Y-parallax many pairs. However, there was also an image pair where accuracy was not guaranteed.
Figure 12 shows an example where the vector obtained from each model does not match the boundary of the building seen in the image. In Figure 13, we can see that the height difference of the same point measured by different model is about 40cm. Since this study is currently in progress, further studies will be needed to reduce these errors.
Figure 12. Areas with low horizontal accuracy between adjacent models
Figure 13. Areas with low vertical accuracy between different models
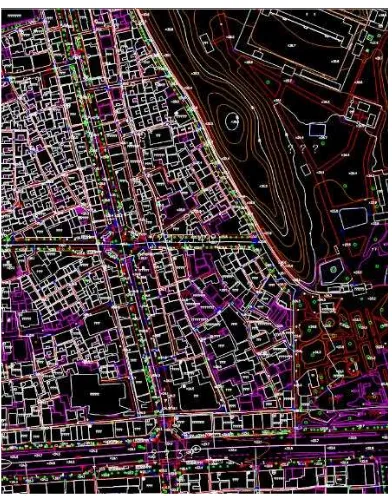
In this study, map drawing of 1/1000 scale was performed except for those image pairs that could not be adjusted. Figure 14 shows a portion of a mosaic image and a high-scale digital map produced using UAV image of the target area.
6. CONCLUSION
We studied the possibility of 1:1,000 map generation by stereo plotting from UAV images. We confirmed that we can draw a map using the EOPs calculated from the photogrammetric incremental bundle adjustment procedure. These results demonstrate that the geometric stability of the image was ensured by the adjustment and that the Y-parallax was largely eliminated. Most of the models established reached to the accuracy required for 1:1,000 map. However, it is still necessary to improve the accuracy of absolute ground position error in order to apply this technique to the actual work. There are a few models in which the difference in height between adjacent models is about 40 cm.
Figure 14. Extracted digital map on target area using UAV image (1:1000)
In addition, the generation of the stereo model using EOP was performed and the shape and position of each image boundary were confirmed. As a result of performing stereoscopic vision using the generated stereo pair, the obliquely generated model was difficult to use in map drawing due to eye fatigue. Then, it is necessary to develop an oblique model exclusion algorithm using EOP.
Because of the small UAV coverage, it was also difficult to replace the stereo model when drawing a map. It is difficult to extract continuous contour lines due to the difference in height value generated when the model is replaced. Also, more precise work was required for the height of the building and the boundary of the building.
In the future we consider how to reduce position errors and improve map drawing performances from UAVs, for example by hiring more GCPs or by using images with more overlaps. In particular, we try to find the relationship between the errors with instability of UAVs, with the amount of overlap or with the distribution of triplets and GCPs.
7. REFERENCES
Alahi, A., Ortiz, R., & Vandergheynst, P., 2012. Freak: Fast retina keypoint. In Computer vision and pattern recognition (CVPR), 2012 IEEE conference on (pp. 510-517). Ieee.
Kedzierski, M., Fryskowska, A., Wierzbicki, D., & Nerc, P., 2016. Chosen Aspects of the Production of the Basic Map Using UAV Imagery. International Archives of the Photogrammetry, Remote Sensing & Spatial Information Sciences, 41.
James, M. R., Robson, S., d'Oleire-Oltmanns, S., & Niethammer, U., 2017. Optimising UAV topographic surveys processed with structure-from-motion: Ground control quality, quantity and bundle adjustment. Geomorphology, 280, pp. 51-66.
Maurice, M. J., Koeva, M. N., Gerke, M., Nex, F., & Gevaert, C., 2015. A photogrammetric approach for map updating using UAV in Rwanda. Proceedings of the GeoTechRwanda, Kigali, Rwanda, pp. 18-20.
Remondino, F., Barazzetti, L., Nex, F., Scaioni, M., & Sarazzi, D., 2011. UAV photogrammetry for mapping and 3d modeling– current status and future perspectives. International Archives of the Photogrammetry, Remote Sensing and Spatial Information Sciences, 38(1), C22.
Rhee, S., & Kim, T., 2016. Dense 3d Point Cloud Generation from UAV Images from Image Matching and Global Optimazation. ISPRS-International Archives of the Photogrammetry, Remote Sensing and Spatial Information Sciences, 1005-1009.
Rhee, S., Kim, T., Kim, D., & Lee, H., 2017. Analysis for Stereoscopic Plotting Applicability of UAV Images, International Symposium on Remote Sensing Japan, Nagoya. May, 2017
Snavely, N. & Bundler, 2011. Structure from Motion (SFM) for Unordered Image Collections; Available online: phototour.cs.washington.edu/bundler/ (accessed on 13 January 2011).