Farmers Entrepreneurship and Performance of Red Onion Farming in Bantul
District
Ulfah Nurdiani
1, Slamet Hartono
2, Jamhari
2 1Student in Agriculture Economic Study Program, Unversity of Gadjah Mada, Yogyakarta
2Lecturer in Faculty of Agriculture, University of Gadjah Mada, Yogyakarta
ABSTRACT
The purposes of this study were: (1) To identify the level of onion farmers entrepreneurship in Bantul district, (2) To determine the influence of individual factors, physical, social, economic and institutional environment on the level of farmers entrepreneurship and performance of red onion farming in Bantul district, and (3) To determine the effect of the level farmers entrepreneurship on performance of red onion farming in Bantul district. The method study uses descriptive analytical, which analyzed the data further to find a relationship or ratio between the variables in the theoretical framework of thinking. Data collection using questionnaires previously tested the validity of using Product Moment Correlation and reliability testing using Cronbach Alpha coefficients. Data analysis techniques broadly consists of three stages: a preliminary analysis to calculate individual farm performance indicators (produtifitas, revenue and Private Cost Ratio), descriptive analysis of the percentage of the study variables and analysis of structural equation model (SEM). The research results showed that the level of red onion farmers entrepreneurship in Bantul categorized high with an overall average percentage of 70.87%. Individual factors, physical, social, economic and institutional environment positive and significant impact on the farmers entrepreneurship and performance of farming. The factor that has the greatest positive effect of individual factors followed by the institutional environment. The physical environment and the economy have the same magnitude, while the smallest is the social environment influences. Farmer entrepreneurship positive effect on farm performance and has an important role in mediating the influence of individual and environmental factors on farm performance. These results provide evidence for the idea that entrepreneurial farmers is something that can be grown and can be considered to be a new approach in improving farm performance.
Keywords:Entrepreneurship, Performance, Structural Equation Model
INTRODUCTION
Farm sector (on-farm) research are generally more focused on analyzing farm performance and the determinants of production and income in the technological aspects of cultivation. Farm production is generally more associated with the use of inputs of land, seed, fertilizer, medicine, labor, farmers age and land fertility.
The success of peasant farming in achieving high performance in fact is not only determined by the activities of cultivation techniques but is also influenced by how much the ability of farmers to manage and creation production factors under their control into a profitable business and sustainability efforts. This capability is referred to as entrepreneurship
Farmers entrepreneurship are very important as a new approach in improving farm performance among others based on the entrepreneurial characteristics and also because in the future based farmer with all its limitations either in relation to arable land, technology, capital,
management, information and access to markets, farmers should strive to achieve high performance farm in the middle of the business environment is not favorable either because the output market is not conducive, which does not support the nature and related problems with cultivation (Wibowo, 2005).
Entrepreneurship is important for the development of agribusiness (Soetriono, 2006). Entrepreneurship is also important to the process of economic development, including agricultural development. Pressure business environment in the agricultural sector are entering an era of international trade that is free and as if without geographical boundaries, the marketing of agricultural products in the world, including Indonesia entered a period of difficult times so we need entrepreneurs who can compete for the challenge and the opportunities that exist (Priyanto, 2004 ).
agriculture sector (especially in on-farm sectors) are so rare. Therefore, farmers need to prove whether entrepreneurship can be an alternative approach in improving farm performance in entrepreneurship in Bantul district, (2) To determine the influence of individual factors, physical, social, economic and institutional environment on the level of farmers entrepreneurship and performance of red onion farming in Bantul district, and (3) To determine the effect of the level farmers entrepreneurship on performance of red onion farming in Bantul district.
METHODS
The data used in this study are primary and secondary data. Bantul District was purposively selected as the study site. Sanden and Kretek selected sub as with sub samples were further selected two villages namely Srigading and Parangtritis sample. The study was designed using SEM method approach. According to Hairet al. (1995) in Solimun (2008), there are two ways of determining an appropriate sample size for SEM, namely: (1) 100-200 or (2) as much as 5-10 times the number of estimated parameters. In this study, determination of the number (size) of the sample using the basic approach of the first, which is defined as the number of samples 100 farmers plant ingred in season I 2011 intentionally (purposive).
Validity and Reliability Test for Questionnaire
The validity test of the items was measured using Product Moment Correlation analysis, while there liability test was done by using Cronbach Alpha Formula (Arikunto, 2002). Calculation of validity and reliability with SPSS 20.0 for windows.
Structural Equation Model Analysis
The analysis is divided into two parts: a confirmatory factor analysis (Confirmatory Factor Analysis/CFA), which aimed to test the constructs unidimensionalitas of exogenous and endogenous constructs that will confirm whether the observed variables reflect factors analyzed and the analysis of SEM (Structural Equation Model ) by building
a theoretical model is presented in Table 1. and the model presented in Figure 1.
RESULTS AND DISCUSSION
Validity and Reability Test
The validity of the statement items to measure of farmers perceptions tophysical, social, economic, and institutional environmental factors variables and entrepreneurial onion farmers in Bantul. The results showed all the items valid because the wholes statement item questionnaire obtained r-count (corrected item total correlation) greater than the value of r-table.
The values for reliability testing using Cronbach alpha coefficients scores derived from questionnaire items were valid. The questionnaire has high reliability coefficients obtained if > 0.60 (Ghozali, 2002). Based on reliability test results also showed that the questionnaire used in the data collection reliable because the Cronbach alpha coefficient greater than 0.6.
Individual Factors and Perceptions of Farmers
Against Physical, Social, Economic and
Institutional Environmental Factors
1. Individual Factors
Individual factors in this study is a latent variable measured by the indicators of age, formal education, farming experience and household size. Based on Table 2. it can be seen that the onion farmers dominated by middle age is between 36-55 years of age where age is still productive. Age is still earning an internal environmental factors that allegedly could be supporting the development of the entrepreneurial spirit because it is still potential to develop themselves and the farm.
The majority of the onion farmers of education is high school, followed by 43% with 31% SMP. This shows that farmers have adequate education and it is expected to be a supporter of the development of the entrepreneurial spirit that farmers are better able to manage the farming and be able to respond to market demands.
growing number of family members covered will be more motivating farmers to be more successful in farming. Based on Table 2. predominantly
peasant family size of 2-3 people is 68%, followed by 4-5 people is 24%.
Table 1.Theoretical Model Building Research
No Variables Indicator
1. Individuals (ξ1) Age (X1)
Formal education (X2)
Farming experience (X3)
Household size (X4)
2. Physical Environment(ξ2) Transportation (X5)
Irrigation (X6)
Development of cultivation technology (X7)
3. Social Environment (ξ3) Family Support (X8)
Community support (X9)
Government support (X10)
4. Economics Environment (ξ4) The development of farm income (X11)
The development of inputs market (X12)
The development of output market (X13)
5. Institutional Environment (ξ5) The role of farmer groups (X14)
The role of agricultural extension (X15)
The role of credit agencies (X16)
6. Entrepreneurship (η1) need for success in farming (Y1)
Confidence (Y2)
Risk taking (Y3)
Innovative (Y4)
Leadership (Y5)
Goal and outcome orientation (Y6)
Market Orientation (Y7)
7. Performance (η2) Productivity (Y8)
Income (Y9)
Competitive Advantage (Y10)
Figure 1. SEM Model Hypothesis
1. Physical Environmental Factors
Table 3. indicates that the physical environment is categorized favor with the average
condusive condition physical environment will be grow entrepreneurial farmers ultimately expected
positive effect on onions farm performance improvement.
Table 2.Description of Individual Factors onion farmers in Bantul n= 100
Indicator Category Number of People Percentage (%)
Age 15-25 years
Farming experience ≤ 5 years
6-10 years
Source : Primary Data Processed (2012)
Table 3.Farmers Perception on Physical Environmental Factors, n = 100 Indicator/ Variables Number of People and
Percentage of Each Category
Percentage of Average
Categori
VS S ES NS DNS
Transportation 13 73 6 6 13 77,80 S
Irrigation 24 20 12 26 8 67,20 S
Development of
Cultivation technology 4 23 62 11 0 61,28 ES
Physical Enviroment 68,76 S
Source :Primary Data Processed (2012)
Note:VS (Very Supports), S(Support), ES(enough support), NS(NoSupport), DNS (It Does Not Support)
2. Social Environmental Factors
Table 4. showed that based on the average percentage of the overall social environment of 69.69% and zoned support. That is because the average percentage of family and community support are high, amounting to 82.10% and 70.27%. Family support and community support for the growth categorized entrepreneurship onion farmers in farming, while farmers perceived government support is only enough to support the average percentage of 56.72%.
3.Economics Environment
Table 4.Farmers Perception on Social Environmental Factors, n = 10 Indicator/ Variables Number of People and Percentage
of Each Category
Percentage of Average
Categori
VS S ES NS DNS
The development of
farm income 28 56 5 11 0 80,20 S
The development of
inputs market 10 34 54 2 0 66,20 ES
The development of
output market 15 18 34 10 23 58,40 ES
Social Environment 68,26 S
Source : Primary Data Processed (2012)
Note: VS (Very Supports), S (Support), ES (enough support), NS (No Support), DNS (It Does Not Support)
Table 5.Farmers Perception of Environmental Economics Factors, n = 100 Indicator/ Variables Number of People and Percentage of
Each Category
Percentage of Average
Categori
VS S ES NS DNS
Family Support 44 47 7 2 0 82,10 S
Community support 16 55 25 4 0 70,27 S
Government support 2 15 59 22 2 56,72 ES
Social Enviroment 69,69 S
Source :Primary Data Processed (2012)
Note:VS (Very Supports), S (Support), ES (enough support), NS (No Support), DNS (It Does Not Support)
4. Institutional Environmental Factors
Table 6. showed that based on the average percentage of the overall institutional environment of 69.89% and zoned support. This is mainly because the average percentage of the role of farmer groups is very high at 86.08% and
categorized very supportive. While the perception of farmers to agricultural extension and credit institutions are sufficiently supported by the average percentage of respectively 66.00% and 57.60%.
Table 6.Farmer Perceptions on Institutional Environmental Factors, n = 100
Source:Primary Data Processed (2012)
Note:VS (Very Supports), S (Support), ES (enough support), NS (No Support), DNS (It Does Not Support)
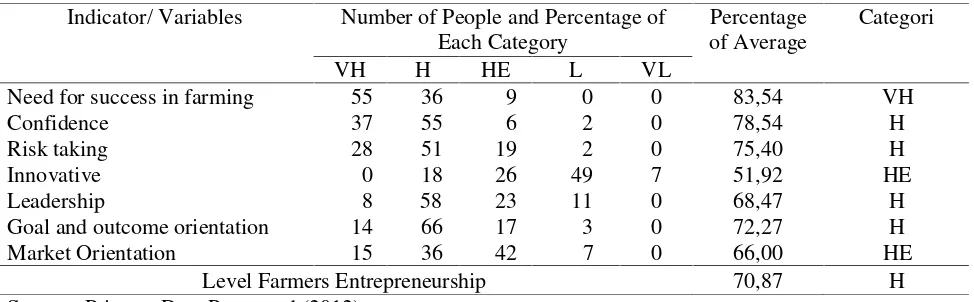
5. Farmers Entrepreneurship
Level of entrepreneurial growers based on
each indicator shows diversity. Table 7. shows the level of entrepreneurship onion farmers in Bantul Indicator/ Variables Number of People and Percentage of
Each Category
Percentage of Average
Categori
VH H HE L VL
Need for success in farming 55 36 9 0 0 83,54 VH
Confidence 37 55 6 2 0 78,54 H
Risk taking 28 51 19 2 0 75,40 H
Innovative 0 18 26 49 7 51,92 HE
Leadership 8 58 23 11 0 68,47 H
Goal and outcome orientation 14 66 17 3 0 72,27 H
Market Orientation 15 36 42 7 0 66,00 HE
once answered the first research hypothesis suggests that the level of entrepreneurship onion
farmers in Bantul considered high. It can be seen from the overall average percentage of 70.87%.
Table 7.Onion Farmers Entrepreneurship level in Bantul
Indicator/ Variables Number of People and Percentage of Each Category
extension 11 43 31 13 2 66,00 ES
The role of credit agencies 7 20 45 23 5 57,60 ES
Institutional Environmental 68,89 S
Sources:Primary Data Analysis (2012)
Note:VS (Very Supports), S (Support), ES (enough support), NS (No Support), DNS (It Does Not Support)
6.Farming Performance
The first performance indicators onion farm is productivity. Based on the research productivity of minimum total of 61 quintals/hectares, while the maximum productivity is 131 quintals/hectare, average productivity is 92 quintals/hectares. Average productivity in Bantul be considered high when compared to productivity in other production centers such as Brebes district is 77.48 quintals/hectares at planting and in the same year (Kartikasari, 2012).
A second indicator is the income of farmers from farming of onion in Bantul average of Rp 25.868.109,27/hectares. The median income of farmers is large enough for onion price is quite high, averaging Rp 6579.00. According to farmers, the price level in the growing season I
usually relatively better than the second season though not always the case.
A third indicator is the competitive advantage. The approach used to calculate the competitive advantage is through PCR (Private Cost Ratio). If the PCR value is less than one, indicating that a commodity is financially efficient and have a competitive advantage. The results obtained by the analysis of PCR values by 0,58, which means to increase the revenue of 10.000,00 required additional domestic factor costs of Rp 5.800,00 on financial prices, while the minimum and maximum competitive advantage respectively of 0.90 and 0.28. PCR value smaller than one indicates that the farming of onion in Bantul financially efficient and have a competitive advantage.
Table 8.Performance of Onion Farming Planting season of 2011 in Bantul
Indicator Performance
Minimum Maximum Average
Productivity quintals/hectares 61 131 92
Income Rp/hectares 9.457.461 57.420.202 25.868.109,27
Competitive Advantage 0,90 0,28 0,58
Sources:Primary Data Analysis (2012)
Influence Individual Factors, Social, Economic
and Institutional Environmental to the
Farmers Entrepreneurship and Its Effect on
Performance of Onion Farming with
Structural Equation Model Approach
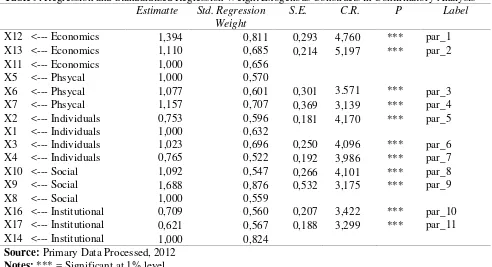
1. Confirmatory Factor Analysis - Exogenous Constructs
Table 9. shows that almost all of the variables were analyzed to yield significant results or in other words is a good addition to forming constructs indicators X7 and X9. However, the value of CR ≥ 2,00, the standardized regression
weight ≥ 0,5 and p ≤ 0,05 indicates that the variable is still a good-forming constructs (Ghozali, 2011).
confirmatory factor analysis of the exogenous construct viable and retained in the model.
Figure 2.Confirmatory Factor Analysis Results Exogenous Constructs
Table 9.Regression and Standardized Regression Weight Exogenous Constructs in Confirmatory Analysis
Estimatte Std. Regression Weight
S.E. C.R. P Label
X12 <--- Economics 1,394 0,811 0,293 4,760 *** par_1
X13 <--- Economics 1,110 0,685 0,214 5,197 *** par_2
X11 <--- Economics 1,000 0,656
X5 <--- Phsycal 1,000 0,570
X6 <--- Phsycal 1,077 0,601 0,301 3.571 *** par_3
X7 <--- Phsycal 1,157 0,707 0,369 3,139 *** par_4
X2 <--- Individuals 0,753 0,596 0,181 4,170 *** par_5
X1 <--- Individuals 1,000 0,632
X3 <--- Individuals 1,023 0,696 0,250 4,096 *** par_6
X4 <--- Individuals 0,765 0,522 0,192 3,986 *** par_7
X10 <--- Social 1,092 0,547 0,266 4,101 *** par_8
X9 <--- Social 1,688 0,876 0,532 3,175 *** par_9
X8 <--- Social 1,000 0,559
X16 <--- Institutional 0,709 0,560 0,207 3,422 *** par_10
X17 <--- Institutional 0,621 0,567 0,188 3,299 *** par_11
X14 <--- Institutional 1,000 0,824
Source:Primary Data Processed, 2012
Notes:*** = Significant at 1% level
Table 10.Feasibility Testing Results Model on Exogenous Constructs
Goodnes of Fit Index Cut-Of Value Analysis Result Model Evaluation
X2 -Chi-Square Small Expected 119,577 Good
Probability ≥0,05 0,039 Marginal
RMSEA ≤0,08 0,052 Good
CMIN/DF ≤ 2,0 1,272 Good
GFI ≥0,90 0,880 Marginal
CFI ≥0,90 0,915 Good
TLI ≥0,90 0,891 Marginal
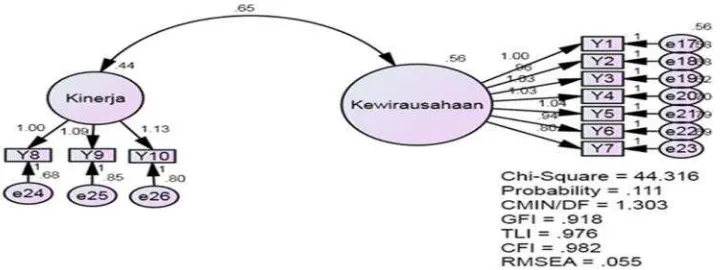
2. Confirmatory Factor Analysis - Endogenous Constructs
Figure 3.Confirmatory Factor Analysis Results Endogenous Constructs
Table 11. Regression and Standardized Regression Weight Exogenous Constructs in Confirmatory Analysis
Estimatte Std. Regression Weight
S.E. C.R. P Label
Y9 <--- Performance 1,094 0,618 0,154 7,122 *** par_1
Y10 <--- Performance 1,129 0,642 0,155 7,284 *** par_2
Y8 <--- Performance 1,000 0,626 Y1 <--- Entreprneurship 1,000 0,707
Y2 <--- Entreprneurship 0,965 0,688 0,128 7,550 *** par_3
Y3 <--- Entreprneurship 1,026 0,683 0,137 7,499 *** par_4
Y4 <--- Entreprneurship 1,025 0,699 0,135 7,594 *** par_5
Y5 <--- Entreprneurship 1,043 0,684 0,139 7,518 *** par_6
Y6 <--- Entreprneurship 0,936 0,620 0,137 6,836 *** par_7
Y7 <--- Entreprneurship 0,800 0,585 0,124 6,473 *** par_8
Source:Primary Data Processed, 2012
Notes:*** = Significant at 1% level
Table 11. showed that the overall variables were analyzed to yield significant results or otherwise are forming a good construct for CR value≥ 2.00, the standardized regression weight ≥
0.5 and p ≤ 0.05 indicates that the variable
remains good construct forming .
Table 12. showed the results of the feasibility model of endogenous construct confirmatory
factor analysis shows that all the requirements have been met as required. So it can be stated that the endogenous construct confirmatory factor analysis feasible in the model or in other words it can be stated that the indicators forming the construct of endogenous as strong indicators in the measurement model.
Table 12.Feasibility Testing Results Model on Endogenous Constructs
Goodnes of Fit Index Cut-Of Value Analysis Result Model Evaluation
X2 -Chi-Square Small Expected 44,316 Good
Probability ≥0,05 0,111 Good
RMSEA ≤0,08 0,055 Good
CMIN/DF ≤2,0 1,303 Good
GFI ≥0,90 0,918 Good
CFI ≥0,90 0,982 Good
TLI ≥0,90 0,976 Good
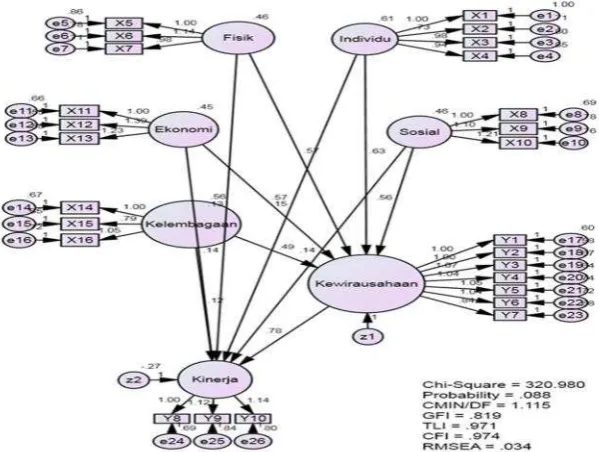
3.
Stuctural Equation Modelling (SEM) AnalysisFigure 4.Stuctural Equation Modelling
Table 13. Feasibility Testing Results Model on Endogenous Constructs
Goodnes of Fit Index Cut-Of Value Analysis Result Model Evaluation
X2 -Chi-Square Small Expected 320,980 Good
Probability ≥0,05 0,088 Good
RMSEA ≤0,08 0,034 Good
CMIN/DF ≤2,0 1,115 Good
GFI ≥0,90 0,819 Marginal
CFI ≥0,90 0,974 Good
TLI ≥0,90 0,971 Good
Source:Primary Data Processed, 2012
Table 13. showed that the goodness of fit test results SEM produces good fit indeces in the X2-criterion Chi-Square Probability, RMSEA, Cmin/DF, CFI and TLI and marginal (approximately requirements) that GFI of 0.819 indicating that the model had a satisfactory match because probability values and structural model index is above the recommended level, this model is considered a reasonable representation of the data so no need to modify model.
Table 14 is the value of standardized regression weights indicate the individual and environmental factors influence the total positive and significant impact on entrepreneurial farmers and farm performance. In addition, entrepreneurial farmers also showed a positive and significant impact on farm performance. This is presumably due to individual factors and environmental conditions conducive to supporting the growth of entrepreneurial farmers and farm
performance. So it can be concluded that the second and third research hypothesis is accepted.
Assumptions SEM Testing
Tabel 14.
Unstandardized dan Standardized Regression Weights in SEM Analysis
Path Estimate S.E C.R Std.
Regression P Hypotesis Note Entpnr <-- Individuals 0.620 0.108 5.715 0.662 *** Two Be accepted
Entpnr <-- Physical 0.547 0.108 5.067 0.513 *** Two Be accepted
Entpnr <-- Social 0.529 0.096 5.512 0.494 *** Two Be accepted
Entpnr <-- Economics 0.558 0.106 5.239 0.513 *** Two Be accepted Entpnr <-- Institutonal 0.565 0.101 5.604 0.585 *** Two Be accepted Perform <-- Physical 0.126 0.037 3.395 0.131 *** Two Be accepted Perform <-- Individuals 0.151 0.037 4.105 0.179 *** Two Be accepted
Perform <-- Socia 0.135 0.035 3.814 0.141 *** Two Be accepted
Perform <-- Economics 0.139 0.038 3.629 0.142 *** Two Be accepted Perform <-- Institutional 0.139 0.031 4.434 0.160 *** Two Be accepted Perform <-- Entpnr 0.781 0.097 8.069 0.868 *** Three Be accepted
Source:Primary Data Processed, 2012
Notes:*** = Significant at 1% level
-Estimate = Unstandardized Regression Weights
-Std. Regression Weights = Standardized Regression Weights
1.Normality data
The results of the normality analysis of the data showed that the value of CR skewness value all indicators point to a normal distribution because the value is below 2.58. While the multivariate normality test gives a value of 1.565 CR also below 2.58. So the multivariate normal distribution of data.
2. Evaluation outlier
The criteria used are based on the value of Chi-Squares on the degrees of freedom 26 (number of indicators) at a significance level of p <0.001. Value mahalonobis distance χ2 (26,0,001)
= 54.052. This means that all the cases that have a distance mahalonobis> 54.052 were multivariate outliers.
3. Evaluation of Multicollinearity and Singularity
The results of data processing show the value of the sample covariance matrix determinant 4.856 away from zero so that it can be concluded that there is no multicollinearity and singularity problems in data analysis.
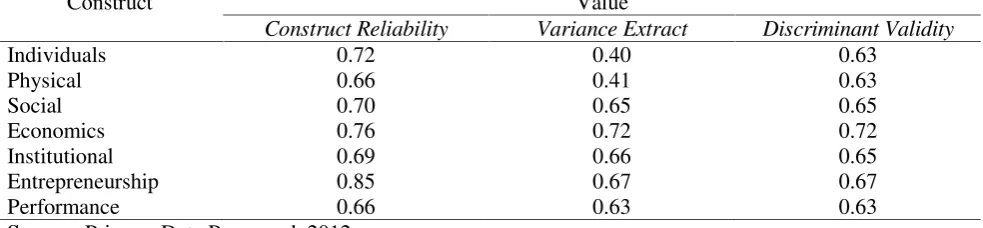
Reliability, Variance Extract and Diskriminant Validity
Table 15. showed that each construct has Construc Reliability, Variance Extract and Discriminant Validity good as required.
Table 15.Calculation results Construct Reliability, Variance Extract and Discriminant Validity
Construct Value
Construct Reliability Variance Extract Discriminant Validity
Individuals 0.72 0.40 0.63
Physical 0.66 0.41 0.63
Social 0.70 0.65 0.65
Economics 0.76 0.72 0.72
Institutional 0.69 0.66 0.65
Entrepreneurship 0.85 0.67 0.67
Performance 0.66 0.63 0.63
CONCLUSIONS
1. The level of onion farmers entrepreneurship in Bantul categorized high overall average percentage of 70.87%. The high level of entrepre-neurship onion growers are very concerned with the characteristics of onion farming that requires intensive, capital intensive and high risk. Alloys of these is to encourage farmers to have attitudes that are indicators of entrepreneurship is a high need for achievement, having the confidence to be able to run the farm, the ability to bear risk, innovation, leadership, goal orientation and outcomes as well as market orientation.
2. Individual environmental factors, physical environment, social, economic and institutional positive and significant impact on the performance of entrepreneurial farmers and farming.It may prove that entrepreneurship is something that can be grown and developed with individual factors and environmental conditions that support. 3. Entrepreneurship farmer positive effect on
farm performance and has an important role in mediating the influence of individual and environmental factors on
farm performance. These results provide evidence for the idea that entrepreneurial farmers can be considered to be a new approach in improving farm performance.
LITERATURE CITED
Arikunto, S. 2002. Prosedur Penelitian Suatu Pendekatan Praktik. Rineka Cipta. Jakarta. Ghozali, Imam. 2002. Aplikasi Analisis
Multivariat dengan Program SPSS. Badan Penerbit Universitas Diponegoro.Semarang. Ghozali, Imam. 2011. Model Persamaan
Struktural Konsep dan Aplikas idengan Program Amos 19.0. Badan Penerbit Universitas Diponegoro. Semarang.
Kartika Sari, Maya. 2012. Efisiensi Produksi Bawang Merah di Kabupaten Brebes. Tesis. Program Pasca Sarjana Universitas Gadjah Mada. Yogyakarta. Tidak Dipublikasikan. Priyanto, Sony Heru, 2004. Pengaruh Faktor
Lingkungan, Kewirausahaan dan Kapasitas Manajemen Pada Petani Tembakau di Jawa Tengah. Disertasi. Tidak Dipublikasikan. Program Studi Ilmu Ekonomi Pasca Sarjana Universitas Brawijaya, Malang.