Introduction
There are many different opinions about the effect of population growth to influence economic growth. In general those opinions can be categorized into three groups (Bloom, Canning and Sevilla, 2003). The first group which is often called as pessimistic group argues that population growth will inhibit economic growth. The opinion of the pessimistic group is based on the limited natural resources. So the population growth stimulates the increase of demand on natural resources, which lead to the reduction of capital intensity. As consequence the effort to enhance the quality life and welfare is inhibated by population growth. For an illustration, a large
number of population need also huge investment in education, housing, health, food and etc. Therefore the investment tends to fulfill basic need (Capital Spreading) and cannot touch the level of investment, which may effect the improvement of quality life (Capital Deepening).
The second group, optimistic group, has an opposite opinion with pesimistic group. In this case, population growth may lead to economic growth. Natural destruction and famine are not caused by population growth, but it is more likely stimulated by poverty and financial deprivation for some people in the population. Therefore, it is not due to limited natural
POPULATION AND DEVELOPMENT:
The Effect of Demographic Transition in Human
Resources Development and Welfare in West Sumatra
Teguh Sugiyarto
1dan Desy Febrianty
2Intisari
Artikel ini bertujuan menggambarkan dampak dinamika penduduk yang memengaruhi pembangunan SDM dan kesejahteraan di Provinsi Sumatra Barat, dengan menggunakan data sekunder dari BPS Sumatra Barat. Hasil analisis menunjukkan dinamika penduduk yang ditunjukkan dengan indeks transisi demografi terkait secara signifikan dengan tingkat kesejahteraan. Kesejahteraan juga berhubungan dengan pencapaian di bidang pendidikan, penduduk yang bekerja di sektor pertanian, dan persentase penduduk yang bekerja selama 35 jam setiap minggunya. Ini mengindikasikan tingkat kesejahteraan berhubungan dengan tingkat pembangunan manusia. Ketika semua variabel digunakan untuk mengontrol hubungan transisi demografi dengan kesejahteraan, variabel yang terkait secara signifikan dengan indeks transisi demografi hanyalah persentase penduduk yang konsumsi makanannya 70 persen dari total pengeluarannya.
Kata kunci: dinamika penduduk, kesejahteraan, pembangunan manusia.
1 Staf Statistik Kesejahteraan, BPS Sumatra Barat.
resources. Julian Simon in The Ultimate Resource (www.juliansimon.org/writings/ ultimate_resource) stated that people are resourceful. In other words, with their capabilities, people can conquer nature through innovation and technologies. Not to mention, there will be new resources, which can substitute the old resources.
Later on, there will be a shift in supply and demand. A large population, due to high population growth, will create a high demand. As a result, the price of a particular good will increase as well. If this is followed by increasing the purchasing power, people may find substitution. Once again, it confirms that limited natural resources are not an obstacle.
The third group, neutralistic, argues that population growth and economic development are independent. This opinion appears because of the loss of negative relation between population growth and economic growth if several factors such as country size, openness to trade, educational attainment and quality of civil and political institution included in the analysis.
The importance of considering population dynamic and population change in order to determine development, therefore this paper will discuss the relationship between population change and development in West Sumatra. The discussion will be focused on the effect of demographic transition in human resources development and welfare by using regencies/ municipalities as an analysis unit.
Population and Development
Population can be functioned as a subject or object of development. As a subject, population plays an important role to determine
the success of development. High population productivities, which are determined by adequate knowledge and skills, enable to accelerate the speed of development. Unfortunately, not all population can be used as potential resources because of several factors. These factors can be grouped into internal factors (physical and non physical individual capabilities) and internal factors (economic condition, infrastructure and so forth).
On the other hand, population can enjoy results of development. Economic growths, availability of goods and services, and increase in purchasing power are condition which support population to have choices and live a qualified life. An increase in population welfare is usually followed by an increase in quality of individual physics and non physics. For example, an increase in purchasing power lets people improve the quality of food and having better health treatment. As a result of improved health may lead to improved non physics as well. At the same time, better non physics is followed by better peoples capabilities to have higher education.
economic growth, to provide infrastructure for people, such as educational and health facilities, it cannot be denied that economic development influences in increasing the quality of human rosurces. Secondly, qualified human resources influence economic development. People with high level of education and better level of health are the precondition for creating productive labour force. It is reflected from the capability to invent technology or from an effective and efficient organization.
The importance of population in development can also be showed mathematically from economic growth. Economic growth is seen from the increase of Gross National Product (GNP) per capita. It means that as denomitor of GNP, population may play a negative or positive role. In other word, GNP and population may have an inverse relationship. It is not surprise to see if population control is a popular policy among developing countries. At the same time, we also have to
bear in mind that as one of actors of development, population determines the GNP itself. In other words, a large number of population is not an obstacle for economic development if population can contribute significantly in generating GNP.
Besides physic and non physic quality, populations potency to accelerate development is influenced by population composition or structure. There are three factors that determine population dynamics, namely, fertility, mortality and migration. Theoretically, demographic transtition means population change from higher fertility and mortality to lower fertility and mortality and later on, it tends to stable. This change is started by decrease in mortality and followed by fertilitys decline. As consequence of fertility decline, the proportion of population at young age decreases. The decrease in mortality, due to better health, may expand life expectancy. In general, demographic transtition is followed by change in populations structure, which means
87,5
77,4
52,8 51,3
51,0 52,7
59,4 63,9
0,0 10,0 20,0 30,0 40,0 50,0 60,0 70,0 80,0 90,0 100,0
1980 1990 2000 2005 2010 2015 2020 2025
Depedency Ratio
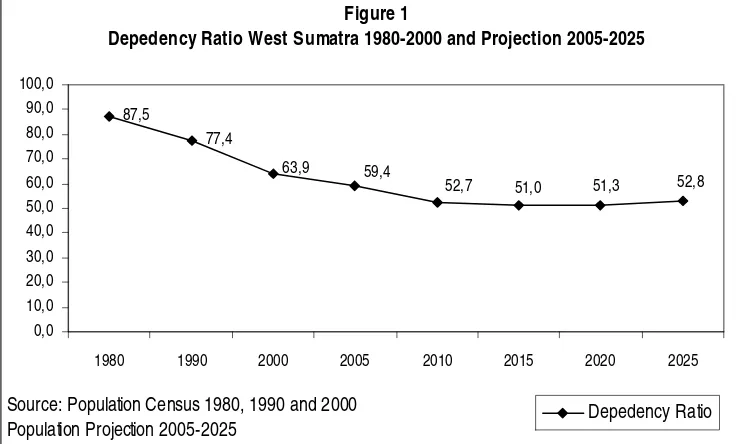
Figure 1
Depedency Ratio West Sumatra 1980-2000 and Projection 2005-2025
change from population is dominated by population at young age to population that is dominated by population at young age.
The positive impact of change in populations structure is the increase in dependency ratio, ratio between inproductive population age < 14 years and > 65 years and productive population age 15-64 years. This increase is also means that there is an increase proportion on labour force which is potential for economic growth. However, this condition may not give positive effect for economic growth unless it has been prepared in advanced.
Population Projection 2005-2025
The period when young dependency ratio is lower than old dependency ratio is called as demographic dividend (Bloom, Canning and Sevillia, 2003). During demographic dividend, it is a potential period to accelerate economic growth because of declining dependency ratio.
Unfortunately, window of opportunity does not last forever. Declining mortality and higher life expectancy may lead to higher old dependency ratio. If this condition is not anticipated well, it may threat the success of development. Demographic dividend ends when the dependency ratio starts to increase.
Changing in population structure which benefits development is occurring in West Sumatra. Population Census 1980 shows that dependency ratio in West Sumatra is 87.5. It indicates that in 1980 there are approximately 88 population at inproductive age per 100 population at productive ages. This figure decreases sharply to 77.4 and 63.9 in 1990 and 2000 respectively (Figure 1). Furthermore, based on population projection, dependency ratio continues declining until 2015 and starts to increase gradually in 2020 and 2025. The illustration above shows that window opportunity or demographic dividend in West Sumatra is not far to go.
79,6
69,7
55,2 50,8
43,9 41,6 40,0
38,8
14,0 11,3
9,4 8,8
8,9 8,7
7,8 7,9
0,0 10,0 20,0 30,0 40,0 50,0 60,0 70,0 80,0 90,0
1980 1990 2000 2005 2010 2015 2020 2025
Young Depedency ratio
Old depedency ratio
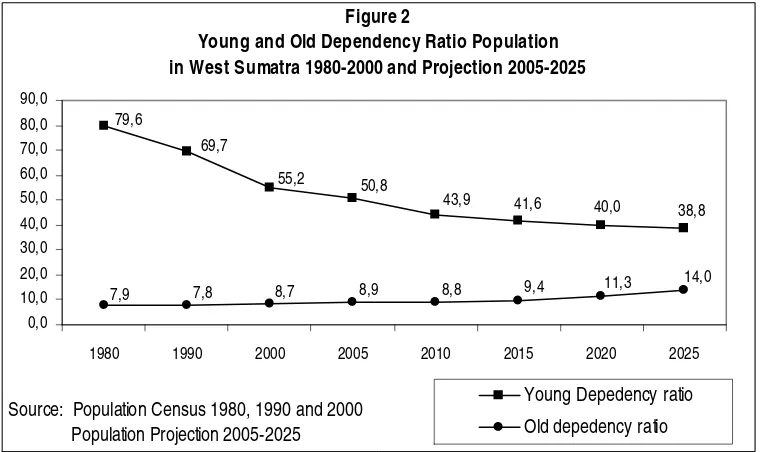
Figure 2
Young and Old Dependency Ratio Population in West Sumatra 1980-2000 and Projection 2005-2025
From the component which contructs dependency ratio shows that there is a process of population structure in West Sumatra. Young dependency ratio decreases significantly. On the other hand, old dependency ratio increases gradually. Old dependency ratio increases significantly in 2020 and 2025. This increase is more significantly than the decrease in young dependency ratio (Figure 2). If this condition continues, in the future, young dependency ratio may be lower than old dependency ratio.
Fertility and Welfare
Fertility has a positive relationship with population growth. On the contrary, mortality is one of the factors that control population growth. In addition, migration may have positive or negative relationship with population growth. Migration may have a positive relationship with population growth if in-migration (immigrants) is bigger than out-migration (emigrants).
Total fertility rate
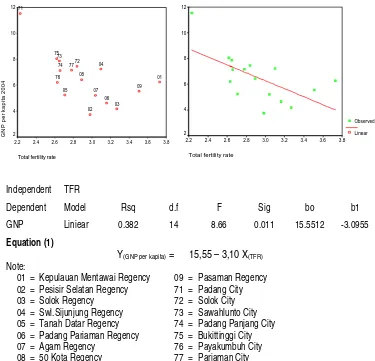
Scatter Diagram of Total Fertility Rate (TFR) and GNP per Capita of West Sumatra 2004
Independent TFR
04 = Swl.Sijunjung Regency 73 = Sawahlunto City
05 = Tanah Datar Regency 74 = Padang Panjang City
06 = Padang Pariaman Regency 75 = Bukittinggi City
07 = Agam Regency 76 = Payakumbuh City
In case of West Sumatra, population growth is mostly influenced by natural increase (fertility and mortality). Eventhough in West Sumatra there is merantau tradition (outmigration), negative net migration tends to decrease. This condition may occur because of reducing disparity among provinces in Indonesia. Uneven development among provinces in Indonesia may become one of the push factors of migration. Considering this condition, therefore, to find the impact of population growth on economic growth, it can be analysed through relationship between fertility and economic development. One of the indicators that usually indicates fertility is Total Fertility Rate (TFR). TFR reflects number of children which possibly beared by a woman at the end of her productive period if she follows a scheduled fertility pattern.
There are several reasons which explain the relationship between fertility and poverty or fertility and level of welfare. UNFPA (2004) in State of World Population 2004 says that member of households relates with welfare in several ways. Firstly, low fertility may cause small member of household, therefore income per capita is relatively higher than those whose member of household is bigger. Secondly, frequent births have a strong relationship with maternal mortality and morbidity. A loss of a mother may hinder household welfare because it may lose economic pontency, which is resulted from a mother. Thirdly, high fertility may prevent children educational attainment because a large member of household may reduce investment per capita in education. In addition, education attainment strongly relates to income. Fourthly, a small member of household may support a household to achieve a good level of children health. In future, these children may have a good productivity.
Figure 3 shows that TFR and GNP per capita tend to correlate negatively. City of Padang (71), which is the capital city of West Sumatra, has a highest GNP per capita and the lowest TFR. On the other hand, Kepulauan Mentawai regency has the highest TFR, but it does not have the lowest GNP per capita. Pesisir Selatan regency is a region with the lowest GNP per capita and TFR around 3 (3 is the average TFR in West Sumatra). These indicators (GNP per capita and TFR) illustrate that GNP per capita and TFR does not have a pure relationship. There are other variables or factors that influence their relationship. This condition is supported by simple linier regression between these two variables. Regression equation (1) shows that TFR impacts negatively on GNP per capita. However, TFR only explains 38.2 percent of total variance of TFR It means that around 60 percent of GNP variance is influenced by other factors.
Demographic Transition
of mortality. Phase four, fertility and mortality tend to stable at low level.
Population growth is still high at phase three. At this phase, the gap between fertility and mortality is relatively big. Futhermore, duration when this demographic transition occurs is different among regions. For example, in European countries, fertility and mortality decline gradually and it takes a long period of time. However, in developing countries, like Indonesia, demographic transition tends to occur in a relatively short period of time. It may happen because the transition is based on different factors. If in European countries, demographic transition happens gradually due to economic condition and advanced techonology in health, in developing countries, demographic transition occurs due to intervention such as family planning program. Eventhough, it has different process and different period of time, demographic transition creates a low population growth and relatively stable.
Demographic Transition and
Economic Development
One of measurement that measures level of demographic transition is index of
demographic transition (Ogawa and Tsuya, 1993). This index is constructed by three variables, namely fertilitity (TFR), mortality (represented by life expectancy/ eo) and level
of urbanization (u). Level of urbanization is percentage of population living in urban area. This variable is included as one of determine variables of demographic transition because urban areas, in general, have different characteristics from rural area such as level of economy, culture and so forth. The characteristics of urban area support positively to demographic transition. Furthermore, this index ranges from zero to 1, the higher index, the more advanced demographic transition.
In West Sumatra, Bukittinggi City and Padang City have the highest index of demographic transition. On the other hand, Kepulauan Mentawai has the lowest index of demographic transition. If this index is plotted with economic indicators or welfare indicator such as GNP per capita, percentage of population with consumption over food less than 70 percent of total expenditure, percentage of population with expenditure higher that average of province expenditure and percentage of poor people, it shows that population change has a strong relationship with economic development.
Table 1
Process of Demographic Transition
Phase Fertility Mortality Natural Increase
High Stationary High High Nil or very low
Early Expanding High Graduallly decline Low
Late Expanding Decline Decline more sharply than fertility High
Low Stationary Low Low Nil or very low
Declining Low Higher than fertility Negative
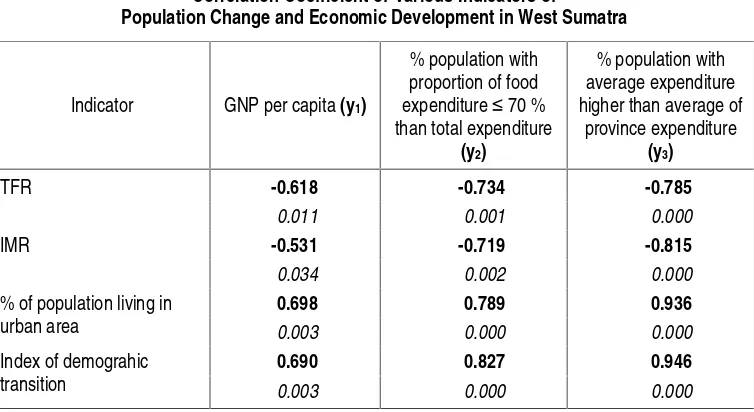
It can be seen from Table 2 that index of demographic transition and its components correlate significantly with economic indicators. Correlation coefficient also indicates that population dynamics which starts with declining in fertility and mortality has a positive impact on economic development and welfare. TFR and Infant Mortality Rate (IMR) have an inverse relationship with economic development which are represented by variables Y1, Y2 and Y3,
respectively. It means that if TFR and IMR are at low level, it may achieve a good level of welfare.
Correlation coeffiecient between percentage of population living in urban area and economic indicators has an inverse relationship with correlation coefficient of TFR and IMR. However, the analysis implication is the same, because in general, declining in TFR and IMR happen at the same time as an improvement in health, education, economy and urbanization as well.
Human Resources Development and
Economic Development
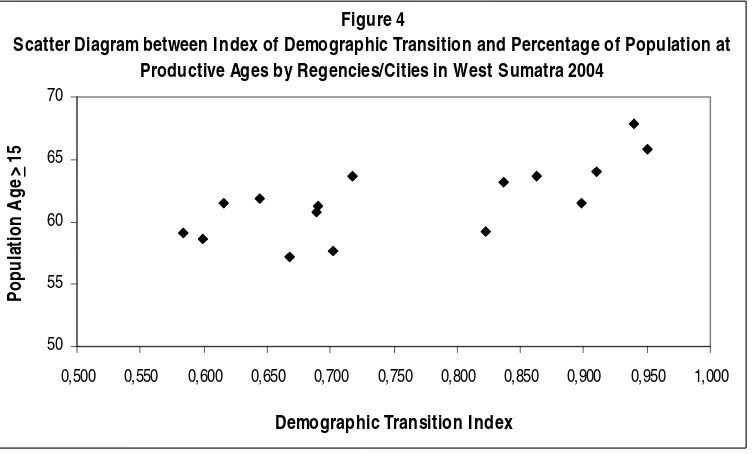
Demographic transition process which occurs at the same time as declining in population growth gives a positive impact on efforts to increase level of welfare. The demographic transition is followed by change in population structure. A slow population growth may cause a decrease in porportion of young population (age < 15). On the contrary, proportion of population at productive ages will tend to increase (Figure 4). This condition is so-called as demographic dividend and it is considered as determine factor between population change and development (Bloom, Canning and Sevilla, 2002). Thus, demographic transition is only a process of population dynamics and results population structure which supports development process. As the success of development itself, is determined by the quality of population at productive ages. Table 2
Correlation Coefficient of Various Indicators of
Population Change and Economic Development in West Sumatra
Indicator GNP per capita (y1)
% population with proportion of food expenditure 70 % than total expenditure
(y2)
% population with average expenditure higher than average of
province expenditure
(y3)
TFR -0.618 -0.734 -0.785
0.011 0.001 0.000
IMR -0.531 -0.719 -0.815
0.034 0.002 0.000
0.698 0.789 0.936
% of population living in
urban area 0.003 0.000 0.000
0.690 0.827 0.946
Index of demograhic
transition 0.003 0.000 0.000
Similar opinion also comes from Ogawa and Tsuya (1993). They say that a slow population growth that is due to declining in fertility may lead to increase labour force. On the other hand, a low fertility impacts on an increase in investment per labour force that later on may create qualified labour force. An increase in quality of labour force is started by an increase in educational attainment because education is a foundation to adapt a new innovation and technology.
The success of development to improve welfare is more likely determined by the quality of population as the actor of development. The availability of a large number of population at productive ages cannot quarantee for economic development. Especially, those population are not qualified. The successes of development are also determined by government policies and structure of government that enable to absorp and empower qualified population at productive
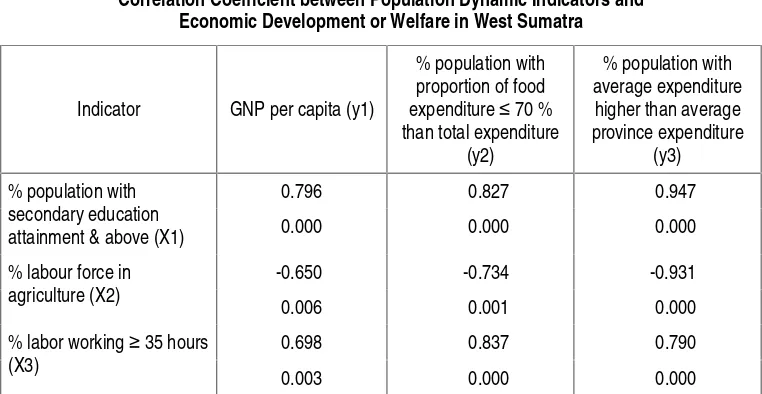
ages. In this analysis, it is used three variables to explain the quality of population and the use in development. These variables are percentage of population who complete secondary education and above, percentage of population working in agriculture, percentage of population working 35 hours per week and above. Percentage of population working in agriculture is used in analysis because economic development tends to be characterized by non-agriculture as leading economic sectors. In addition, agriculture is occupied by low quality of labour force, compared to manufacture and services sectors. Therefore, percentage of labour force in agriculture is expected to have a negative relationship with welfare and economic development. In contrast, the other two variables are expected to have a positive relationship.
Table 3 shows that these three variables have a significant correlation coefficient with 50
55 60 65 70
0,500 0,550 0,600 0,650 0,700 0,750 0,800 0,850 0,900 0,950 1,000
Demographic Transition Index
P
o
pu
la
ti
on
Age
>
15
Figure 4
Table 4
Partial Correlation Coefficients between Index
of Demographic Transition and Economic Development/Welfare
- PARTIAL CORRELATION COEFFICIENTS – Controlling for.. X1 X2 X3
INDEX Y1 Y2 Y3
INDEX 1.0000 -.1499 .5700 .2719 (0) (11) (11) (11)
P= . P= .625 P= .042 P= .369
Y1 -.1499 1.0000 -.0467 -.2784
(11) (0) (11) (11)
P= .625 P= . P= .880 P= .357
Y2 .5700 -.0467 1.0000 .6732
(11) (11) (0) (11)
P= .042 P= .880 P= . P= .012
Y3 .2719 -.2784 .6732 1.0000
(11) (11) (11) (0)
P= .369 P= .357 P= .012 P= .
(Coefficient / (D.F.) / 2-tailed Significance) " . " is printed if a coefficient cannot be computed
Table 3
Correlation Coefficient between Population Dynamic Indicators and Economic Development or Welfare in West Sumatra
Indicator GNP per capita (y1)
% population with proportion of food expenditure 70 % than total expenditure
(y2)
% population with average expenditure
higher than average province expenditure
(y3)
0.796 0.827 0.947 % population with
secondary education
attainment & above (X1) 0.000 0.000 0.000
-0.650 -0.734 -0.931 % labour force in
agriculture (X2)
0.006 0.001 0.000
0.698 0.837 0.790 % labor working 35 hours
(X3)
0.003 0.000 0.000
economic development indicators. Furthermore, the direction of the relation is also as expected. This result affirms opinion that the success of development is determined by the quality of human resources and their empowerment. To ensure that population dynamics is only a distant determinant for the success of development, it needs to measure correlation coefficient between index of demographic transition and welfare indicator by using X1, X2 and X3 as controlling variables. The result (Table 4) shows that index of demographic transition correlates significantly only with Y2 (p = 0.042). Other welfare indicators
do not correlate significantly. This condition indicates that population dynamics relate indirectly with welfare through intermediate variables.
Conclusion
To sum up, there are several points which explain the relationship between demographic transition, human resource development and welfare in West Sumatra, namely:
1. Regencies/cities which have low TFR and IMF have a relatively better welfare. This condition is consistent by using index of demographic transition analysis. Index of demographic transition is analyzed by using three variables, namely TFR, life expectancy and percentage of population living in urban area.
2. Population dynamics or demographic transition has a strong relationship with human resource development which is represented by education attainment, working hours and industrial origin.
Regencies/cities which have high index of demographic transition tend to have better quality of human resources.
3. Regencies/cities which have better quality of human resources tend to correlate positively with welfare.
4. By using quality of human resources as controlling variable, the relationship between index of demographic transition and economic development/welfare is no longer significant, except for Y2 (percentage of population with proportion of food expenditure d 70 percent than total expenditure).
The relationship of demographic transition, human resources and economic development/ welfare can be shown in a simple scheme as follows:
References
Bloom, D. E., David Canning and Jaypee Sevilla. 2003. The Demographic Devidend: A New Prespective on The Economic Consequences of Population Change. RAND.
BPS, BAPPENAS and UNFPA. 2005. Proyeksi Penduduk Indonesia 2000-2025. Jakarta: CV Gading Komunikatama.
BPS Sumatera Barat. 2005a. Proyeksi Penduduk (Estimasi Parameter Demografi) Propinsi Sumatera Barat 2003-2010.
BPS Sumatera Barat. 2005b. Sumatera Barat dalam Angka 2004.
Lucas, David and Paul Meyer. 2003. Beginning Population Studies (2nd
edition). Canberra: The ANU.
Ogawa, Naohiro and O. Noriko Tsuya. 1993. Demographic Change and Human
Resources Development in the Asia-Pacific Region: trends of the 1960s to 1980s and Future Prospects. In Ogawa et al (eds).
Human Resources in Development along the Asia-Pacific Rim. Singapore: Oxford University Press.
Ranis, Gustav and Frances Steward. 2001.
Growth and Human Development Comparative Latin America Experience
(online). Available on: http:// w w w . e c o n . y a l e . e d u / ~ e g c e n t e r / research.htm, 09 August 2004.
UNFPA. 2003. Population and Poverty: Achieving Equity, Equality and Sustainability. New York.