47 Agroland: The Agriculture Science Journal, 2016 June 3(1) : 47– 56 ISSN : 2407 - 7585
E-ISSN : 2407 - 7593
THE COMPETITIVENESS ANALYSIS OF COCOA COMMODITY
IN THE DISTRICT OF SIGI
Andika Ibrahim1), Marhawati Mappatoba2), Yulianti Kalaba2)
1) Student of Agribusiness Faculty of Agriculture. University of Tadulako. Palu.
2) Lecturer and Researcher at Department of Agribusiness Faculty of Agriculture. University of Tadulako. Palu.
ABSTRACT
This study aims to determine the competitiveness of cocoa commodity in the district of Sigi and the impact of government policies by analyzing the effects of cocoa price changes, cocoa’s input price and cocoa production to the competitiveness of cocoa. Data collection is done in Sub-district of Palolo with the number of respondents 31 farmers and also data supported by data from other related agencies. The research objective answered by using analytical tools Policy Analysis Matrix (PAM). Results of the study found that cocoa in Sigi District has comparative and competitive advantages with the value of Domestic Cost Ratio (DCR) and the Private Cost Ratio (PCR) i.e. 0.45 and 0.50. Results for Nominal Protection coefficient of output value (NPCO) is 0.88 and Nominal Protection Coeffisients of Input (NPCI) is 0.80 respectively show the government's policies are protective for cocoa farmers in the district, while the EPC value is 0.89 indicates the policy is inhibiting the production of farmers with effect of ratio 0.09. The sensitivity analysis of changes in production, the price of cocoa bean and Subsidized- fertilizer prices, shows that the change in production is an indicator that most influence the competitiveness of cocoa in Sigi District.
Key Words : Cocoa, competitiveness, governments policy, policy analysis matrix.
INTRODUCTION
Indonesian agricultural sector plays a great not only for the country itself, but Indonesian agricultural sector is also has quite important role in the world market, a wide range of Indonesia's main commodities such as palm oil, tea, coffee, cocoa, rubber became Indonesia's export commodities that superior in the world market. Cocoa is one of Indonesia’s commodity where in the global market Indonesia as the third largest country as cocoa producer in the world after Evory Coast (Cote d'Ivoire) and Ghana and in Asian countries Indonesia is the largest producer. Total production of Indonesia had reached 775.500 tons of cocoa beans (Food and Agriculture Organization, or FAO, 2013).
Based onentire recent data from Indonesia's cocoa production, the production
of cocoa can be seen decreased compared to production data from 2003 to 2006, which showed increased production. There are many factors that can affect the production of cocoa ranging from less developed cultivation technology optimally use the random seed seedlings, old age plants, pests and diseases, climate change and factor prices often fluctuate. In addition, low productivity is also due to the production of cocoa beans which 90 percent comes from small farmers who do not understand the concept of good cocoa crop cultivation, so the yields are sometimes not maximized (Asrul, 2013).
48
production each year fluctuates with total cocoa production of Indonesia is dominated by the production of the province of South Sulawesi and Central Sulawesi (BPS, 2015). Central Sulawesi is known as cocoa production centers for Indonesian state, therefore, it is appropriate to have research above average production of other districts. Sigi regency own productivity based on BPS Sulawesi is above average compared with other districts. In addition to that, some sources also stated that the cocoa beans from Sigi district has the most excellent quality of other districts in Central Sulawesi. Proved that for the manufacture of chocolate on chocolate house of Central Sulawesi,the raw materials are often derived from Palolo Sigi because some farmers central Sulawesi coupled with improved market opportunities are expected to bring prosperity to the cocoa farmers in particular to the farmers in Sigi. But as these opportunities are generally about cocoa Indonesia, it is also facing many problems such as the low-price export because the quality is not support, the quality of the result from a variety of pests as well as the drying process of unfermented-cocoa beans. The selling price of cocoa is also very important bearing on the productivity of cocoa Indonesia, especially for smallholders, but not all of the price price of cocoa beans received by farmers is not determined by the changes in supply and demand of the world cocoa. If the world price of cocoa has increased from the normal price due to limited supply of worldscocoa beans. The received priceby farmers may also increase and benefit for farmers. But in the process of trading, prices of cocoa is more likely to be determined by the traders, intermediaries and large companies that control the and guarantee the continuity of the amount of cocoa production. Through some of these opportunities, increasing productivity needs to be reviewed from various aspects that can affect the competitiveness of cocoa. Various obstacles and opportunities are discussed in the background of the research is the subject that is important to be used as guidelines for analyzing the competitiveness of the commodity as well as analysis in the face of high level of competition in the international market with a market share of cocoa growing from time to time.
49 simple random sampling technique with consideration that the cocoa farmers are homogeneous population.
Analysis of Data. To analyze the competitiveness of cocoa the research using the methods of Policy Analysis Matrix (PAM) Monke and Pearson (1989), the use of PAM is intended to determine the economic efficiency and incentives from government intervention, and its impact on farming activities. In the model PAM revenues, expenses and profits are distinguished by price private (market) and the social price. The second difference revenues, expenses and profits is classified by prices of private and social prices. Private prices is the price actually received by producers. While price is the price prevailing social if the market is in a
state of perfect competition. The difference between the private social prices is the number of transfers that is used to measure the impact of government policies (Wahyudi, 1989).
The shadow price is the price that is happening in the economy in a state of perfect competition in equilibrium (Gettinger 1982). Shadow price should
OERt = Official Exchange Rate
Xt = Export Value of Indonesia in the
Table 1. Policy Analysis Matrix (PAM)
Revenue Input Cost Profit
50
Values in each cell in the PAM matrix above for cocoa farming calculated in the period of the production cycle. From these data, futhervarious analyze indicators as follows:
1. Analysis of Comparative and
Competitiveness
a. Domestic Resource Cost Ratio : DRCR
= G/(E-F)
b. comparative advantage. Private Cost
Ratio : PCR = C/(A-B)
PCR is an indicator of private profitability which demonstrates the ability of the system to pay for domestic costs and remain competitive. The system is competitive if PCR <1. The smaller the value of PCR, means more competitive.
2. The Impact of Government Policy a. Output Policy
Nominal protection Coefficient on
Output: NPCO = A/E
NPCO is the level of government protection towards the domestic output. Policy is protective for output,
Nominal protection Coefficient on
Tradable Input : NPCI = B/F
NPCI is an indicator that shows the level of government protection towards the domestic input prices. If the value of NPCI <1, meaning there is a policy that is protective for tradable inputs.
c. Input dan Output Policy
Effective Protection Coefficient: EPC =
(A-B)/(E-F)
EPC is an indicator showing the degree of protection against the simultaneous output and tradable inputs. Policies are still protective, if or the addition/subtraction acceptance for their policies. sensitivity analysis conducted by: (1) Changing the size of the factors that the sensitivity analysis is important to do.
51 by the District Parigi Moutong. Palolo sub-district is geographically located between 0058'53 '' - 1014'31 '' LS and 119057''46 '' - 120021'26 '' BT. Overall Palolo subdistrict area is 629.09 km2 with a percentage of the BPD and the PKK. The village also has a village security personnel Hansip as many as 170 people. regions. According to agricultural census data District of Palolo that cocoa is a commodity with a presentation of the first order number as many as 5,393 peasant farmer population, followed by Commodity Rice as many as 2,013 farmers and 844 farmers of corn, pecan807 and 266 avocado growers and farmers.
52
Pesticides used for cocoa farming of various kinds, ranging from insecticides, herbicides and fungicides. The shadow price is assumed to be private prices according to research conducted by Anapu et al, (2003), Hardware gardens used farm cocoa consists of a hand sprayer, scissor cuttings, scissors branches, knife trim,
saws crop, reaping knives, knife wiwil, and buckets and sacks. The processing equipment consists of spades, winnowing, and sieve the sorting. Price shade garden equipment and the processing is the same as its market price, assuming no government policies that intervene in production and trade of these tools directly to the market
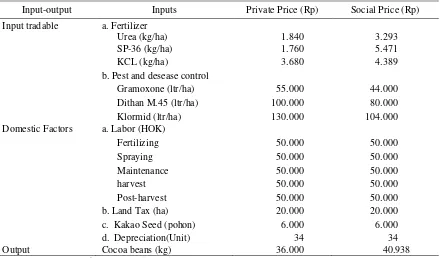
Table 2. Data of Physical Input-Output Cocoa Farmingin the District of Sigi 2015
Input-output (ha) Inputs Count
Tradable Input a. Fertilizer
Urea (kg/ha) 195,0
SP-36 (kg/ha) 97,5
KCL (kg/ha) 97,5
b. Pest and desease control
Gramoxone (ltr/ha) 4,9
Dithan M.45 (ltr/ha) 9,7
Klormid (ltr/ha) 9,7
Domestic Factors a. Labor (HOK)
Fertilizing 7,8
Spraying 11,7
Maintenance 11,7
harvest 46,8
Post-harvest 5,8
b. Land Tax (ha) 1,0
c. Kakao Seed (pohon) 853,9
d. Depreciation(Unit) 23,0
Output Cocoa beans (kg) 620
Source: Primer Data After Processed, 2015.
Table 3. Private and Social Price Input-output Cocoa Farming in the District of Sigi 2015
Input-output Inputs Private Price (Rp) Social Price (Rp)
Input tradable a. Fertilizer
Urea (kg/ha) 1.840 3.293
SP-36 (kg/ha) 1.760 5.471
KCL (kg/ha) 3.680 4.389
b. Pest and desease control
Gramoxone (ltr/ha) 55.000 44.000
Dithan M.45 (ltr/ha) 100.000 80.000
Klormid (ltr/ha) 130.000 104.000
Domestic Factors a. Labor (HOK)
Fertilizing 50.000 50.000
Spraying 50.000 50.000
Maintenance 50.000 50.000
harvest 50.000 50.000
Post-harvest 50.000 50.000
b. Land Tax (ha) 20.000 20.000
c. Kakao Seed (pohon) 6.000 6.000
d. Depreciation(Unit) 34 34
Output Cocoa beans (kg) 36.000 40.938
53
price of that happening is very small and approaching perfect competition and assumed to heve the same price.
According to Malian et al, 2004, in Andala et al, 2014 set the shadow price of labor is equal to the price prevailing private. The social price is the price of efficiency or cost of goods in the international market which to measure the true social opportunity cost which can be obtained by farmers. Social input prices obtained by price price border or border price. Social prices for fertilizer inputs and medicines using border price for which accounts have been written in the part before the table above. Each input is calculated price and the various factors that influence to obtain price as in the table above, for labor and seedlings used the same price for the whole input only from local resources and assumed the price has not changed for the price factor.
Competitiveness Analysis and Government Policy’s Impact to Cocoa in The District of Sigi. Analysis of
competitiveness and government policies can be analyzed using PAM matrix by multiplying the data analysis of private budget and social budget obtained through calculation tables private and social rates with data on production and land area in Sigi.
Table 5 shows the results of calculation of input costs and output in the business of cocoa in Sigi. Simply PAM consists of data on revenues and costs. Costs consist of tradable inputs and domestic input or non-tradable and to earn sufficient profits simply by subtracting between the reception and the two charges on the table. Results from the next table can be used to analyze the degree of cocoa farming profits both from the private and social price level as well as analyzing the impact of government policies in terms of both input and output means of production, as for the results of further analysis of the impact of government policy can be seen in the following table:
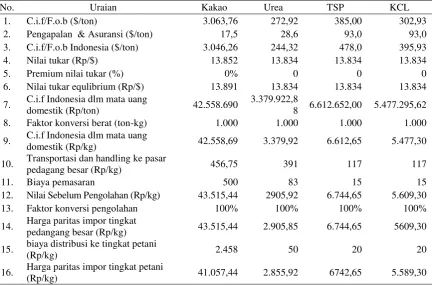
Table 4. Sosial Price of Inputs 2015
No. Uraian Kakao Urea TSP KCL
1. C.i.f/F.o.b ($/ton) 3.063,76 272,92 385,00 302,93
2. Pengapalan & Asuransi ($/ton) 17,5 28,6 93,0 93,0
3. C.i.f/F.o.b Indonesia ($/ton) 3.046,26 244,32 478,0 395,93
4. Nilai tukar (Rp/$) 13.852 13.834 13.834 13.834
5. Premium nilai tukar (%) 0% 0 0 0
6. Nilai tukar equlibrium (Rp/$) 13.891 13.834 13.834 13.834
7. C.i.f Indonesia dlm mata uang
domestik (Rp/ton) 42.558.690
3.379.922,8
8 6.612.652,00 5.477.295,62
8. Faktor konversi berat (ton-kg) 1.000 1.000 1.000 1.000
9. C.i.f Indonesia dlm mata uang
domestik (Rp/kg) 42.558,69 3.379,92 6.612,65 5.477,30
10. Transportasi dan handling ke pasar
pedagang besar (Rp/kg) 456,75 391 117 117
11. Biaya pemasaran 500 83 15 15
12. Nilai Sebelum Pengolahan (Rp/kg) 43.515,44 2905,92 6.744,65 5.609,30
13. Faktor konversi pengolahan 100% 100% 100% 100%
14. Harga paritas impor tingkat
pedangang besar (Rp/kg) 43.515,44 2.905,85 6.744,65 5609,30
15. biaya distribusi ke tingkat petani
(Rp/kg) 2.458 50 20 20
16. Harga paritas impor tingkat petani
(Rp/kg) 41.057,44 2.855,92 6742,65 5.589,30
54
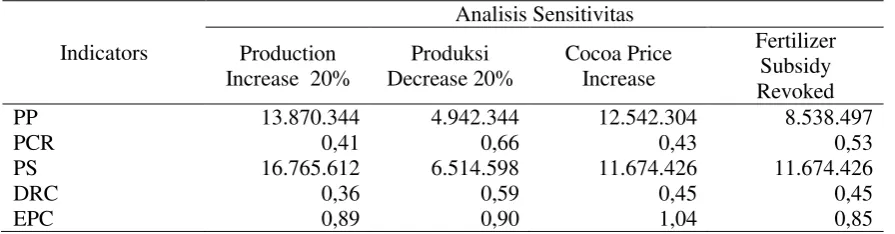
The sensitivity analysis is used to determine how much influence would happen if conditions change in terms of both price and production of the cocoa farming. The amendment is necessary to analyze due to frequent unexpected changes that will not be fixed. So that the results of the analysis will be referenced if the competitiveness of cocoa change when the economy changes occurred from cocoa farming. Some indicators of change such as changes in production of as much as 20 percent as it rose from 620 to 740 kg or down to 496 kg, as well as changes in the price of private and fertilizer inputs cocoa, below is a table of
the results of the analysis of some of the rate of change of the input and output of farm cocoa in Sigi.
Based on Table 7 it can be seen that all changes assumptions of change factors that production is the most influential than changes in fertilizer prices and the price of cocoa. Rated highest competitiveness 0.41 and 0.36 is obtained when production rose by 20 percent, and competitiveness value plummeted 0.66 and 0.59 when production fell 20 percent. The price of cocoa and fertilizer price also affecting but not so big compared to the production. When the subsidy was revoked, a decline in farmers' profits to
Table 5. Matrix of Policy Analysis Cocoa Farmingin the District of Sigi
Revenue Input Cost Profit
Tradable Domestic
Private 22.320.000 3.399.058 9.514.598 9.046.344
Social 25.455.929 4.266.905 9.514.598 11.674.426
Divergences (3.135.929) (867.847) - (2.268.082)
Sourcer: Primer Data After Processed, 2015.
Table 6. Indicator Assessment of Policy Analysis Matrix (PAM)
No. Indicator Value
1 Domestic resource cost ratio (DRC) 0,45
2 Private Cost Ratio (PCR) 0,50
3 Output Transfer (OT) (3.135.929)
4 Nominal Protection Coefficient Outputs (NPCO) 0,88
5 Input Transfer (TI) (867.847)
6 Nominal Protection Coefficient Inputs (NPCI) 0,80
7 Effective Protection Coeffisient (EPC) 0,89
8 Subsidy Ratio Percentage (SRP) (0,09)
Sourcer: Primer Data After Processed, 2015.
Table 7. Against Sensitivity Analysis Cocoa Commodity Competitiveness in Sigi
Indicators
Analisis Sensitivitas
Production Increase 20%
Produksi Decrease 20%
Cocoa Price Increase
Fertilizer Subsidy Revoked
PP 13.870.344 4.942.344 12.542.304 8.538.497
PCR 0,41 0,66 0,43 0,53
PS 16.765.612 6.514.598 11.674.426 11.674.426
DRC 0,36 0,59 0,45 0,45
EPC 0,89 0,90 1,04 0,85
55
Rp. 8,538,497, -. It is quite influential when assuming the subsidy is revoked and the production of cocoa farmers unchanged.
CONCLUSIONS AND RECOMMENDATIONS Conclusions.
The competitiveness of a commodity is an indication of the success of a region in pursuit of the commodity. The results of this study aimed to analyze the level of success of a region in pursuit of a commodity. The conclusions of the study are as follows:
1. Commodity cocoa in Sigi has comparative and competitive advantages as indicated by the calculation results values of PCR and DRC that are 0.45 and 0.50.
2. The government's policy is vital to the competitiveness of cocoa and it is protective for cocoa farmers in Sigi. This is shown by NPCO and NPCI value of 0.88 and 0.80. While the EPC value of 0.89 indicates a policy that is inhibiting the production of farmers with effect ratio of 0.09.
3. Based on the results of the sensitivity analysis between changes in production, changes in the price of cocoa and the removal of subsidies on fertilizers for farmers. Then change the highest on the competitiveness of cocoa is a change in production, while intensive cocoa prices and removal of subsidies on fertilizers is not so much affect the competitiveness of cocoa.
Recommendations.
Generally cocoa in Sigi
competitiveness comparative, competitive
and supported by government policies that are protective for farmers, but there are still enough rate between private costs and social in the farming cocoa, and therefore the recommendation in research are as follows:
1. In general, the competitiveness of cocoa in Sigi has strong competitiveness both comparative and competitive, therefore competitiveness is appropriate to be maintained or even enhanced. Given the many opportunities still available and has not been utilized mainly for the farmers themselves.
2. The government's policy is protective for farmers, especially export restrictions
to protect the price of cocoa in the country and prices are subsidized
fertilizer, but the indicators are inhibiting policies. That is because the price is protective, but only for large-scale exports to the trader, but prices at the farm level is still low. Similarly, the fertilizer subsidy, but is still limited and the restrictions on the circulation of non-subsidized fertilizer. So it needs special assessment for policy makers in order to fix the existing policies so that the farmer's right on target itself. This is especially true for farmers in Sigi. 3. The results of the sensitivity analysis
gives an overview specifically for growers and the government that the factors that affect most on the competitiveness of cocoa is the change in production, so the need for special attention to farmers how production can be further enhanced given that the average productivity in Sigi which was below the optimal and is still likely to be increased.
REFERENCES
Asrul Laude (2013). Agribisnis Kakao. Edisi Pertama. Jakarta: Media bangsa.
Badan Pusat Statistik (BPS) 2015. Produksi Tanaman Perkebunan Provinsi. Jakarta : BPS.
Food and Agriculture Organization of the United States (FAO). 2013. Crops Production Data Cacao in View Countries. http://faostat3.fao.org.
56
International Cacao Organization (ICCO). 2016. ICCOQuarterly Bulletin of Cocoa Statistics. Vol. XLII. No. 1 Cocoa year 2015/16.
Kadariah 1988. Evaluasi Proyek (Analisa Ekonomis). Edisi Dua. Lembaga Penerbit Fakultas Ekonomi Universitas Indonesia. Jakarta.
MewaAriani, Andi Askin dan Juni Hestina, 2003. Analisis Daya Saing Usatani Tebu di Provinsi Jawa Timur. Pusat Penelitian dan Pengembangan Sosial Ekonomi Pertanian. Departemen Pertanian. Bogor.
Monke, E.A and S.R Pearson. 1989. The Policy Anayisis Matrix for Agriculture Development. Cornell University Press. Ithaca.
Nash, CA dan Pearce, DW. 1981. The Social Appraisal of Project. The Mac Millan Press. London.
Wahyudi, A., 1989. Analisis Keunggulan Komparatif Usahatani Lada Hitam Lampung dan Lada Putih