ISSN 0024-9521
IJG Vol. 46, No.1, June 2014 (78 - 88) © 2014 Faculty of Geography UGM and he Indonesian Geographers Association
Estimation of Carbon Stock Changes in Above Ground Woody
Bio-mass due to Volcano Pyroclastic Flow and Pyroclastic Surge
Selli Fidi Yani Wardani, L. M. (Louise) M. van Leeuwen
Received: 22 05 2014/ Accepted: 29 05 2014 / Published online: 30 06 2014 © 2014 Faculty of Geography UGM and he Indonesian Geographers Association
Abstract Merapi Volcano National Park (MVNP) is susceptible to volcanic hazard since it is located around Merapi volcano, especially pyroclastic low. Carbon sequestration in the national park is becoming a priority of forest develop-ment as stipulated in Governdevelop-ment Regulation Number 28 Year 2011 and Number 49 Year 2011. his study aims to know the efect of pyroclastic event to carbon stock in MVNP. In this study the natural carbon rate recovery in MVNP was estimated to determine the growth rate of natural carbon recovery in MVNP. To estimate carbon stock change in MVNP, 2006 QuickBird and 2011 GeoEye satellite imageries were used. Object based image segmentation of high resolution satellites imagery could recognize physical dimensions of individual trees such as crown projection area (CPA). In this study, carbon stock was derived using allometric equation based on measured diameter at breast height (DBH) in the ield. A model was developed to estimate carbon stock based on DBH estimation in the ield and segmented CPA from the image. Based on the segmentation process, the model of CPA and Carbon in MVNP was developed. he F score which indicate the accuracy of segmentation of needle leaf and broadleaved of 2011 GeoEye were 0.68 and 0.54 respec-tively. Logarithmic model which has 6.37 % error was used to estimate broadleaved carbon stock while quadratic model which has 10.31 % error was used to estimate Pine tree carbon stock in MVNP.
Abstrak Taman Nasional Gunung Merapi (TNGM) memiliki kerawanan yang tinggi terhadap ancaman bahaya vulkanik
karena terletak di sekitar Gunung Merapi, terutama akibat aliran piroklastik. Penyerapan karbon di taman nasional ini menjadi prioritas pengelolaan hutan sebagaimana diatur dalam Peraturan Pemerintah Nomor 28 Tahun 2011 dan Nomor 49 Tahun 2011. Penelitian ini bertujuan untuk mengetahui pengaruh aliran piroklastik terhadap stok karbon di TNGM. Dalam penelitian ini, pemulihan karbon alami di TNGM diperkirakan untuk menentukan tingkat pertumbuhan pemuli-han karbon alami. Untuk memperkirakan perubapemuli-han stok karbon di TNGM, digunakan citra QuickBird tahun 2006 dan GeoEye tahun 2011. Segmentasi citra berbasis obyek menggunakan citra resolusi tinggimampu mengenali dimensi isik pohon secara individu, misalnya Crown Projection Area (CPA). Dalam studi ini, stok karbon diperoleh menggunakan persamaan alometrik berdasarkan Diameter at Breast Height (DBH) di lapangan. Sebuah model dikembangkan untuk memperkirakan stok karbon berdasarkan estimasi DBH di lapangan dan CPA tersegmentasi dari citra. Berdasarkan proses segmentasi tersebut, dikembangkan model CPA dan Karbon di TNGM. Hasil F skor menunjukkan akurasi segmentasi vegetasi berdaun jarum dan berdaun lebar pada citra GeoEye 2011 adalah 0,68 dan 0,54. Model logaritmik memiliki nilai error 6,37% dan digunakan untuk memperkirakan stok karbon vegetasi berdaun lebar, sedangkan model kuadrat dengan error 10,31% digunakan untuk memperkirakan stok karbon tanaman pinus di TNGM.
Keywords: Merapi Volcano National Park, carbon stock, crown projection area.
Kata kunci: Merapi Volcano National Park, stok karbon, area proyeksi mahkota.
Climate change is indicated by warmed of global system. his phenomenon is strengthened by the Intergovernmental Panel on Climate Change (IPCC) study [2007] that shows the increase in average temperature of air and ocean, the melting of snow and ice and the rise of global average sea level. he main cause of climate change is the increase of green house gasses (GHG) in the atmosphere. CO2 is the main
GHG which is sourced from the burning of fossil fuel,
Selli Fidi Yani Wardani
Ministry of Forestry, Republic of Indonesia Email: [email protected] L. M. (Louise) Van Leeuwen
Faculty of Geo-information Science and Earth Observation, University of Twente, the Netherlands
agriculture, and land use changes and deforestation [IPCC, 2012].
One way to control climate change and to reduce green house gas increase is to maintain the integrity of natural forests and increase the density of trees outside the forest. Vegetation is a carbon sink which stores more carbon than it emits. Forest is the best carbon sink since it stores carbon in large amounts [IPCC, 2007]. Natural hazards such as volcanic hazard are natural phenomena which can reduce the amount of carbon stored in vegetation because it can cause the death and disintegration of vegetation/biomass.
Merapi volcano is one of the most active volcanoes in Indonesia, well known for its pyroclastic low. Merapi volcano erupts 4-6 years periodically since 19th century
with Volcanic Explosivity Index (VEI) ≤ 2. VEI is index that explains the scale of explosive eruption. Costa et al. [2012] recorded that the Merapi eruptions in 1832, 1849, 1930, and 1961 are moderate eruption with VEI 3, Merapi eruptions in 1822, 1872 are large eruption with VEI 4. he 2010 eruption is the most explosive in the last century with VEI 4 [Lavigne et al., 2000; Costa et al., 2012; Suronoet al., 2012]. VEI 1, 2, 3 and 4 give small, moderate, moderate – large and large efect respectively [Newhall and Self, 1982]. he furthest distance of VEI 1, VEI 2, VEI 3 and VEI 4 pyroclastic low are 3.2 km, 7 km, 12 km and 20 km from the crater respectively. Almost half of history of Merapi volcano eruption recorded that Merapi erupted associated with pyroclastic event [Voight, 2000].
Pyroclastic low and pyroclastic surge are the examples of direct volcano hazard [Tilling, 2005]. Crandell et al. [1985] and Tilling [2005] diferentiated pyroclastic low and pyroclastic surge based on its material. he solid material in pyroclastic surge is less than pyroclastic low and it has low density. Pyroclastic low and pyroclastic surge originated from explosive eruption and dome collapse [Crandell, 1985; Newhall, 2000]. Pyroclastic low streams and touches the ground surface and follows the topographic depression such as valley. he maximum temperature when it deposited could be reached 350 °C to more than 550 °C. he size of pyroclastic low and pyroclastic surge afected area is depending on the energy eruption and the low velocity of pyroclastic low and pyroclastic surge. he efect of pyroclastic low and pyroclastic surge to environment depend on its falling materials, the temperature and the distance of area to the volcano [Crandell et al., 1985; Tilling, 2005].
he impact of 2010 Merapi eruption on the ecosystem is huge. he Bureau of Merapi Volcano National Park [2011a] reported that over 2000-2500 Ha (31-39%) of Merapi Volcano National Park (MVNP) ecosystem which is located on Merapi volcano was destroyed. As a national park, MVNP has an important role as nature conservation area and provider of environmental services, as stipulated in Government Regulation Number 28 Year 2011 and Number 49 Year 2011. In addition, carbon sequestration in the national park is becoming a priority of forest development in the future. his study aims to know the efect of pyroclastic low and surge to carbon stock in MVNP.
Satellite imagery for the estimation of carbon stock is widely used recently. he most accurate method to estimate carbon stock is destructive method by cutting and weighing the tree parts. Since it is time consuming and only restricted to small areas and small size of tree sample, the allometric equation which correlates tree diameter at breast height (DBH) or others tree variable with standing wood volume or total biomass can be applied [Ketterings et al., 2001].
Medium resolution optical data is more appropriate to generate carbon stock in a simple homogeneous
forest stand structure than in a complicated forest stand [Lu, 2005]. On the other hand, physical dimensions of individual trees are recognized by high-resolution satellites which can be correlated to above ground biomass. High resolution satellite imagery such as QuickBird, IKONOS, WorldView, and GeoEye can distinguish individual tree crowns so correlation between physical dimensions of trees, such as tree and Yogyakarta Province. he 6410 hectare-MVNP is established by government through he Forestry Ministerial Decree Number 134/MENHUT-II/2004 dated 4th of May 2004.
Figure 1 shows the pyroclastic low deposit over the past 95 years. More than half area of MVNP located in area with range 7 km from the crater. West part, southwest and small area in south part of MVNP is located in range <12 km from the crater (Figure 1).
Two satellite data of MVNP that were used in carbon stock change in MVNP due to pyroclastic low and pyroclastic surge. he rehabilitation map of MVNP from Bureau of Merapi Volcano National Park [2011b] was used to identify the rehabilitation area and the land cover map of MVNP was used to identify the broadleaf and Pine trees areas. he map of 2010 pyroclastic low and pyroclastic surge [Darmawan, 2012] was used to identify the area afected by 2010 eruption.
2.he Methods
To get the model of CPA and DBH, the ieldwork was done by measuring the DBH and crown diameter of the tree which was the same with the segmented tree. he CPA which was obtained from the image is the result of the segmentation process. he segmentation process was run using eCognition sotware. Segmentation process was applied both to 2006 Quickbird and 2011 Geoeye. he image was segmented into objects based on several criteria such as scale, color, smoothness and compactness. Object based image segmentation of high resolution satellites imagery could recognize physical dimensions of individual trees such as crown projection area (CPA).
ESTIMATION OF CARBON STOCK Selli Fidi Yani Wardani et al.
80 third class has a purpose to determine distribution of broadleaf and needle leaf at the third level.
he result of segmentation was validated by itting the segmented CPA with manual digitizing CPA of the trees. he result of segmentation was categorized as matching with the real object if it overlaps by at least 50 % with the result of manual digitizing. Figure 2 shows the condition of 50% matching object. Figure 2a is the condition of overlapping object more than 50 %, Figure 2b represents the matching objects which has same size and shape but difer in position, Figure 2c and 2d illustrates the overlapped object which match in position but difer in spatial extent [Zhan et al., 2005].
Li et al. [2012] categorized the accuracy of segmentation into 3 types which are true positive (TP) if the object is correctly segmented, false negative/ omission error (FN) if the object assigned to the nearby object, the last type is false positive/commission error (FP) if the object does not exist but it was segmented. TP, FN and FP will lead to perfect segmentation, under-segmentation, and over-under-segmentation, respectively.
Goutte and Gaussier [2005]. Sokolova et al. [2006], as cited in Li et al. [2012] calculated the accuracy based on the value of recall/r which represents object detection rate (Equation 1), precision/p which
represents the correctness of the detected object (Equation 2), and F-score which indicates the overall accuracy taking both commission and omission errors into consideration (Equation 3). he range of r, p and F score is 0 – 1. Higher values indicate higher accuracy of segmentation.
Figure1. Merapi Pyroclastic Flow Distribution Hystory Map 1911 - 2006 (Rupa Bumi Indo-nesia Map, Kaliurang Sheet, 1:25000; Directorate General of Forestry Planning, Ministry of
Forestry; Geology Agency; Darmawan, 2012)
Figure 2. he overlapping Object in Segmentation Process [Zhan et al., 2005]
r=TP/(TP+FN )(equation 1)
p=TP/(TP+FP)(equation2)
Modiied Brown allometric equations were used to estimate above ground woody biomass in MVNP. Since forest cover in MVNP are Pine forest, mixed forest and secondary forest Brown equation for tropical moist hardwoods (Equation 4) and tropical pines (Equation 5) [IPCC, 2003] were applied. MVNP which has average rainfall by 2500 – 3000 mm/year [Bureau of Merapi Volcano National Park, 2011c] is classiied as moist climatic zone [Brown, 1997].
where:
Y= aboveground dry matter, kg (tree)-1 DBH =diameter at breast height, cm ln = natural logarithm
exp = “e raised to the power of ”
he number of needle leaf trees which were measured in the ield is 60 and the number of broadleaf trees that were measured is 58 trees. he trees which were collected were the same trees with the result of crown segmentation of 2011 GeoEye satellite imagery. he 60% of the measured ield data (DBH) was used to build the model and 40% was used to validate the model [Gill et al., 2000].
Linear, logarithmic, quadratic and power regression were applied to build model of DBH and CPA regression and CPA and carbon regression. Error of the model developed was calculated to estimate the diference of carbon stock model and carbon stock of ield measurement (Equation 6). he model which has the lowest error was chosen to estimate the carbon stock [Chave et al., 2005].
Areas of pyroclastic low and pyroclastic surge were divided into 3 (three) classes based on the surface distance to the Merapi volcano crater. he size of sampling plots was 10 m x 10 m for poles, dead woods and dead trees with diameter 10 cm to < 20 cm. Trees, dead woods and dead trees with diameter ≥ 20 cm were registered in plot 20 m x 20 m. he study focused on pole and tree stages since they give high contribution on carbon stock. Seedlings give less contribution to carbon stock [Mandal et al., 2012].
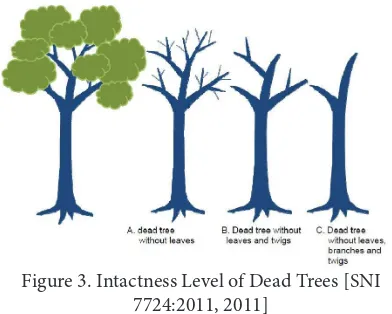
he dead trees biomass can be estimated by multiplying the allometric equation with correction factor with the intactness of the dead tree [Manuri et al., 2011]. he intactness factor of dead trees without leaves (Figure 3a) is 0.9, the intactness factor of dead trees without leaves and twigs is 0.8 (Figure 3b) and the intactness factor of dead trees without leaves, branches and twigs is 0.7 (Figure 3c).
To estimate carbon of the dead wood, diameter of base and tip and the total length of dead wood were measured. Dead wood biomass is inluenced by its volume and its wood density (Equation 7 and Equation 8) [SNI 7724:2011, 2011].
Note:
Vdw is the volume of dead wood (m3);
dbis the diameter of the base of the dead wood (cm); dtis the diameter of the tip of the dead wood (cm); pis the length of the dead wood (m);
π is 22/7 or 3.14
Bdw is the dead wood biomass (kg); WDdw is the dead wood density (kg/m3).
he wood density of dead wood was generated by collecting the wood samples from the ield and analyzed in laboratory. he wood samples were classiied based on their decomposition levels which are good, moderate and decomposed. he numbers of wood samples for each decomposition level were 10. Based on the laboratory analysis, the wood densities of dead wood with good, moderate and decomposed level of wood decomposition rate were 0.65, 0.56 and 0.55 kg/m3 respectively.
he rate of carbon recovery was established based on relation between age and carbon stock of recovery area. Age was derived from pyroclastic low events at diferent times by delineating the historic map of pyroclastic low in MVNP. he estimation of carbon stock in recovery area was done by applied the developed model of CPA-carbon of broadleaved to recovery area.
he artiicial carbon rate recovery cannot be measured since the rehabilitation activity in MVNP was just conducted in 2011 and 2012. herefore the activities carried out in the rehabilitated area was monitoring of carbon stocks. he estimation of rehabilitation trees was done in Kalikuning, Selo, Deles (area rehabilitation 2011) and Ngargomulyo (area rehabilitation 2012).
Figure 3. Intactness Level of Dead Trees [SNI 7724:2011, 2011]
Error=100x(Carbonpredict-Carbonmeasured)/Carbonmea-sured (Equation 6)
Bdw=Vdw x WDdw (equation 7)
Vdw=0.25 ∏(db+dt/2 x100)2 x p (equation 8) Y=exp[-2.289+2.649.In(DBH)-0.021.( In(DBH))2](equation 4)
ESTIMATION OF CARBON STOCK Selli Fidi Yani Wardani et al.
82
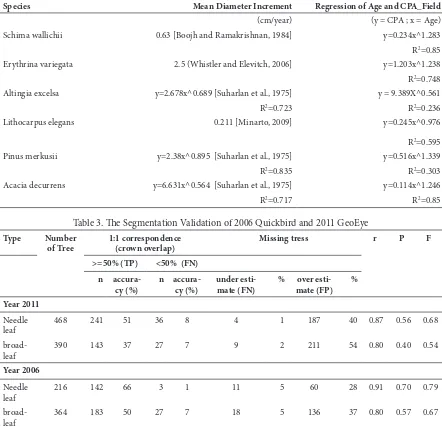
Table 2. Mean Diameter Increment and Relation of Age and CPA Field of Dominant Trees in MVNP
Species Mean Diameter Increment Regression of Age and CPA_Field
(cm/year) (y = CPA ; x = Age)
Schima wallichii 0.63 [Boojh and Ramakrishnan, 1984] y=0.234x^1.283
R2=0.85
Erythrina variegata 2.5 (Whistler and Elevitch, 2006] y=1.203x^1.238
R2=0.748
Altingia excelsa y=2.678x^0.689 [Suharlan et al., 1975] y = 9.389X^0.561
R2=0.723 R2=0.236
Lithocarpus elegans 0.211 [Minarto, 2009] y=0.245x^0.976
R2=0.595
Pinus merkusii y=2.38x^0.895 [Suharlan et al., 1975] y=0.516x^1.339
R2=0.835 R2=0.303
Acacia decurrens y=6.631x^0.564 [Suharlan et al., 1975] y=0.114x^1.246
R2=0.717 R2=0.85
Table 3. he Segmentation Validation of 2006 Quickbird and 2011 GeoEye
Type Number of Tree
1:1 correspondence (crown overlap)
Missing tress r P F
>=50% (TP) <50% (FN)
n accura-cy (%)
n accura-cy (%)
under esti-mate (FN)
% over esti-mate (FP)
%
Year 2011
Needle leaf
468 241 51 36 8 4 1 187 40 0.87 0.56 0.68
broad-leaf
390 143 37 27 7 9 2 211 54 0.80 0.40 0.54
Year 2006
Needle leaf
216 142 66 3 1 11 5 60 28 0.91 0.70 0.79
broad-leaf
364 183 50 27 7 18 5 136 37 0.80 0.57 0.67
he DBH and CPA of saplings, poles and trees of dominant trees in MVNP were collected in the ield in order to know the pattern of the growth of DBH, CPA and carbon of dominant trees in MVNP.
Based on the ieldwork, the identiied dominant trees in MVNP are Schima wallichii, Erythrina variegata, Lithocarpus elegans, Pinus merkusii, Altingia excelsa and Acacia decurrens. he DBH and CPA of sapling were measured in random 5 m x 5 m plots and poles were measured in random 10 m x 10 m plots. By
knowing their diameter increment their age will be generated. he diameter increment of dominant trees was obtained based on literature study.
he relation of DBH and age of Pinus merkusii, Altingia excelsa and Acacia decurrens was develop based on the yield table. Relation between DBH and age of Schima wallichii, Erythrina variegata, and Lithocarpus elegans was develop based on DBH measurement in the ield because they are not in the list of yield table (Table 2).
Table 1. Sampling Plot Number of Pyroclastic Flow and Pyroclastic Surge Area and heir Distribution
Location Surface Distance (m) ID Number of Plots Area (ha)
Pyroclastic Flow > 3973 - 5297 Class 2 15 94
Pyroclastic Flow > 5297 - 6620 Class 3 15 23
Pyroclastic Flow > 6620 - 7945 Class 4 15 31
Pyroclastic Surge > 2650 - 3973 Class 1 15 98
Pyroclastic Surge > 3973 - 5297 Class 2 15 213
Table 4. Developed Model of DBH-CPA and CA-Carbon of Broadleaved and Pine Trees
Developed Model R2 Error (%)
Broadleaved a) DBH-CPA
-Linear (DBH=-0.069CPA+42.121) 0.023 3.18
-Logarithmic (DBH= -2.213lnCPA+46.426) 0.015 2.67*
-Quadratic (DBH =-0.001CPA^2+0.048CPA+39.990) 0.028 6.55
-Power (DBH = 46.652CPA^-0.083) 0.036 11.85
b) CPA-Carbon
-Linear (Carbon=-0.964CPA+898.544) 0.001 7.28
-Logarithmic (Carbon=10.648lnCPA+819.302) 0.00007 6.37*
-Quadratic (Carbon=-0.13CPA^2+16.791CPA+576.517) 0.027 16.68
-Power (Carbon=912.006CPA^-0.209) 0.037 50.73
Pine
a) DBH-CPA
-Linear (DBH=0.104CPA+41.462 R2=0.053) 0.053 5.97
-Logarithmic (DBH=5.461lnCPA+27.457 R2= 0.097) 0.097 6.12
-Quadratic (DBH=-0.005CPA^2+0.725CPA+31.065 R2=0.207) 0.207 2.86*
-Power (DBH=31.359CPA^0.098 R2=0.077) 0.077 10.00
b) CPA-Carbon
-Linear (Carbon=3.954CPA+504.154) 0.063 15.28
-Logarithmic (Carbon= 203.547lnCPA-14.874) 0.110 15.59
-Quadratic (Carbon=-0.186CPA^2+26.013CPA+134.692) 0.221 10.31*
-Power (Carbon= 240.370CPA^0.222) 0.068 33.89
Table 5. Carbon stock of Broadleaved and Pine Tree Based on CPA-Carbon Developed
Year Total Carbon Stok (kg/ ha)
Carbon in Unafected Area(kg/ha)
Carbon Stock (kg/ha)
Pine Broadleaves Pine Broadleaves Pyroclastic Flow Area Pyroclastic Sugre Area Pine Broadleaves Pine Broadleaves
2011 142,782 142,699 143,528 145,951 9,414 48,343 72,402 128,473
2006 114,336 121,336 116,301 121,676 102,673 50,497 113,849 152,920
4. Result and Discusion
he validation of segmentation based on Zhan et al. [2005] and Li et al. [2012] is presented in Table 3. It was done in order to know the accuracy of segmentation. F score which indicate the accuracy of segmentation was above 0.5 means that the accuracy of algorithm which was used to segment the object can be applied.
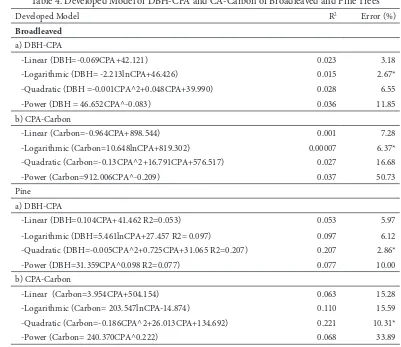
Developed model of CPA-Carbon Broadleaved and Pine Trees based on Linear, Logarithmic, Quadratic and Power regression and its error are presented in Table 4. he Table 4 shows that logarithmic regression model has the lowest value of error for CPA-Carbon relation of broadleaves trees (equation 9). And the model which has the lowest error for CPA-Carbon relationship of Pine trees is quadratic (polynomial order 2) (equation 10). hus, the models used in this research are:
Developed Model of CPA-Carbon Relation of Broadleaved Trees
Developed Model of CPA-Carbon Relation Pine Trees
Carbon stock of Broadleaved and Pine Tree is presented in Table 5. Based on the ield observation, dead trees and dead wood which were found in the ield was Pine trees. So Pine allometric equation was used to estimate the dead trees carbon stock. In the pyroclastic low area there were no poles and trees. he only tree stage that was found in the pyroclastic low area was Acacia decurrens in sapling stage. Acacia decurrens is the pioneer which is grown in MVNP ater the eruption.
Carbon=10.648lnCPA+CPA+819.302 (equation 9)
ES
TIMA
TI
O
N O
F CARB
O
N S
T
O
CK
S
elli Fidi Y
ani W
ar
d
ani et a
l.
84
Table 6. Total Sampled Carbon Stock and Carbon Stock Classiication in Pyroclastic Flow and Pyroclastic Surge Area (include values per ha)
Afected
Area Surface Area Dead Trees Dead Woods Pole Trees
Carbon (kg)
Total Sample Carbon (kg)
Total car-bon (kg)
Total carbon (kg/ha)
Carbon Stock
Distance (m) (m2) Carbon
(kg)
Carbon (kg) Carbon
(kg)
Class
Pyroclastic >3973 – 5297
(Class 2)
940,222 0 5 0 0 5 739 8 high
Flow >5297 – 6620
(Class 3)
226,318 0 2 0 0 2 62 3 low
> 6620 – 7945 (Class 4)
305,012 6,270 8 0 0 6,278 319,141 10,463 high
Pyroclastic Flow Carbon Stock 6,270 14 0 0 6,284 319,943 2,174
Proportion (%) 99.78 0.22 0 0
Pyroclastic >2650 – 3973
(Class 1)
983,809 2,764 0.16 0 0 2,764 453,176 4,606 low
Surge >3973 – 5297
(Class 2)
2,125,120 2,380 3 131 0 2,515 890,705 4,191 low
>5297 – 6620 (Class 3)
953,114 27,329 4 100 6,281 33,714 5,355,625 56,191 high
Pyroclastic Surge Carbon Stock 32,473 8 232 6,281 38,993 6,699,506 16,493
Proportion (%) 83.28 0.02 0.59 16.11
Table 7. Regression Model of the Age of Pyroclastic Flow and Carbon Stock in MVNP Recovery Areas
No Regression Model R2
1 Quadratic y = 0.005x2 - 0.468x + 15.12 0.418
2 Linear y = 0.025x + 7.402 0.013
3 Power y = 12.88x-0.18 0.035
4 Logistic y = 1/0.135*1.002x 0.004
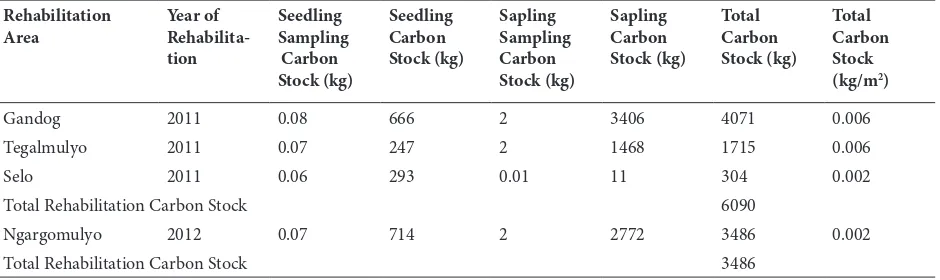
Table 8. Carbon Stock in Rehabilitation Trees
Rehabilitation
Gandog 2011 0.08 666 2 3406 4071 0.006
Tegalmulyo 2011 0.07 247 2 1468 1715 0.006
Selo 2011 0.06 293 0.01 11 304 0.002
Total Rehabilitation Carbon Stock 6090
Ngargomulyo 2012 0.07 714 2 2772 3486 0.002
Total Rehabilitation Carbon Stock 3486
In pyroclastic surge area, there were Schima wallichii and Acacia decurrens in pole stage. he tree stage which was found in surge area was Pine. he result of carbon stock estimation in afected area is presented in Table 6.
Total carbon loss in pyroclastic area was estimated by subtracting carbon stocks that were likely to have been in the afected areas by remaining carbon stock in afected area. In this case total carbon loss was estimated based on subtracting of 2006 carbon stock that were likely to have been in the afected areas by the remaining carbon stock based on ield measurement. he total carbon loss was 405,100 kg.
he carbon rate recovery was generated based on relation between age of pyroclastic low event as independent variable and carbon stock in recovery areas as dependent variable. he 2011 CPA-Carbon developed model was applied to estimate carbon stock in recovery area. Linear, Power, Quadratic and Logistic regression was built to relate age of pyroclastic low event and carbon stock in recovery areas (Table 7).
Rehabilitation activity in MVNP was carried out in 2011 and 2012 (Table 8).
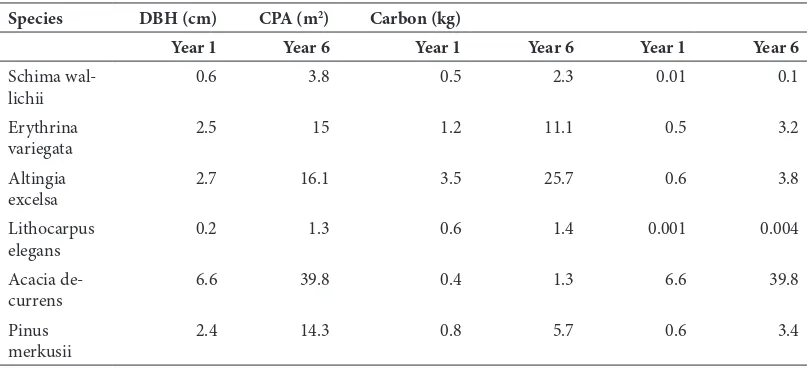
he DBH, CPA and Carbon of dominant trees in MVNP in irst year of their life and sixth year of their life are presented in Table 9.
Based on paired sample T-test, the CPA and Carbon stock of dominant trees in MVNP of irst year is not diferent with the CPA and Carbon stock of dominant trees in MVNP of sixth year. While the irst year and sixth year of DBH of dominant trees in MVNP is signiicantly diferent.
Total remaining carbon stock in afected area based on ield measurement was lower than carbon stock based on CPA-Carbon model. his can be due to
the overestimation of segmented crown. hough there was an over segmentation but overall the accuracy of segmentation based on the calculation of F score which indicate the accuracy of segmentation was above 0.5 means that the accuracy of algorithm which was used to segment the object more than 50 % and the model can be applied to estimate carbon stock [Li et al., 2012]. he over segmentation can occur due to the algorithm approach and some parameters which were used such as shape, texture and digital number (both of mean and standard deviation) in segmentation process were not give a good result. Some objects that were actually not the tree were recognized as a tree by the algorithm and the parameters because it has similar characteristics with canopy such as the rocky land with small vegetation cover.
he uncertainty of tree segmentation can be caused by the spacing threshold of the trees. However, determination of appropriate in dense forests is diicult. he high threshold will lead to under-segmentations and low threshold lead to over segmentations [Carleer et al., 2005; Li et al., 2012].
ESTIMATION OF CARBON STOCK Selli Fidi Yani Wardani et al.
86
Table 9. he First and Sixth Year of DBH, CPA and Carbon Stock of Dominant Trees in MVNP
Species DBH (cm) CPA (m2) Carbon (kg)
imagery is oblique and the crown projection area was elongated. hose conditions afect the accuracy of carbon stock estimation in MVNP.
In this study, the highest carbon stocks of dead trees were located in pyroclastic low and surge in surface distance class farthest from the crater. Area with surface distance class 4 had high amount of dead trees carbon stock because the area is far from the crater so the speed and temperature of pyroclastic low has decreased [Crandell et.al, 1984; Darmawan, 2012; Surono et al., 2012].
Carbon stock in pyroclastic surge area was higher than carbon stock in pyroclastic low. In pyroclastic surge area also found poles and trees biomass. hat is because pyroclastic low material is more destructive than pyroclastic surge material. he density of cloud of gases and rock debris of pyroclastic surge is lower than pyroclastic low. Pyroclastic low carried hot volcanic materials. he temperature maximum that can be reached by pyroclastic lows is around 350°C to more than 550°C when it deposited. Since pyroclastic low is more powerful and its temperature is higher than pyroclastic surge material, pyroclastic fow can cause all the trees are downed and more damaging than pyroclastic surge [Crandell et al., 1984].
he remaining carbon stock in afected area was underestimated since there was utilization of dead trees and dead wood in afected area by the community to rebuilt their damaged house by the eruption and utilize it for ire wood.
Linear regression was selected to developed model of natural carbon rate recovery in MVNP by considering the 4 – 6 years Merapi volcano eruption period. Study by Peper et al. [2001] concluded that the DBH and CPA growth is fast on its 15 years irst but slow in its 15 years second. Since the Merapi volcano eruption period is 4 – 6 years which is below the irst stage of tree life, 15 years, the carbon growth in MVNP will increase in 4 – 6 years Merapi volcano eruption period.herefore linear regression was chosen to correlate age of pyroclastic low event and carbon stock in recovery area.
he artiicial carbon rate recovery cannot be developed since there was only 1 year growth data of rehabilitation trees. Plants that were used to rehabilitate the MVNP are Schima wallichii, Erythrina variegate, Syzygium cumini and Inocarpus fagiferu which need light for their live (intolerant species) [Harja et al., 2012; Whistler and Elevitch, 2006; Sheikh, 1993; Pauku, 2006]. Based on the ieldwork, reeds were growth in the rehabilitation area and cause their growth is slow and some of rehabilitation trees is dead.
he estimation of carbon rate recovery was estimated based on CPA-Carbon model of 2011 GeoEye satellite imagery. It was diicult to validate the data of carbon stock in recovery area since the eruption is the past event. he carbon stock in recovery area will afect the estimation of natural carbon rate recovery in MVNP. Vegetation structure may have changed in the past and the remaining carbon stock of survival trees in recovery area could also count as carbon recovery. hat would afect the accuracy of estimation carbon stock in recovery area.
5. Conclusion
Since 19th century Merapi volcano erupts 4-6 years periodically. he 4-6 years Merapi period eruption has VEI ≤ 2 with the deposit of pyroclastic low ≤ 7 km from the crater. he directions of pyroclastic low are varies. All area of MVNP is on the range of ≤ 7 km pyroclastic low deposit. he southwest and west part of MVNP is in the range of VEI 3 with 12 km pyroclastic low deposit. hat conditions makes the MVNP is always susceptible to pyroclastic low event. his condition will be the problem because the role of national park as nature conservation area and provider of environmental services and play a role in carbon sequestration in the future based on Government Regulation Number 28 Year 2011 and Number 49 Year 2011will be disrupted.
Recommendation
carbon stock in MVNP. 1) he use of good quality high resolution satellite imagery will improve the accuracy of carbon stocks estimation based on CPA-Carbon relationship. Integrating the high resolution image with LiDAR can be considered to estimate carbon stock in MVNP, 2) he further research about artiicial carbon rate recovery is recommended since there is not enough data series to establish the relationship between time and artiicial carbon stock when this study was conducted, 3) he use of accurate land cover map ater 2010 eruption will increase the accuracy of broadleaf
and Pine tree carbon stock estimation, 4) Further study of regeneration will give more accurate results in natural carbon rate recovery in MVNP, 5) he map of Merapi volcano susceptible area in MVNP is needed to create good planning of rehabilitation and restoration in MVNP.
Acknowledgement
hank to Prof. Junun Sartohadi, M.Sc for valuable comments and his support during the research and thanks to review for the constructive comments.
References
Astrand, P. J. (2011), VHR image acquisition
speciica-tions for the CAP controls (CwRS and LPIS QA).
Is-pra, European Commission Joint Research Centre Institute for Environment and Sustainability Moni-toring Agricultural Resources Unit.
Bureau of Merapi Volcano National Park, Ministry on Forestry (2011a), Survey of vegetation and wild fau-na in Merapi Volcano Natiofau-nal Park ater eruption
in 2010 (in bahasa), Directorate General of Forest
Protection and Nature Conservation, Ministry of Forestry, Yogyakarta.
Bureau of Merapi Volcano National Park, Ministry on Forestry (2011b), Map album of national park eco-system restoration ater the eruption of Mount
Mera-pi in 2010 (in bahasa), Directorate General of
For-est Protection and Nature Conservation, Ministry of Forestry, Yogyakarta.
Bureau of Merapi Volcano National Park, Ministry on Forestry (2011c), Physical condition (in bahasa), http://tngunungmerapi.org/?page_id=215, Acce-ssed date: 24-May-2012.
Brown, S. (1997), Estimating biomass and biomass change of tropical forests: a primer, http://www. fao. org/docrep/w4095e/w4095e00.htm, Access da-te: 6-November-2012.
Carleer, A.P., Debeir, O., & Wolf, E. (2005), Assessment of very high spatial resolution satellite image seg-mentations, Photogrammetric Engineering &
Re-mote Sensing Journal 71: 1285-1394.
Chave , J., Andalo, C., Brown, S., Cairns, A., Chambers, J. Q., Eamus, D., Folster, H., Fromard, F., Higuchi, N., Kira, T., Lescure, J. P., Nelson, W., Ogawa, H., Puig, H., Rie´ra, B., & Yamakura, T. (2005), Tree al-lometry and improved estimation of carbon stocks and balance in tropical forests, Oecologia 145(1): 87-99.
Costa, F., Andreastuti, S., Bouvet de Maisonneuve, C., & Pallister, J. S. (2012), Petrological insights into the storage conditions, and magmatic processes that yielded the centennial 2010 Merapi explosive eruption. Journal of Volcanology and Geothermal
Research, in press, corrected proof.
Crandell, D. R., Booth, B., Kusumadinata, K., Shimoz-uru, D., Walker, G. P. L. & Westercamp, D. (1984),
Source-book for volcanic-hazards zonation,
UNES-CO, France.
Darmawan, H. (2012), Pyroclastic low modeling us-ing TITAN2D to predict pyroclastic hazards post Merapi Volcano eruption 2010 (in bahasa), MSc
thesis, Gadjah Mada University.
Geology Agency. Un-dated. Merapi history (in ba-hasa). URL: http://merapi.bgl.esdm.go.id/ i n f o r m a s i _ m e r a p i . p h p ? p a g e = i n f o r m a s i -merapi&subpage=sejarah. Accessed date: 17-No-vember-2012
Gill, S. J., Biging, G. S., Murphy, E. C. (2000), Modeling conifer tree crown radius and estimating canopy cover, Forest Ecology and Management 126 :405-416.
Intergovernmental Panel on Climate Change (IPCC) (2003), Good practice guidance for land use, land-use change and forestry, Institute for Global Envi-ronmental Strategies, Kanagawa.
Intergovernmental Panel on Climate Change (IPCC) (2007), Climate change 2007: synthesis report, he
Intergovernmental Panel on Climate Change, Ge-neva.
Intergovernmental Panel on Climate Change (IPCC) (2012), Managing the risks of extreme events and
di-sasters to advance climate change adaptation.
Cam-bridge: Cambridge University Press.
Jacobsen, K., & Büyüksalih G. Un-dated. Topographic
mapping from space, http://www.ipi.uni-hannover.
de/uploads/tx_tkpublikationen/Jacobsen_istan-bul_01.pdf. Accessed date: 4-February-2013. Ketterings, Q. M., Coe, R., van Noordwijk, M.,
Am-bagau, Y., & Palm, C. A. (2001), Reducing uncer-tainty in the use of allometric biomass equations for predicting above-ground tree biomass in mixed secondary forests, Forest Ecology and Management
146(1–3): 199-209.
Lavigne, F., houret, J. C., Voight, B., Suwa, H., & Sumaryono, H. (2000), Lahars at Merapi Volcano, Central Java: an overview, Journal of Volcanology
and Geothermal Research 100(1–4): 423-456.
ESTIMATION OF CARBON STOCK Selli Fidi Yani Wardani et al.
88
& Remote Sensing 78: 75-84.
Lu, D. (2005), Integration of vegetation inventory data and Landsat TM image for vegetation classification in the western Brazilian Amazon, Forest Ecology
and Management 213: 369–383.
Mandal, R. A., Dutta, I. C., Jha, P. K., Karmacharya, S., yadav, K., hapa, U., & Haque, S. (2012), Efects of deforestration anf forest degradation on forest car-bon stock in collaborative forests, Nepal, Interna-tional Journal Of Conservation Science 3 (4): 325-338.
Manuri, S., Putra, C. A. S., & Saputra, A. D. (2011), For-est carbon stock For-estimation techniques (in bahasa), Merang REDD Pilot Project – German Interna-tional Cooperation (MRPP-GIZ), Palembang. Meixner, P., & Leberl, F. (2010), Interpreting building
facades from vertical aerial images using the third dimension, In ISPRS Technical Commission IV & AutoCarto Symposium ASPRS/ CaGIS 2010 Fall Specialty Conference. ISPRS, Orlando.
Minarto, E. (2009), Forest dynamics of peat swamp for-est in Sebangau, Central Kalimantan, Biodiversitas 10: 187-194.
Newhall, C. G., & Self, S. (1982), he Volcanic Ex-plosivity Index (VEI) - an Estimate of Explosive Magnitude For Historical Volcanism, Journal of
Geophysical Research-Oceans and Atmospheres 87:
1231-1238.
Newhall, C. G., Bronto, S., Alloway, B., Banks, N. G., Bahar, I., del-Marmol, M. A., Hadisantono, R. D., Holcomb, R. T., McGeehin, J., Miksic, J. N., Rubin, M., Sayudi, S. D., Sukhyar, R., Andreastuti, S., Till-ing, R. I., Torley, R., Trimble, D., & Wirakusumah, A. D. (2000), 10,000 Years of explosive eruptions of Merapi Volcano, Central Java: archaeological and modern implications, Journal of Volcanology and
Geothermal Research 100(1–4): 9-50.
Pauku, R. L. (2006), Species Proiles for Paciic Island Agroforestry-Inocarpus fagifer (Tahitian chestnut), http://agroforestry.net/tti/Inocarpus-Tahitian chestnut.pdf. Accessed date: 5-March-2013.
Sheikh, M. I. (1993), Trees of Pakistan, http://pdf.usaid. gov/pdf_docs/pnabw250.pdf: 5-March-2013. SNI 7724:2011 (2011), Measurement and calculation
of carbon stocks – ield measurement for estimating forest carbon stocks (ground based forest carbon
ac-counting), Standardization and Enviroment,
Minis-try of ForesMinis-try.
Suharlan, A., Sumarna, K., & Sudiono, J. (1975), Yield Table of ten industrial wood species, Forestry Re-search and Development Agency, Ministry of For-estry, Bogor.
Surono, Jousset, P., Pallister, J., Boichu, M., Buongiorno, M. F., Budisantoso, A., Costa, F., Andreastuti, S., Prata, F., Schneider, D., Clarisse, L., Humaida, H., Sumarti, S., Bignami, C., Griswold, J., Carn, S., Op-penheimer, C., & Lavigne, F. (2012), he 2010 ex-plosive eruption of Java’s Merapi volcano—A ‘100-year’ event, Journal of Volcanology and Geothermal
Research 241–242: 121-135.
Tilling, R. I. (2005), Volcano Hazards, In Marti, J and Ernst, G. G. J, Volcanoes and he Environment, pp 55-89. Cambridge University Press.
Voight, B., Constantine, E. K., Siswowidjoyo, S., & Tor-ley, R. (2000), Historical eruptions of Merapi Volca-no, Central Java, Indonesia, 1768–1998, Journal of
Volcanology and Geothermal Research 100: 69-138.
Whistler, W. A., & Elevitch, C. R. (2006), Species Proiles for paciic island agroforestry-erythrina variegata (coral tree), http://agroforestry.net/tti/Erythrina-coraltree.pdf. Accessed date: 13-January-2013. Zhan, Q., Molenaar, M., Templi, K., & Shi, W. (2005),
Quality assessment for geo-spatial objects derived from remotely sensed data, International Journal of