ECOTROPHIC | VOLUME 2 NO. 1 MEI 2007 1 MONITORING MANGROVE AREA IN BENOA BAY
USING LANDSAT TM AND ETM + DATA
Ni Luh Made Ari Sugianthi 1, I Wayan Arthana1, I Wayan Sandi Adnyana2
1)
Master Program of Environmental Study, Post Graduate Program, Udayana University
2)
Center of Remote Sensing and Ocean Science (CReSOS), Udayana University
ABSTRACT
Mangrove ecosystems are crucial for the management of some coastal resources in Indonesia. This research used Landsat TM 1994, Landsat ETM+ 2002 with the purpose to know mangrove area change for eight years, mangrove density and accuracy of image as source of data to mangrove area in Benoa Bay. From image analysis that using maximum likelihood method, the mangrove is classified into 3 classes i.e.: mangroves with high density, medium density and low density. For the ground check, used single plot method by using 6 trees.
The extent of mangrove area in Benoa Bay were 447.69 ha in 1994 and 622.08 ha in 2002. The change of the extent of mangrove area during 8 years (1994 – 2002) increased by 174.41 ha. The area of densities in 1994, high density was 225.15 ha, medium density was 122.48 ha and low density was 130.05 ha. In 2002, high density was 262.8 ha, medium density was 265.95 ha, and low density was 133.30 ha. Based on the regression analysis between mangrove density and the value of interpretation, the density of mangrove in Benoa Bay which the criteria of high density is 364.723 – 466.311 tree/ha, medium density is 237.738 - 364.723 tree/ha and low density is 186.944 – 237.738 tree/ha. The determination coefficient (r2) was 0.6312. Based on the regression analysis in 2002 used in interpretation of mangrove density in 1994, which the criteria of high density is 357.10 tree/ha –316.47 tree/ha, medium density is 273.29 tree/ha – 316.47 tree/ha and low density is 252.98 tree/ha –273.29 tree/ha.
The accuracy of the Landsat ETM+ 2002 for mangrove area classification in Benoa Bay was 90%. These values were above the acceptable limit of accuracy stated of 80 %, so that this classification accuracy was acceptable.
Key word : monitoring, mangrove, density, sattelite data
ABSTRAK
Ekosistem mangrove adalah yang terdapat di pesisir Indonesia banyak yang mengalami permasalahan dalam pengelolaanya. Penelitian ini bertujuan untuk mengetahui luas area mangrove dan kerapatan mangrove di Teluk Benoa serta mengetahui tingkat ketelitian citra Landsat TM 1994 dan Landsat ETM+ 2002. Analisis citra menggunakan metode maximum likelihood yang mengklasifikasikan mangrove menjadi tiga kelas yaitu mangrove dengan kerapatan tinggi, kerapatan sedang dan kerapatan rendah. Untuk pengecekan ke lapangan digunakan metode petak tunggal dengan menggunakan 6 pohon.
Luasan area mangrove di Teluk Benoa 447,69 ha pada tahun 1994 dan 622,08 ha pada tahun 2002. Perubahan luasan area mangrove di Teluk Benoa selama 8 tahun, dari tahun 1994 sampai 2002 bertambah mencapai 174,41 ha. Kerapatan mangrove pada tahun 1994 ; kerapatan tinggi 225,15 ha, kerapatan sedang 122,48 ha kerapatan rendah dan 130,05 ha. Pada tahun 2002 kerapatan tinggi 262,8 ha, kerapatan sedang 265,95 ha dan kerapatan rendah 133,30 ha. Berdasarkan analisis regresi antara kerapatan mangrove dan nilai interpretasi citra, kerapatan mangrove di Teluk Benoa dengan kreteria kerapatan tinggi 364,723 – 466,311 pohon/ha, kerapatan sedang 237,738 – 364,723 pohon/ha dan kerapatan rendah 186,944 – 237,738
ECOTROPHIC | VOLUME 2 NO. 1 MEI 2007 2
interpretasi kerapatan mangrove 1994 dengan kreteria kerapatan tinggi 357,10 – 316,47 pohon/ha, kerapatan sedang 273,29 – 316,47 pohon/ha dan kerapatan rendah 252,98 – 273,29 pohon/ha.
Ketelitian interpretasi Landsat ETM+ 2002 untuk klasifikasi mangrove di Teluk Benoa adalah 90%.Tingkat ketelitian citra Landsat sebagi sumber data dalam kegiatan pemetaan luasan area mangrove di Teluk Benoa berada diatas batas penerimaan yang ditetapkan sebesar 80 %, sehingga hasil klasifikasi ini dapat diterima.
Kata kunci : pemantauan, mangrove, kerapatan, citra satelit
INTRODUCTION
Mangrove ecosystems are crucial for the management of some coastal resources in Indonesia. Their function in providing the linkage between the land and the sea, make them act as the filter in reducing the damaging effects of major environmental changes, and as a sources of nourishment for both aquatic and terrestrial animals (Bengen, 2001).
In 1970 mangrove forest in Benoa Bay was still not degraded yet in total area of 1,373.5 ha. Exploitation outside the area of mangrove forest in Benoa Bay has been recently extended with total area 319.285 ha, for example exploitation of the pledging area so that forest habitat of mangrove at that time dwindle to become 1,054.142 ha from totally area 1,373.50 ha (Dinas Kehutanan Province Bali, 2004). Availability of the data had not yet been enough for more information about the growth of landscape area. This matter caused by the limitation of fund for the activity of monitoring and survey of area. For this reason, remote sensing is an attractive means of obtaining data for defining deforested areas and updating management plans.
This research takes location in Benoa Bay and used Landsat TM in 1994, Landsat ETM + in 2002 with the purpose to know mangrove area change for eight years time, mangrove density and about the accuracy of Landsat TM and ETM+ data for mangrove monitoring area in Benoa Bay.
RESEARCH METHODS
Mangrove area data were taken from satellite image through an image interpretation process using supervised classification method. Classification conducted was in accordance to pixel value to determine training area. This matter is enabled because of the available information or data about mangrove area in Benoa Bay.
The steps to detect mangrove object were conducted with making of composite image of false color using some different bands. The steps for identifying mangrove area were conducted with determination of mangrove area. The result of identified areas above was used to classify the pixel automatically according to its value at swampy forest to yield a thematic map of mangrove area and mangrove density in Benoa Bay.
ECOTROPHIC | VOLUME 2 NO. 1 MEI 2007 3
digitally programmed data ILWIS Integrated Land Water Information System.
Research Procedure
Research, was started by collecting data from satellite image Landsat TM in 1994, Landsat ETM 2002, including base map and mangrove data area. The data from satellite image was then interpretaed.
Pre processing
In this phase, there are two processes which have should be done as follows ; (1) geometric correction and (2) cropping.
Training area identification of mangrove area
In this research, the dissemination of the training areas in the spectral feature space applied band 3 ( X axis ) and band 4 ( Y axis ) to obtain maximum visual appearance in the image and to make the picking up training areas easier for classification of spectral classes
Supervised Classification with Maximum Likelihood
Method
Maximum likelihood classification is performed assuming equal probability of occurrence and cost of misclassification for all classes (Lillesand and Keifer 1994)
Density mapping
Output products are thematic maps
Ground Survey
The next step is to process overlay between map result of image interpretation, for determining the specific ordinate to truth evidence of field research. In this step the ground survey was conducted in observation the frontier of mangrove area and mangrove density. For the ground check on the mangrove
areas, used 30 position points, but for mangrove density we used 10 position points with classification of high, medium and low densities. Ground check for mangrove density used was Single Plot Method.
Single Plot Method is a method used for making an inventory of vegetation using one training plot to represent one type of vegetation (Sundra, 2001). This method is suitable for areas/forests which are physiognomic the same. Principally, this method is used to determine the extent of an area that is needed in the same physiognomy. The final evaluation was statistically analyzed by calculating an appropriate percentage (% correct) and (%
commission error) by pixel count.
ECOTROPHIC | VOLUME 2 NO. 1 MEI 2007 4 RESULTS
Mangrove Area and Mangrove Density
Mangrove Areas in 1994 and 2002
Based on the classification results of Landsat TM, the mangrove area in steady area in 1994 was 447.69 ha (Figure 3.1).
Figure 3.1. Mangrove area in Landsat TM 1994
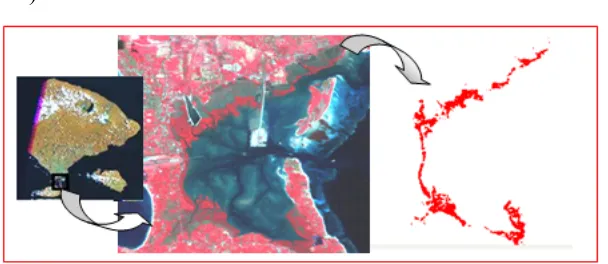
According to the result of digital analysis, the mangrove forest in Landsat ETM+ 2002 image was about 622.08 ha (Figure 5.2).
Figure 3.2. Mangrove area in Landsat ETM+ 2002
Mangrove Density in 1994 and 2002
For the density of mangrove areas through Image of Landsat 1994, it was obtained that the high density was 225.15 ha, the medium density was 122.48 ha, and the low density was 130.05 ha (Table 3.1). The result of Landsat TM 1994 image interpretation as shown in Table 3.1. and Figure 3.3.
Table.3.1. The result of mangrove density interpretation by using Landsat TM 1994
No.
Mangrove Density
Classification Area 1 High Density 225.15 ha
2 Medium Density 122.48 ha 3 Low Density 130.05 ha Total 447.69 ha
For the ground check used single plot method by using 6 trees so that it was obtained specific area that represents 1 point of area and took 10 points for each density. The purpose of the ground check was to know the number of the trees from each density of the high, medium and low densities. Besides counting of the extent of an area, this single plot method also could be used to obtain basal area and population mangrove per hectar.
ECOTROPHIC | VOLUME 2 NO. 1 MEI 2007 5
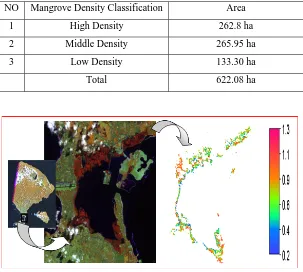
262.8 ha, the area of medium density was 265.95 ha and for low density was 133.30 ha (Table 3.2.). The result of Landsat ETM+ 2002 image interpretation as shown in Table 3.2. and Figure 3.4.
Figure 3.3. Mangrove density in Landsat TM 1994
Table.3.2. The result of mangrove density interpretation by using Landsat ETM+ 2002
NO Mangrove Density Classification Area
1 High Density 262.8 ha
2 Middle Density 265.95 ha
3 Low Density 133.30 ha
Total 622.08 ha
Figure 3.4.Mangrove density in Landsat ETM+ 2002
For high density obtained the highest number of trees, that was 524 trees/Ha with the area of 114.6 m² and the growth of the mangroves spread in the marginal area and in the middle (Figure 3.4)
For medium density resulted in the highest number of trees, that was 489 trees/Ha with the area of 204.48 m² and the growth of the mangroves spreads in the middle areas (Figure 3.4).
For the low density was 317 trees/Ha with the area of 315.91 m² and the growth of the mangroves spread in the marginal and middle areas (Figure 3.4).
Regression Analysis of Mangrove
Density
ECOTROPHIC | VOLUME 2 NO. 1 MEI 2007 6 Value of mangrov e inte rpre tation
To
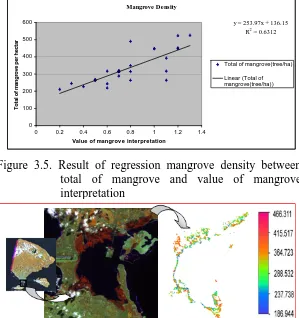
Figure 3.5. Result of regression mangrove density between total of mangrove and value of mangrove interpretation
Figure 3.6. Result of regression mangrove density between total of mangrove and value of mangrove density interpretation using Landsat 2002
Figure 3.7. Result of mangrove density using algoritm regression 2002 with overlay of mangrove density interpretation using Landsat 1994
Result of regression analysis of mangrove density with r2 in 2002 used in interpretation of mangrove density in 1994 can be showed at Figure 3.7. Figure 3.10 shows that total mangrove per hectar with high density (red color) between the value of 316.47 tree/ha – 357.10 tree/ha, for the mangrove with medium density (green color) with the value of 273.29 tree/ha – 316.47 tree/ha, and for the mangrove with low density with the value of 252.98 tree/ha –273.29 tree/ha
Accuracy Assessment Landsat ETM+
2002
The overall accuracy that could be reached in classification of mangrove areas in this research was 90 %. These values were above the acceptable limit of accuracy stated by Nuarsa (2002) that was 80 %, so that this classification accuracy was acceptable.
DISCUSSION
Mangrove Area and Mangrove Density
Mangrove Areas in 1994 and 2002
ECOTROPHIC | VOLUME 2 NO. 1 MEI 2007 7
areas in the image of 2002. The extent of mangrove areas in the image of 1994 was 447.69 ha (Figure 3.1.), but the extent in 2002 was 622.08 ha (Figure 3.2.).
According to Asthana (2005) the degradation of mangrove areas was due to various causes that had been begun since 1974, when the handling of reforestation was done by private companies but resulted nothing. Violations such as land-functional changes were getting more frequently to happen since 1986, so that the government soon carried out the reforestation at least 100 Ha annually, and had been done for 3 years, i.e.: in 1990, 1991 and in 1993.
This research obtained that the extent of mangrove areas in 1994 was smaller than that in 2002. This matter probably happened because in 1994 during the time of reforestation of mangrove areas which was just started so that there were still some seashore ponds existed and some blank spots that were not reforested yet, but the increasing extent of mangrove areas in 2002 was caused by the performing of conservation and rehabilitation which means that the conserving activity is to rehabilitate or reforest in order to make mangrove areas as an ecosystem which has an important function to support various aspects of life.
Visual interpretation of image 1994 (Figure 3.1.) shows that the reforestation result of the year before, spreads out evenly along Benoa Bay but its extent is still small, but in 2002 (Figure 3.2.) it
shown that the mangrove areas spread unevenly and much increase than that in 1994.
The increasing extent of mangrove areas, as visual appearance of the image of Landsat ETM+ 2002 (Figure 3.2) shows that extent of vegetation of mangrove tends to direct to the sea.
Mangrove Density in 1994 and 2002
From image analysis using maximum likelihood method, the mangrove was classified into 3 classes i.e.: mangroves with high density, medium density and low density. By applying Algorithm (Nuarsa et.al., 2005) through analysis of map calculation, the classification result was overlaid and obtained the area of each density (high, medium and low).
For the ground check, used single plot method by using 6 trees so that it was obtained specific area that represents 1 point of area and took 10 points for each density. The purpose of the ground check was to know the number of the trees from each density of the high, medium and low densities.
For the density of mangrove areas through image of Landsat 1994, it was obtained that the high density was 225.15 ha, the medium density was 122.48 ha, and the low density was 130.05 ha (Table 3.1, Figures 3.3).
ECOTROPHIC | VOLUME 2 NO. 1 MEI 2007 8
density was 122.48 ha and for low density was 130.05 ha (Table 3.2., Figures 3.4.).
For the high density obtained the highest number of trees, that was 524 trees/ha with the area of 114.6 m². According to Asthana (2005), this matter was caused by seashore physiographic, that is, the more flat the seashore and the higher the tides, the wider the area of grown mangrove is. Seashore topographic condition is an important factor which affects the characteristics of the mangrove structure, especially species composition, species dissemination and the measure and extent of mangrove areas.
For the extent of mangrove areas using the Image of Landsat ETM+ 2002, it was obtained that the extent of mangrove areas was higher than the one obtained by using the Image of Landsat TM 1994. This matter affected the density of mangrove area itself, where the growth of the mangrove areas was relatively quickly and well, would cause mangrove plants one with the others being dense day after day so that the high density would be obtained.
For medium density resulted in the highest number of trees that was 489 trees/ha with the area of 204.48 m². The reforestation activity which was done more intensively by the society and the government affected the growth of mangrove plants and led to obtain the higher density. The success of the rehabilitation upon the former shore fishponds by planting them with mangrove plants which was done in every occasion, gave more and more chance to the
better growth of the extent and density of mangrove areas.
For the low density, the highest number of trees obtained was 317 trees/Ha with the basal area of 0.94 ha. According to Ardhana (2003), the density is a number of individual plants in an area at a specific time. The obtained mangrove density higher, and then the environment and organisms that lived in those mangrove areas would live well, because mangrove vegetation gave source of life for the organisms.
Regression and Corelation Analysis of Mangrove
Density
ECOTROPHIC | VOLUME 2 NO. 1 MEI 2007 9
Result of regression analysis of mangrove density with r2 in 2002 used in interpretation of mangrove density in 1994 can be showed at Figure 3.7. Figure 3.7. shows that total mangrove per hectar with high density (red color) between the value of 357.10 tree/ha –316.47 tree/ha, for the mangrove with medium density (green color) with the value of 273.29 tree/ha – 316.47 tree/ha, and for the mangrove with low density with the value of between 252.98 tree/ha –273.29 tree/ha.
Coefficient correlation is statistical instrument that can be used for comparing the measurement of two different variables in order to determine the correlation between those variables (Arikunto,1997).
In Figure 3.5. it is shown that dots formed a diagonal line which means that there is a high postive correlatied between two variables.The determination coefficients (r2) for mangrove density are above 0.6312, which means that there is enough correlation. Total of mangrove between image interpretation ( Figure 3.10) with ground check is different as shown from determination coefficient (r2) of 63.12 % and to 47.08% there is mistake was caused by image interpretation results using Landsat 2002, whereas the ground check observation was done in 2006. This matter shows the weakness of the correlation obtained was categorized as sufficient.
Accuracy Assessment
The assessment of overall accuracy that could be reached in the classification of mangrove areas was 90 %. These values were above the acceptable limit of accuracy stated by Nuarsa et.al (2005) that was 80 %, so that this classification accuracy was acceptable.
CONCLUSIONS AND SUGGESTIONS
Conclusions
1. The extent of mangrove area in Benoa Bay were 447.69 ha in 1994 and 622.08 ha in 2002. The change of the extent of mangrove area during 8 years (1994 – 2002) increased by 174.41 ha.
2. The area of densities in 1994: high density was 225.15 ha, medium density was 122.48 ha and low density was 130.05 ha. In 2002, high density was 262.8 ha, medium density was 265.95 ha, and low density was 133.30 ha.
ECOTROPHIC | VOLUME 2 NO. 1 MEI 2007 10
4. Based on the regression analysis in 2002 used in interpretation of mangrove density in 1994, which the criteria of high density is 357.10 tree/ha –316.47 tree/ha, medium density is 273.29 tree/ha – 316.47 tree/ha and
low density is 252.98 tree/ha –273.29 tree/ha. 5. The accuracy of the Landsat ETM+ 2002 for
mangrove area classification in Benoa Bay was 90%.
Suggestions
1. For researchers, the use of Landsat image as a source of data in order to map the mangrove areas with image interpretation technique can give sufficient information about the extent of the area, because the accuracy that obtained is good enough.
2. It is needed to carry out further research using a new image to compare the accuracy obtained and the changes of mangrove areas and to compare the mangrove density and the regression and correlation analysis.
3. The time of intake of training area be carefully because it determine correctness of digital classification.
REFERENCES
Ardhana I P.G., 2003, Pedoman Metode Penelitian
Ekologis Sumber Daya Alam Hutan, Udayana
Univercity, Denpasar
Asthana A , 2005, Kajian Kebijakan Kerusakan
Mangrove di Kawasan Tahura Ngurah Rai,
Udayana Univercity, Denpasar
Dinas Kehutanan Provinsi Bali. 2004. Pengelolaan Hutan Mangrove Lestari di Propinsi Bali. Provinsi Bali.
Nuarsa, I.W. 2002. Diktat Pengindraan Pengolahan Citra Digital, Udayana University.
Nuarsa, I.W., I.W. S Adnyana, 2005. Development of The New Algorithm for Mangrove
Classification. International Journal of Remote
Sensing and Earth Sciences September 2005 Vol.2, pp. 57-64. IReSES.
Sundra, IK, 2001, Metode dan Teknik Analisis
Komponen Flora Darat, Pelatihan Analisis