GLOBAL EMPLOYMENT
TRENDS 2014
+1.922523006.62 -006.65 0.887987 .887 +1.984523 220 -0.807987 48 +1.987523
+1. 9 -006.65 0.887990
+0.1 +2.03 +0.04 -25.301 023 -00.22
006.65 0.887983 +1.922523006.62 -0.657987 +1.987523006.82 -006.65 0.887987 +1.987523006.60 0.887987
+1.0075230.887984 +1.987523006.64 0.887985 +1.997523006.65 0.887986 +1.984523006.66 0.327987 +1.987523006.59 -0.807987 +1.987521006.65 0.-887987 +1.987523006.65 0.807987 +1.987523 0.887983 +1.987523006.62 -0.883988 +1.987523006.63 -006.65 0.894989 +1.987523006.65 0.887990
+0.1 +2.03 +0.04 -25.301 023 -00.22
006.65 0.887983 +1.922523006.62 -0.657987 +1.987523006.82 -006.65 +0.887987 +1.987523006.60 0.887987 +1.0075230.887984 +1.987523006.64 0.887985 +1.997523006.65 0.887986 +1.984523006.66 -0.327987 +1.987523006.59 -0.807987 +1.987521006.65 0.-887987 +1.987523006.65 0.807987 +1.987523 0.887983 +1.987523006.62 -0.883988 +1.987523006.63 -006.65 -0.894989 +1.987523006.65 0.887990
+0.1 +2.03 +0.04 -25.301 023 -00.22
006.65 0.887983 +1.922523006.62 -0.657987 +1.987523006.82 -006.65 0.887987 +1.987523006.60 0.887987
+1.0075230.887984 +1.987523006.64 0.887985 +1.997523006.65 0.887986 +1.984523006.66 0.327987 +1.987523006.59 -0.807987 +1.987521006.65 0.-887987 +1.987523006.65 0.807987 +1.987523 0.887983 +1.987523006.62 -0.883988 +1.987523006.63 -006.65 0.894989 +1.987523006.65 0.887990
Global Employment Trends 2014
Risk of a jobless recovery?
Copyright © International Labour Organization 2014 First published 2014
Publications of the International Labour Oice enjoy copyright under Protocol 2 of the Universal Copyright Conven-tion. Nevertheless, short excerpts from them may be reproduced without authorization, on condition that the source is indicated. For rights of reproduction or translation, application should be made to ILO Publications (Rights and Permis-sions), International Labour Oice, CH-1211 Geneva 22, Switzerland, or by email: [email protected]. he International Labour Oice welcomes such applications.
Libraries, institutions and other users registered with reproduction rights organizations may make copies in accordance with the licences issued to them for this purpose. Visit www.ifrro.org to ind the reproduction rights organization in your country.
he designations employed in ILO publications, which are in conformity with United Nations practice, and the presen-tation of material therein do not imply the expression of any opinion whatsoever on the part of the International Labour Oice concerning the legal status of any country, area or territory or of its authorities, or concerning the delimitation of its frontiers.
he responsibility for opinions expressed in signed articles, studies and other contributions rests solely with their authors, and publication does not constitute an endorsement by the International Labour Oice of the opinions expressed in them. Reference to names of irms and commercial products and processes does not imply their endorsement by the International Labour Oice, and any failure to mention a particular irm, commercial product or process is not a sign of disapproval.
ILO publications and electronic products can be obtained through major booksellers or ILO local oices in many coun-tries, or direct from ILO Publications, International Labour Oice, CH-1211 Geneva 22, Switzerland. Catalogues or lists of new publications are available free of charge from the above address, or by email: [email protected]
Visit our website: www.ilo.org/publns ISBN 978-92-2-127485-8 (print) ISBN 978-92-2-127486-5 (web pdf)
ISSN 2304-4365 (print) ISSN 2304-2893 (pdf)
Global Employment Trends 2014: Risk of a jobless recovery? / International Labour Oice. Geneva: ILO, 2014
International Labour Oice
employment / unemployment / youth employment / youth unemployment / labour policy / economic recovery / regional development / Africa / Asia / Caribbean / developed countries / Europe / EU countries / Latin America / Middle East / Paciic
13.01.3
ILO Cataloguing in Publication Data
This publication was produced by the Document and Publications Production, Printing and Distribution Branch (PRODOC) of the ILO.
Graphic and typographic design, manuscript preparation, copy editing, layout and composition, proofreading, printing, electronic publishing and distribution.
PRODOC endeavours to use paper sourced from forests managed in an environmentally sustainable and socially responsible manner.
3
Acknowledgements . . . 7
Preface . . . 9
Executive summary . . . . 11
1. Macroeconomic challenges and global labour market developments . . . . 15
Some positive signs in advanced economies amidst deceleration in emerging economies . . . 15
Unemployment edges higher in 2013 and is expected to remain at elevated levels for many years to come . . . . 16
Labour market situation of youth worsens further . . . 21
Where are the decent jobs? . . . 22
High rates of informality hamper sustainable progress in poverty reduction . . . 24
Unemployment is becoming more persistent . . . 25
Economic uncertainty remains high, with negative efects on hiring . . . 26
How is the growth slowdown in emerging economies shaping labour markets? . . . 27
he working middle class continues to grow in the developing world . . . . 30
Summary . . . 32
Appendix: he ILO hiring uncertainty indicator . . . 33
2. Regional economic and labour market developments . . . 35
Developed Economies and European Union . . . 35
A recovery in activity, not in jobs . . . . 35
he outlook for jobs remains bleak . . . 36
Long-term unemployment is on the rise as skills mismatch increases . . . . 37
Social developments . . . . 42
Central and South-Eastern Europe (non-EU) and CIS . . . . 43
Growth decelerated sharply . . . 43
he labour market picture remains bleak . . . 44
Social developments . . . . 45
Persistent and emerging challenges . . . . 46
Latin America and the Caribbean . . . 47
Growth is slowing down . . . 47
Employment growth continues to outpace labour force expansion . . . . 47
Social developments and emerging challenges . . . 51
East Asia . . . 52
Global growth weighs on economic activity in the region . . . . 52
4 Global Employment Trends 2014 | Risk of a jobless recovery?
he labour market picture . . . 53
Social developments . . . . 53
Emerging challenges . . . 54
South-East Asia and the Paciic . . . 55
Global spill-overs continue to afect growth in the region . . . . 55
he labour market picture . . . 55
Social developments . . . . 56
Emerging challenges . . . 57
South Asia . . . 59
Growth has decelerated due to both domestic and external factors . . . 59
Labour market situation is mixed . . . 60
Gender gaps in the labour markets . . . . 61
Slow progress in structural transformation . . . 61
Outlook remains uncertain . . . 62
Middle East and North Africa . . . . 62
Social unrest has afected the region and threatens its long-term perspective . . . 62
Stress in labour markets remains high . . . . 63
Making foreign direct investment beneicial for job creation . . . . 66
Sub-Saharan Africa . . . . 68
Economic growth has remained solid . . . 68
3. Policies for a stronger labour market and more inclusive growth . . . . 73
Persistent weakness in labour markets and economic growth necessitates a policy re-think . . . 73
Monetary stimulus has prevented worse outcomes but has limitations and potentially adverse consequences . . . 73
1. Address weak aggregate demand through improved labour incomes and less iscal consolidation . . . . 75
2. Address high hiring uncertainty through better policy coordination . . . 79
3. Address inactivity and skills mismatch through active labour market policies . . . 80
Conclusion . . . . 81
References . . . . 83
Annexes Annex 1. Global and regional tables . . . . 89
Annex 2. Unemployment projections . . . 103
Annex 3. Global and regional igures . . . 111
Annex 4. Note on global and regional estimates . . . 121
Annex 5. Note on global and regional projections . . . 123
Contents 5 Tables
1. Global, regional and country-speciic estimates and projections
of the total unemployment rate, 2007–16 . . . 19
2. he global wage employment gap . . . 23
3. Labour market situation and outlook in Developed Economies and European Union . . . . 36
4. Labour market situation and outlook in Central and South-Eastern Europe (non-EU) and CIS . . . 43
5. Labour market situation and outlook in Latin America and the Caribbean . . 48 6. Labour market situation and outlook in East Asia . . . 53
7. Labour market situation and outlook in South-East Asia and the Paciic . . . . 56
8. Average annual growth rate of labour force, ASEAN Member Countries . . . 58
9. Labour market situation and outlook in South Asia . . . 60
10. Labour market situation and outlook in MENA countries . . . 64
11. Jobs gap and contribution to GDP per capita in MENA countries . . . 66
12. Labour market situation and outlook in Sub-Saharan Africa . . . 69
Boxes 1. What explains diferences in unemployment projections? . . . 20
2. MDG employment indicators . . . 31
3. Are house price cycles reponsible for the slow jobs recovery? . . . 39
4. Labour lows in Mexico: Formal versus informal lows of workers . . . . 50
5. Education and youth unemployment in Viet Nam . . . 57
6. Spill-overs from the Arab Spring: he case of Lebanon . . . 63
7. Fiscal consolidation versus employment-friendly policies – Simulation results 76 8. he potential of active labour market policies to boost growth and employment 80 Figures 1. Global and regional GDP growth estimates and projections, 2011–15 . . . 15
2. Evolution of global GDP growth estimates and projections, 2013 and 2014 . . . . 16
3. he crisis-related global jobs gap . . . . 17
4. Global unemployment trends and projections, 2003–18 . . . . 17
5. Annual change in global unemployment and GDP growth, 2000–18, baseline and downside scenario . . . 18
6. Average annual change in the youth unemployment rate, selected time periods . . . 21
7. Young people that are neither in employment, nor in education or training (NEET) as the share of the population aged 15–29 (2007 and most recent year) . . . 22
8. Annual output growth per worker, world and regions, selected periods . . . 23
9. Estimated informal employment shares, 2011 . . . . 24
10. Average unemployment duration in selected economies . . . 25
11. Macroeconomic uncertainty in selected economies . . . 26
12. Contribution of hiring uncertainty to the increase in the unemployment rate since 2007 in the United States . . . 27
13. GDP growth rates in BRICS countries . . . 28
6 Global Employment Trends 2014 | Risk of a jobless recovery?
15. Trajectory of annual GDP per capita before and ater the year
a country reaches US$3,000 . . . 30
16. Changes in employment by economic class, selected time periods and regions 31 17. Job losses by age group – Selected OECD economies (2012 vs 2007) . . . . 37
18. Skills mismatch: 2005 vs 2012 . . . . 38
19. Increase in unemployment driven by longer unemployment duration . . . . 38
20. Changes in trend unemployment . . . 41
21. GDP and employment recoveries around recession turning points (G7 countries) . . . 41
22. Annual GDP growth in Latin America, 1991–2018 . . . 47
23. Informal employment structure, 2009–12 . . . 49
24. Labour productivity index, 2000–18 . . . . 49
25. Share of wage and salaried workers in total employment and male–female gap in wage employment rates, East Asia, 1991–2013 . . . . 54
26. Share of medium- and high-skill and technology-intensive manufacturing in total manufacturing exports, selected economies in East Asia, 1995–2012 . . 54
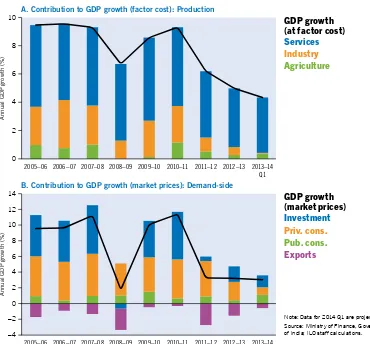
27. Two views of the drivers of growth in India: Services and consumption . . . . 59
28. Gender disparities in labour force participation rates in South Asia, various years (2009–12) . . . 61
29. Skills mismatch, overeducation and undereducation in selected economies . . . 65
30. Public investment in education in MENA countries . . . 65
31. Female participation and unemployment rates in MENA countries . . . . 66
32. FDI inlows in the MENA region by sector, 2003–10 . . . 67
33. Economic growth and vulnerable employment, by region, 2001–12 . . . . 69
34. Paid employment and employment in industry across regions, 2012 . . . 70
35. Government debt-to-GDP ratio in selected countries and country groups . . . 75
36. Current GDP vs growth at pre-crisis trends in selected countries . . . 78
7
Acknowledgements
he Global Employment Trends 2014 report was prepared by the ILO’s Employment Trends Unit in the Research Department. he team is headed by Ekkehard Ernst, who coordinated the production of the report together with Christian Viegelahn and Steven Kapsos. he report was supervised by Moazam Mahmood, Director, and Raymond Torres, Director of the Research Department.
he following authors contributed to the report:
Executive summary: Raymond Torres, Ekkehard Ernst and Steven Kapsos Chapter 1: Christian Viegelahn, Steven Kapsos, heo Sparreboom
and Valia Bourmpoula
Chapter 2: Developed Economies and European Union: Ekkehard Ernst, Faten Saliba and Damien Roache
Central and South-Eastern Europe (non-EU) and CIS: Damien Roache and Alena Nesporova
Latin America and the Caribbean: Jorge Davalos and Brenda Samaniego
East Asia: Phu Huynh
South-East Asia and the Paciic: Makiko Matsumoto and Kee Beom Kim
South Asia: Sher Verik
Middle East and North Africa: Faten Saliba and Ekkehard Ernst Sub-Saharan Africa: heo Sparreboom and Michael Mwasikakata Chapter 3: Steven Kapsos, Matthieu Charpe, Stefan Kühn and Ekkehard Ernst.
Speciic mention should be given to Valia Bourmpoula for preparing the global and regional estimates on the basis of the Global Employment Trends (GET) econometric models and for helpful research assistance. he publication would not have been possible without the con-tributions of other members of the ILO’s Employment Trends Unit – Philippe Blet, Anne Drougard and Alan Wittrup.
he team wishes to acknowledge the comments and suggestions on the drat provided by various ILO regional and country oices, and by Sandra Polaski, Deputy Director-General for Policy; James Howard, Director-General’s Oice; Aurelio Parisotto, Senior Economist in the Research Department and Juan Chacaltana, Senior Employment Specialist in ILO Lima. he analysis provided in the Global Employment Trends series is only as good as the avail-able input data. We take this opportunity to thank all institutions involved in the collection and dissemination of labour market information, including national statistical agencies and the ILO Department of Statistics. We encourage additional collection and dissemination of country-level data in order to improve the analysis of employment trends provided in future updates of this report.
9
Preface
he global labour market situation remains uneven and fragile. True, there are encouraging signs of economic recovery in those advanced economies most afected by the global inancial crisis which erupted in 2008. Also, a number of emerging and developing countries − including recently in Sub-Saharan Africa − are enjoying relatively robust economic growth. he world economy may thus be growing somewhat faster than over the past three years.
However, the report inds that those economic improvements will not be suicient to absorb the major labour market imbalances that built up in recent years. First, over the fore-seeable future, the world economy will probably grow less than was the case before the global crisis. his complicates the task of generating the more than 42 million jobs that are needed every year in order to meet the growing number of new entrants in the labour market.
Second, and more fundamentally, the root causes of the global crisis have not been prop-erly tackled. he inancial system remains the Achilles heel of the world economy. he state of many banks is such that many sustainable enterprises, notably small ones, have limited access to credit, thereby afecting productive investment and job creation. Signiicant inancial bub-bles have reappeared in a number of advanced and emerging economies, adding new uncer-tainties and afecting hiring decisions. Also, global labour incomes continue to increase at a slower pace than justiied by observed productivity gains, thus afecting aggregate demand.
hird − and this is an important new inding in view of the post-2015 development debate − little progress is being made in reducing working poverty and vulnerable forms of employment such as informal jobs and undeclared work. If conirmed, this trend would unambiguously delay the achievement of development goals.
To ensure lasting job recovery, the report highlights the role of a strategy that combines short-term measures (job-friendly macroeconomic and labour market policies) with further action to tackle long-standing imbalances. Such a strategy would strengthen the economic recovery and pave the way for more and better jobs.
Raymond Torres
11
Executive summary
Global unemployment increased by 5 million people in 2013…
he uneven economic recovery and successive downward revisions in economic growth pro-jections have had an impact on the global employment situation. Almost 202 million people were unemployed in 2013 around the world, an increase of almost 5 million compared with the year before. his relects the fact that employment is not expanding suiciently fast to keep up with the growing labour force.
he bulk of the increase in global unemployment is in the East Asia and South Asia regions, which together represent more than 45 per cent of additional jobseekers, followed by Sub-Saharan Africa and Europe. By contrast, Latin America added fewer than 50,000 add-itional unemployed to the global number – or around 1 per cent of the total increase in un-employment in 2013.
Overall, the crisis-related global jobs gap that has opened up since the beginning of the inancial crisis in 2008, over and above an already large number of jobseekers, continues to widen. In 2013, this gap reached 62 million jobs, including 32 million additional jobseekers, 23 million people that became discouraged and no longer look for jobs and 7 million econom-ically inactive people that prefer not to participate in the labour market.
… and, on current trends, it will rise by a further 13 million people by 2018…
If current trends continue, global unemployment is set to worsen further, albeit gradually, reaching more than 215 million jobseekers by 2018. During this period, around 40 million net new jobs would be created every year, which is less than the 42.6 million people that are expected to enter the labour market every year. he global unemployment rate would remain broadly constant during the next ive years, at half a percentage point higher than before the crisis.
… affecting young people disproportionately…
Young people continue to be particularly afected by the weak and uneven recovery. It is esti-mated that some 74.5 million young people – aged 15–24 – were unemployed in 2013; that is almost 1 million more than in the year before. he global youth unemployment rate has reached 13.1 per cent, which is almost three times as high as the adult unemployment rate. Indeed, the youth-to-adult unemployment ratio has reached a historical peak. It is particu-larly high in the Middle East and North Africa, as well as in parts of Latin America and the Caribbean and Southern Europe.
Importantly, in the countries for which information exists, the proportion of young people neither in employment, nor in education or training (NEET) has continued the steep upward trend recorded since the start of the crisis. In certain countries, almost one-quarter of young people aged 15 to 29 are now NEET.
… intensifying long-term unemployment in advanced economies…
12 Global Employment Trends 2014 | Risk of a jobless recovery?
unemployment has doubled in comparison with the pre-crisis situation. In the crisis coun-tries in the euro area, for instance, the average duration of unemployment has reached up to 9 months in Greece and 8 months in Spain. Even in countries where encouraging signs of an economic recovery have appeared, such as the United States, long-term unemployment afects more than 40 per cent of all jobseekers.
Such long unemployment spells are detrimental to the speed of labour market recovery even when economic activity is set to accelerate. First, they constitute a considerable burden for the public purse, requiring governments to raise taxes or cut spending elsewhere if they do not want to or cannot increase the iscal deicit. More importantly, jobseekers who have been out of employment for long periods lose their skills at an accelerating pace, making it more diicult for them to ind alternative employment at a similar occupation or skill level.
… and interrupting earlier progress in terms of, first, participation rates…
Labour force participation rates are not improving and remain more than 1 percentage point below their pre-crisis level. he drop in participation rates has been particularly pronounced in East and South Asia, where many women have let the labour market. At the same time, as educational attainment improves, young people enter the labour market at a higher age in these regions, strengthening their future labour market prospects. In the Developed Econ-omies region, on the other hand, participation rates have dropped as young workers in par-ticular do not see opportunities in the labour market. Other regions, such as Central and Eastern Europe, experienced an increase in participation rates. here, and in other coun-tries with less well-developed social security systems and which sufered from large losses in (formal) employment, many previously economically inactive people returned to the labour market, oten to take up informal employment in order to make up for the loss of household income.
… second, vulnerable employment, expected to reach 48 per cent of total employment…
Vulnerable employment – that is, either self-employment or work by contributing family workers – accounts for almost 48 per cent of total employment. Persons in vulnerable employment are more likely than wage and salaried workers to have limited or no access to social security or secure income. he number of people in vulnerable employment expanded by around 1 per cent in 2013, which is ive times higher than during the years prior to the crisis.
… third, working poverty, with 839 million workers living on less than US$2 a day…
he number of working poor continues to decline globally, albeit at a slower rate than during previous decades. In 2013, 375 million workers (or 11.9 per cent of total employment) are esti-mated to live on less than US$1.25 per day and 839 million workers (or 26.7 per cent of total employment) have to cope on US$2 a day or less. his is a substantial reduction in compar-ison with the early 2000s when the corresponding numbers of working poor below US$1.25 and US$2 were more than 600 million and more than 1.1 billion, respectively. However, the progress in reducing working poverty has stalled. In 2013, the number of workers in extreme poverty declined by only 2.7 per cent globally, one of the lowest rates of reduction over the past decade, with the exception of the immediate crisis year.
… and, finally, stubbornly high informal employment.
Executive summary 13 America, some countries have made good progress in maintaining informality rates below 50 per cent but low-income Andean and Central American countries continue to experience rates of 70 per cent or more. Signiicantly higher informality rates can be found in economies in South and South-East Asia. In some countries in these regions, informality rates reach up to 90 per cent of total employment. Even though progress in reducing poverty has been strongest in these regions, the lack of formal employment opportunities is likely to constitute a barrier to a sustainable further reduction in poverty.
Tackling the employment and social gaps requires job-friendly macroeconomic policies…
A faster recovery in global labour markets is held back by a deicit of aggregate demand. In this respect, the iscal consolidation currently under way in many advanced economies consti-tutes a drag on faster expansion of output growth, in addition to weak private consumption. his report shows that a rebalancing of macroeconomic policies and increased labour incomes would signiicantly improve the employment outlook. Simulation results suggest that in high-income G20 countries, such a rebalancing could reduce unemployment by 1.8 percentage points by 2020, which corresponds to 6.1 million additional jobs. hese achievements would also support iscal goals. Indeed, simulation results suggest such a policy approach would result in a signiicant improvement over the baseline status quo scenario.
Monetary policy continues to be accommodative, providing a beneicial stimulus to aggregate demand. Estimates of the impact of the current monetary policy regime show that unemployment would have been 1–2 percentage points higher in large advanced economies if policy-makers had not undertaken swit monetary action in the face of the inancial crisis. Recent trends, however, indicate that an increasing share of the additional liquidity generated by such accommodative monetary policy is lowing into asset markets rather than into the real economy. his is generating the risk of future stock and housing price bubbles, potentially weighing on sustainable job recovery.
Given weak demand, uncertain sources of future demand and ample liquidity, large irms have tended to buy back shares and increase dividend payments to shareholders, rather than investing in the real economy. Estimates show that in certain countries hiring uncertainty can exercise upward pressure on unemployment over and above weak aggregate demand, an efect that can persist even when the recovery in economic activity is taking up. he result is a further constraint on employment creation.
… and greater attention to labour market and social policies.
1. Macroeconomic challenges and global
labour market developments
Some positive signs in advanced economies
amidst deceleration in emerging economies
In 2013, global economic growth slowed down to 2.9 per cent, its lowest rate since 2009 and more than 1 percentage point below the average annual growth rate over the pre-crisis decade (igure 1). Economic growth in emerging economies slowed down signiicantly whereas a modest pick-up in activity was recorded in advanced economies towards the end of the year. However, downside risks continue to predominate at the global level as aggregate demand is weak and macroeconomic uncertainty remains elevated.
Weaker economic growth in emerging and developing countries relects both low aggre-gate demand, particularly for their exports, and global inancial instability associated with macroeconomic policy conditions in advanced economies. Recent outlows of capital from emerging markets in expectation of a less accomodative monetary policy stance in the United States have highlighted their vulnerability to volatile capital lows and external policy devel-opments.1 he slowdown in emerging and developing countries is also a result of adjustment problems that have clouded the medium-term economic horizon. Ater a rapid catch-up, some large emerging and developing countries are facing signiicant bottlenecks, notably in terms of infrastructure and human capital, which are likely to weigh on growth in the coming years.
In 2013, the Developed Economies and European Union region grew at a meagre rate of 1.0 per cent, 0.4 percentage points lower than in the year before. Annual output growth in the United States decelerated from 2.8 per cent in 2012 to 1.6 per cent in 2013, while the
1 In fact, according to some accounts, around one-third of the efect of quantitative easing on the long-term interest rate in the United States was undone merely through expectations of a less accommodative monetary policy, raised by the US Federal Reserve in May 2013 (World Bank, 2013a).
15 Note: * 2013 are preliminary estimates; 2014–15 are projections.
Source: IMF, World Economic Outlook Database, October 2013.
Figure 1. Global and regional GDP growth estimates and projections, 2011–15 (per cent)
–1 6
3 9
Central and South-Eastern
Europe (non-EU)
and CIS Developed
Economies and European
Union
East Asia Latin America
and the Caribbean
Middle East North Africa South-East
Asia and
the Pacific
South Asia Sub-Saharan
Africa WORLD
2011 2012 2013* 2014* 2015*
0
A
n
n
u
al G
D
P g
ro
w
th (
%
16 Global Employment Trends 2014 | Risk of a jobless recovery?
shit in iscal and monetary policies have kept growth in Japan at a relatively strong 2.0 per cent, unchanged from the previous year. Growth in the euro area remained weak, although the region managed to exit recession during the year. he European Union as a whole experi-enced stagnation, with a growth rate close to zero in 2013. he only two regions worldwide in which growth did not slow between 2012 and 2013 were South Asia and East Asia, which saw accelerations from 3.6 to 3.9 per cent and from 6.6 to 6.7 per cent, respectively. All other regions lost momentum in growth, with Central and South-Eastern Europe growing at a rate of 2.5 per cent, Latin America and the Caribbean at 2.7 per cent and Sub-Saharan Africa at 4.8 per cent in 2013. his is 0.3–0.5 percentage points lower than in 2012. A more pro-nounced deceleration took place in South-East Asia and the Paciic, where the growth rate dropped from 5.7 per cent in 2012 to 4.9 per cent in 2013. he largest growth decelerations took place in the Middle East and North Africa, mainly due to political events.
he world economy is expected to see a modest recovery, with growth of 3.6 per cent in 2014, mainly driven by a pickup in activity in advanced economies (IMF, 2013). How-ever, economic growth projections have consistently proved too optimistic over the past two years (igure 2). In fact, several international organizations, including the IMF, expected the recovery to occur much earlier. Projections had to be revised downwards repeatedly, illus-trating a broader problem with the assessment of the foundations of future growth. Unless a more solid foundation for future growth is built, the growth projections for 2014 may fail to materialize once again, thereby adversely afecting the employment outlook.
Unemployment edges higher in 2013 and is expected
to remain at elevated levels for many years to come
Labour markets have been afected by the slower-than-projected economic recovery. Employment growth slowed down in 2013 across most regions, leading to a further upward revision of unemployment rates (see box 1 for a comparison of the current forecast with an earlier one). Global employment grew by a mere 1.4 per cent in 2013 – broadly unchanged from 2012, but lower than in any year of the pre-crisis decade. Employment growth deteri-orated in every geographic region except South Asia and North Africa. Indeed, it was the strong acceleration of employment growth in South Asia that helped keep global employment growth stable in 2013 compared with 2012. he largest slowdowns occurred in Central and
Figure 2. Evolution of global GDP growth estimates and projections, 2013 and 2014 (per cent)
2.0 3.0 3.5
2.5 4.0
Note: The graph shows global GDP growth estimates/projections for 2013 and 2014, produced by the International Monetary Fund (IMF), the World Bank and United Nations (UN) at different points in time.
Source: IMF, World Economic Outlook; UN, Project LINK Global Economic Outlook; UN, World Economic Situation and Prospects; World Bank, Global Economic Prospects (several editions).
Apr. May June July Aug. Sep. Oct. Nov. Dec. Jan. Feb. Mar. Apr. May June July Aug. Sep. Oct. Nov. Dec. Jan. Feb. Mar. Apr. May June July Aug. Sep. Oct.
2013, IMF
2013, UN
2013, World Bank
2014, IMF
2014, UN
2014, World Bank
2011 2012 2013
A
n
n
u
al G
D
P g
ro
w
th (
%
1. Macroeconomic challenges and global labour market developments 17 South-Eastern Europe and CIS, Latin America and the Caribbean and South-East Asia and the Paciic. As a consequence, the crisis-related global jobs gap, measuring the number of jobs lost in comparison to pre-crisis trends, widened further to 62 million workers in 2013 (igure 3). he jobs gap includes not only the increase in unemployment, but also those people who have remained outside or dropped out of the labour force ater having been discouraged by long spells of unemployment and/or perceived low prospects of inding new job oppor-tunities. At the global level, the ILO estimates that a total of 23 million people are currently in this situation, so-called “discouraged workers”. As unemployment continues to persist, by 2018 the global gap is projected to rise to 81 million; this includes some 30 million discour-aged workers who might never come back to the labour market.
he global unemployment rate remained at 6.0 per cent of the global labour force, unchanged from 2012. he number of unemployed around the world is estimated to have reached 201.8 million in 2013, an increase of 4.9 million from a revised 196.9 million in the previous year. here were 31.8 million more unemployed persons around the world in 2013 than in 2007, prior to the onset of the global economic crisis (igure 4). On the basis of current macroeconomic projections, the ILO expects little improvement in the global labour market in 2014, with the global unemployment rate ticking up to 6.1 per cent and the number of un-employed rising by a further 4.2 million.
Figure 3. The crisis-related global jobs gap
2550 2850 3000 3150 3300
2700 3450
Note: The graph shows the global jobs gap, i.e. the difference between the estimated/projected evolution of total employment on the one hand and employment as implied by the pre-crisis trend on the other hand. Source: ILO, Trends Econometric Models, October 2013.
1999 2000 2001 2002 2003 2004 2005 2006 2007 2008 2009 2010 2011 2012 2013 2014 2015 2016 2017 2018 Pre-crisis trend
62 mil
81 mil
Estimated/Projected
Upper and lower bound of the confidence interval around the baseline forecast
E
m
p
lo
ym
e
n
t (
m
illi
o
n
s)
Figure 4. Global unemployment trends and projections, 2003–18
140 160 170 180 190 200 210
150 220
4.8 5.2 5.4 5.6 5.8 6.0 6.2 6.4
5.0 6.6
Note: * 2013 are preliminary estimates; 2014–18 are projections. The graph displays past trends and projections for global unemployment.
Source: ILO, Trends Econometric Models, October 2013.
2003 2004 2005 2006 2007 2008 2009 2010 2011 2012 2013* 2014* 2015* 2016* 2017* 2018*
Total unemployment
Unemployment rate
U
n
e
m
p
lo
ym
e
n
t (
m
illi
o
n
s) Une
m
p
lo
ym
e
n
t r
a
te (
%
18 Global Employment Trends 2014 | Risk of a jobless recovery?
Should a sustainable economic recovery fail to materialize once again, a downside scenario would imply that unemployment would rise much faster than in the baseline (igure 5). In such a scenario, global economic growth in 2014 would reach only 2.8 per cent, which is 0.1 per-centage points less than in 2013 and 0.8 per0.1 per-centage points below the baseline. Also, ater 2014, output growth would be around 1 percentage point lower in each year than in the base-line. Based on these assumptions, unemployment is projected to increase by a further 5 mil-lion jobseekers relative to the baseline projection of 215 mil5 mil-lion in 2018. he unemployment rate would reach 6.2 per cent in 2018 compared to 6.0 per cent in the baseline. Most of the additional increase in unemployment in the downside scenario would occur in the Developed Economies and European Union region, with almost 3 million more unemployed by 2018 than in the baseline scenario.
Labour market developments difer widely across regions and countries (table 1). In the Developed Economies and European Union region, 8.6 per cent of the labour force is un-employed, which is almost 3 percentage points higher than in 2007. Unemployment rates in the United States and the United Kingdom have declined, whereas they have edged up fur-ther in Italy and France. Only small improvements in the unemployment rate were seen in Canada, Japan and Germany. In the medium term, only the United States is expected to see substantially declining unemployment rates, and even there, the unemployment rate is pro-jected to remain above pre-crisis levels. For other G7 countries, the unemployment rate is not projected to move substantially from current levels for the foreseeable future.
Across the regions, the highest unemployment rates are observed in North Africa and the Middle East, at 12.2 and 10.9 per cent respectively in 2013, largely unchanged as compared with 2012. In Central and South-Eastern Europe and CIS the unemployment rate remained relatively high in 2013, at 8.2 per cent, with an estimated increase of the unemployment rate in Turkey and the Russian Federation. Latin America and the Caribbean only saw a marginal decline in its regional unemployment rate, which edged down from 6.6 to 6.5 per cent. In Brazil, the unemployment rate went down slightly, while it ticked up in Mexico and Argentina. No signiicant changes in the regional unemployment rate are forecast in the year to come. In all other regions, unemployment rates remained roughly unchanged in 2013, as compared with the year before.
he global employment-to-population ratio stood at 59.6 per cent in 2013, unchanged from 2012 and still well below the pre-crisis level of 60.7 per cent.2 he male
2 he employment-to-population ratio measures employment as a share of the working-age population aged 15+. Figure 5. Annual change in global unemployment and GDP growth,
2000–18, baseline and downside scenario
–12 –6 12
6 18 24
–1 1 2 3 4 5
0 6
Note: * 2013 are preliminary estimates; 2014–18 are projections. The graph displays past trends and projections for annual changes in global unemployment. The chart also includes projections for the annual change in global unemployment under the assumption of a deterioration in world economic developments from 2014 onwards. Source: IMF, World Economic Outlook Database, October 2013; ILO, Trends Econometric Models, October 2013.
2003 2004 2005
2000 2001 2002 2006 2007 2008 2009 2010 2011 2012 2013* 2014* 2015* 2016* 2017* 2018*
C
h
an
g
e
i
n
u
n
e
m
p
lo
ym
e
n
t (
m
il
lio
n
s)
G
D
P g
ro
w
th r
a
te (
%
)
Total unemployment Total unemployment
Downside scenario
Annual real GDP growth rates (%) Annual real GDP growth rates (%)
Downside scenario
1. Macroeconomic challenges and global labour market developments 19 employment-to-population ratio stood at 72.2 per cent and the female ratio at 47.1 per cent, both essentially unchanged from the previous year. he global male unemployment rate edged up to 5.8 per cent in 2013 from 5.7 per cent in 2012, while the rate for women remained unchanged at 6.4 per cent. he employment-to-population ratio and unemployment rate indi-cators paint a picture not of a sharp or abrupt deterioration in the global labour market in 2013, but rather of a continued, gradual weakening, which is a result of the combination of persistently elevated unemployment rates combined with a gradual decline in the growth rate of the world’s working-age population.
Table 1. Global, regional and country-specific estimates and projections of the total unemployment rate, 2007–16 (percentage points)
Country/region 2007 2012 2013* 2014* 2015* 2016*
World 5.5 6.0 6.0 6.1 6.1 6.1
G20 Economies 5.1 5.7 5.8 5.8 5.8 5.8
G20 Advanced Economies 5.7 8.4 8.4 8.4 8.3 8.1 G20 Emerging Economies 4.9 4.9 5.0 5.1 5.1 5.1 Developed Economies and the European Union 5.8 8.6 8.6 8.6 8.4 8.2
Australia 4.4 5.2 5.6 5.7 5.7 5.8
Canada 6.0 7.2 7.1 7.0 7.0 6.9
Japan 3.9 4.3 4.1 4.0 4.0 4.0
United States 4.7 8.2 7.5 7.2 6.8 6.4
European Union 7.2 10.5 11.0 11.1 11.1 10.9
France 8.0 9.9 10.5 10.9 10.8 10.7
Germany 8.6 5.4 5.3 5.3 5.4 5.4
Italy 6.1 10.7 12.2 12.6 12.7 12.7
United Kingdom 5.4 8.0 7.5 7.3 7.2 7.1
Central and South-Eastern Europe (non-EU) and CIS 8.2 8.0 8.2 8.3 8.2 8.2
Russian Federation 6.0 5.5 5.8 5.8 5.8 5.8
Turkey 10.3 9.2 9.9 10.0 9.7 9.6
Middle East 10.2 10.9 10.9 11.0 10.9 10.8
North Africa 11.1 12.1 12.2 12.2 12.1 12.1
Sub-Saharan Africa 7.5 7.6 7.6 7.6 7.5 7.5
South Africa 22.3 25.0 25.3 25.2 25.1 25.1
Latin America and the Caribbean 6.9 6.6 6.5 6.5 6.5 6.5
Argentina 8.5 7.2 7.3 7.4 7.4 7.3
Brazil 8.1 6.9 6.7 6.6 6.5 6.5
Mexico 3.4 4.9 5.0 4.9 4.8 4.7
East Asia 3.8 4.4 4.5 4.7 4.8 4.9
Republic of Korea 3.2 3.2 3.2 3.3 3.3 3.4
South-East Asia and the Pacific 5.5 4.1 4.2 4.3 4.3 4.3
Indonesia 9.1 6.1 6.0 6.0 6.0 6.0
South Asia 4.1 3.9 4.0 4.0 4.1 4.1
Note: * 2013 are preliminary estimates; 2014–16 are projections. Estimates and projections for individual G20 countries are shown only when they are based on a minimum number of actual data points. Figures might differ from national estimates or those published in the Panorama Laboral (ILO, 2013a), mainly as a result of differences in geographical coverage.
20 Global Employment Trends 2014 | Risk of a jobless recovery?
Box 1. What explains differences in unemployment projections?
As in previous editions of Global Employment Trends, global and regional unemployment levels and rates have been revised to take into account new information as it becomes available and revisions in economic growth projections. This box provides an overview of the revisions since the
latest projection update in July 2013(table B1.1). A dis-tinction is made between revisions due to differences in the various input data used in Trends Econometric Models
(TEM) – including national unemployment rates, changes in GDP growth rate estimates and projections – and changes in labour force and population estimates.
New data on unemployment rates. Revisions in the histor-ical unemployment data come either from revisions made by the original sources or from the fact that sometimes data releases from national labour force surveys contain a substantial time lag, which can be up to one or two years or even more in some rare cases.
Overall, there were 37 new observations in TEM October 2013 as compared to the TEM July 2013; 17 of these new data points refer to the period 2000–11, and 20 refer to 2012. For example, there were six more observations for Azerbaijan (2000–05), five more observations for Kuwait (2006–08, 2010–11), two more observations for Qatar (2006 and 2008) and one more observation for Tajikistan (2009).
In addition, the unemployment rate for India (2012) was revised upwards as the results of the all-India household survey (68th round survey programme during the period July 2011 to June 2012, conducted by the National Sample Survey Office) became available. This survey is the inter-nationally comparable and utilized source for the historical series for the Indian unemployment rate.
Moreover, prior to 2012 there were some substantive revisions on some of the unemployment rate input data. For example, the unemployment rate was revised up- wards by more than 1 percentage point for Colombia (2002–06) and Tunisia (2005), and the unemployment rate for Armenia (2008) was revised downwards by about 12 percentage points.
In both TEM July and October 2013, unemployment estimates were preliminary for 52 countries for which only
some quarters were available. In the most recent model run (TEM October 2013), the most recent quarter available was the third quarter, whereas in the previous model run, the most recent quarter available was the second. However, even with the additional information, the point estimate for these countries did not change significantly.
GDP growth rates. Taken from the IMF’s World Economic Outlook (WEO) database, GDP growth estimates and fore-casts change from one version of the WEO to another. For example, between the WEO July 2013 update and the WEO October 2013, the GDP growth rate for Botswana was revised, specifically, for 2009 it was revised downwards by 3.1 percentage points. For 2012, the global GDP growth rate was revised upwards by 0.1 percentage points. For 2013, the global GDP growth rate was revised downwards by 0.2 percentage points. Such revisions of GDP and un -employment input data can also lead to revisions in the esti-mated relationship between the unemployment rate and the GDP growth rate, resulting in further revisions to global and regional estimates of key labour market indicators.
The baseline estimate of the global unemployment rate in 2012 and 2013 has been revised upwards respectively by 0.04 and 0.01 percentage points. In 2012 and 2013, respectively, 36 and 46 per cent of the revision was caused by GDP growth rate revisions, and 64 and 54 per cent was caused by changes in the unemployment input data. How-ever, the current estimates remain within the confidence interval that accompanied the previous forecasts.
Labour force estimates. The newest version of the ILO
Economically Active Population Estimates and Projections
(EAPEP) database (2013 edition) provided a new labour force benchmark for the GET estimates. In the meantime, the all-India household survey referring to 2012 became available. At the global level, this revision reduced the labour force estimate for 2012 by 12.4 million, which trans -lated into a reduction in the estimated global participation rate of 0.2 percentage points. Overall, the impact of the labour force revision on the global unemployment rate was negligible compared with the revisions of GDP growth rates and unemployment input data.
Table B1.1. Comparison of unemployment estimates/projections from July and October 2013
2007 2008 2009 2010 2011 2012 2013* 2014 * 2015 * 2016 * 2017 * 2018 *
Unemployment (millions)
TEM, October 2013 170.0 177.0 197.9 195.2 193.9 196.9 201.8 206.0 208.8 211.0 213.1 215.2 TEM, July 2013 169.9 178.3 197.8 195.0 193.2 196.3 202.2 205.9 208.5 210.6 212.7 214.8 Unemployment rate (per cent)
TEM, October 2013 5.5 5.6 6.2 6.1 6.0 6.0 6.0 6.1 6.1 6.1 6.1 6.0 TEM, July 2013 5.5 5.7 6.2 6.1 5.9 5.9 6.0 6.0 6.0 6.0 6.0 6.0
Note: * 2013 are preliminary estimates; 2014–18 are projections.
1. Macroeconomic challenges and global labour market developments 21
Labour market situation of youth worsens further
he labour market outlook for young people worsened in nearly every region of the world. he global youth unemployment rate rose to 13.1 per cent in 2013, from 12.9 per cent in 2012 and 11.6 per cent in 2007. he largest increase occurred in the Middle East region. his region has one of the highest youth unemployment rates in the world, with 27.2 per cent of young people in the labour force without work in 2013, versus 26.6 per cent in 2012. Cen-tral and South-Eastern Europe (non-EU) and CIS, East Asia, South-East Asia and the Paciic and North Africa all saw a substantial increase in youth unemployment rates (igure 6). In the Developed Economies and European Union, the region that registered the largest increase in youth unemployment rates over the period 2007–12, unemployment among young people rose further to 18.3 per cent of the youth labour force.
In total, 74.5 million young people aged 15–24 were unemployed in 2013, an increase of more than 700,000 over the previous year. here were 37.1 million fewer young people in employment in 2013 than in 2007, while the global youth population declined by only 8.1 million over the same period. he global youth labour force participation rate, at 47.4 per cent in 2013, remains more than 2 percentage points below the pre-crisis level, as more young people, frustrated with their employment prospects, continue to drop out of the labour market. he global youth unemployment rate is expected to edge up to 13.2 per cent in 2014, with increases projected in the three Asian regions and in the Middle East, partially ofset by a projected decline in the Developed Economies and European Union region.
he share of young people (aged 15–29) that are neither in employment, nor in education or training (NEET) has risen in 30 out of the 40 countries for which data are available for 2007 and 2011–12 (see igure 7). In Ireland and Spain, the NEET rate rose by more than 9.4 and 8.7 percentage points respectively since 2007. In both countries, the NEET rate is over 20 per cent. he largest declines in NEET rates occurred in Turkey and the former Yugoslav Republic of Macedonia, but in both countries, the NEET rate remains very high, at 34.6 per cent in Turkey in 2011 and 32.1 per cent in FYR Macedonia in 2012. NEET rates are also high in Brazil, where they stood at 18.4 per cent in 2009 with considerable heterogeneity among labour market groups; only 12.1 per cent of Brazilian males were NEET but 21.1 per cent of females were afected and the rate even rose to 28.2 per cent among Afro-Brazilian female youth, a particularly high-risk group. High and/or rising NEET rates are a major con-cern for policy-makers, as this group is neither engaged in employment, nor investing in skills development. Young people that are among the NEET may be less engaged and more dissatis-ied with their societies than their peers who are employed or in the education system.
Note: * 2012–13 are preliminary estimates.
Source: ILO, Trends Econometric Models, October 2013.
C
h
a
n
g
e i
n u
n
e
m
p
lo
ym
e
n
t r
a
te
(p
e
rc
e
n
ta
g
e
p
oi
n
ts
)
Figure 6. Average annual change in the youth unemployment rate, selected time periods (percentage points)
–0.50 –0.25 0.50 0.75 1.00
0.25 1.25
Central and South-Eastern Europe (non-EU)
and CIS Developed
Economies and European
Union
East Asia Latin America
and the Caribbean
Middle East North Africa South-East
Asia and
the Pacific
South Asia Sub-Saharan
Africa WORLD
2007–12 2012–13*
22 Global Employment Trends 2014 | Risk of a jobless recovery?
Where are the decent jobs?
In addition to the slowdown in employment growth and increase in unemployment, the last year has also seen a notable deceleration in wage employment growth, which expanded by only 28.1 million in 2013, down sharply from the annual growth of more than 35 million over the previous two years. Central and South-Eastern Europe and CIS, East and South Asia saw the largest deceleration in wage employment growth as compared with 2012. Wage employment growth was also down in comparison with pre-crisis trends. If the pre-crisis trend in the wage employment share since 2000 had continued, there would now be almost 22 million more workers in wage employment as opposed to vulnerable employment (table 2). his gap com-pared with pre-crisis trends is expected to increase to more than 60 million by 2018. In contrast to wage employment trends, vulnerable employment around the world increased by 13.4 mil-lion in 2013 compared with an increase of only 5.3 mil13.4 mil-lion in 2012 and 3.3 mil13.4 mil-lion in 2011.3
3 Vulnerable employment comprises own-account workers and contributing family workers, two employment groups on average characterized by higher poverty rates and limited social protection.
Source: ILO (2013e, table 10c).
NEET rate (%)
Figure 7. Young people that are neither in employment, nor in education or training (NEET) as the share of the population aged 15–29 (2007 and most recent year)
0 5 10 15 20 25 30 35 40 45
2007 Most recent year
1. Macroeconomic challenges and global labour market developments 23 By sector, services accounted for more than half of total global employment growth in 2013, while agricultural employment accounted for around one quarter. Overall, just below 32 per cent of the world’s workforce was employed in the agricultural sector in 2013, a decline of 11.7 percentage points over the previous two decades. he services sector employed 45.1 per cent of the world’s workers in 2013 and the share of services workers rose by 10.1 percentage points over the same period. Industrial employment now accounts for around 23 per cent of all global employment, an increase of only 1.6 percentage points over the past two decades. In 2013, employment in industry grew by 9.7 million, compared with an average of more than 21 million new industrial jobs annually between 2010 and 2012.
Labour productivity growth trends provide further insights related to these observed global labour market dynamics. Global productivity growth (measured as growth in output per worker) declined from 1.6 per cent in 2012 to 1.4 per cent in 2013, reaching its second lowest value at any time over the past decade (igure 8). In this light, the output of irms and economies is growing slowly both because labour input has not increased substantially and because productivity is growing more slowly compared with past years.
Slower productivity and employment growth have coincided with a strong recovery in corporate proits and global equity markets. he FTSE global all cap index, which tracks 7,200 publicly traded stocks across 47 countries, gained more than 18 per cent in the year to mid-December 2013 and had risen more than 158 per cent since the low reached in March 2009. he year 2013 saw a further widening between trends in global proit growth and equity prices on the one hand and the global labour market on the other. Modest relative global wage growth in recent years, coupled with a long-term decline in labour shares of national income in many countries, provides further evidence to this efect (ILO, 2013b).
Table 2. The global wage employment gap (millions)
2007 2012 2013 2014 2015 2016 2017 2018
Global wage employment –
estimated/projected
1394 1542 1570 1596 1622 1650 1676 1702
Global wage employment –
continuation of pre-crisis trends
1394 1557 1592 1626 1661 1695 1729 1763
Global wage employment gap 0.0 15.4 21.6 30.2 38.3 45.2 52.9 60.6
Note: The table shows the global wage employment gap, i.e. the difference between estimated projected wage employment on the one hand and wage employment as implied by the pre-crisis trend (2000–08) of the wage employment share on the other.
Source: ILO, Trends Econometric Models, October 2013.
Note: * 2013 are preliminary estimates.
Source: ILO, Trends Econometric Models, October 2013; World Bank, World Development Indicators Database, 2013; IMF, World Economic Outlook Database, October 2013.
Figure 8. Annual output growth per worker, world and regions, selected periods (per cent)
–1 6
4
2 8
Central and South-Eastern Europe (non-EU)
and CIS Developed
Economies and European
Union
East Asia Latin America
and the Caribbean
Middle East North Africa South-East
Asia and
the Pacific
South Asia Sub-Saharan
Africa WORLD
1991–2007 2007–11 2012 2013*
0
A
n
n
u
al o
u
tp
u
t g
ro
w
th p
e
r w
o
rk
e
r (
%
24 Global Employment Trends 2014 | Risk of a jobless recovery?
Moreover, it is important to note that the large increases in global asset prices are occur-ring as interest rates set by central banks across much of the developed world remain at or near the zero bound, with several large central banks still engaged in large-scale quantitative easing programmes. he successful eforts by central banks to keep interest rates low, while generally being supportive of economic recovery, may have unintended consequences in terms of irms’ incentives and the overall risk appetites of market participants. In many economies, share buybacks and dividends are at or near record levels, while hiring remains muted, as further discussed in Chapter 3.
he strong rise in asset prices in some countries that has accompanied the extraordi-nary monetary policy eforts raises concerns about potential bubbles, which could once again threaten economic growth and labour market prospects. Moreover, strong increases in house prices in some countries may also have adverse knock-on efects on job creation through a negative impact on competitiveness, as will be argued in Chapter 2 (box 3).
High rates of informality hamper sustainable
progress in poverty reduction
In developing countries, many workers are self-employed in precarious conditions or are employed on a casual basis without a contract and access to social security. Such forms of employment are considered to be informal. Oten, employment is informal out of necessity for those not able to ind formal jobs and in the absence of privately or publicly provided social protection. Some-times, informal employment is a tactic to avoid taxation and regulation. In most cases, informal employment procures lower, more volatile pay and worse working conditions than employment in formal arrangements. Women continue to face a higher risk of informal employment than men, as they oten have less legal and social protection. Being young in the labour market also increases the risk of informality. Finally, self-employed people face much higher risk of informality in developing countries, in part because the legal framework is weak in many such countries and also due to their engagement in low-productivity activities (e.g. street vending).
New estimates of the share of workers in informal employment for 2011 show that informal employment is particularly widespread in Africa, the Asian regions and Latin America and the Carib bean, with a cross-country average of between 40 and 50 per cent (igure 9). Estimates for Central and South-Eastern Europe (non-EU) and CIS and the Middle East are relatively lower, but still hover between 15 and 30 per cent. Bringing more workers out of informality remains crucial in order to reduce working poverty, improve working
Figure 9. Estimated informal employment shares, 2011 (per cent)
0 40 60
20 80
Africa (selected countries)
Asia
and the Pacific
(selected countries)
Central and South-Eastern Europe
(non-EU) and CIS (selected countries)
Middle East (selected countries)
Latin America and the Caribbean (selected countries)
In
fo
rm
al e
m
p
lo
ym
e
n
t a
s a s
h
a
re
o
f t
o
tal e
m
p
lo
ym
e
n
t (
%
)
Note: Maximum and minimum calculations are based on a sample of 49 countries (eight countries
in Africa, 11 countries in Asia and the Pacific,
11 countries in Central and South-Eastern Europe (non-EU) and CIS, 16 countries in Latin America and the Caribbean and three countries in the Middle East).
Source: Davalos and Ernst (forthcoming); ILO staff calculations.
B
B
B
B
B
H
H
H
H
H
Maximum
1. Macroeconomic challenges and global labour market developments 25 conditions and generate tax revenues that governments need to strengthen social welfare sys-tems. However, in the past decade, the share of workers in informal employment declined in only 26 out of 49 countries for which estimates are available.
Unemployment is becoming more persistent
he average duration of unemployment has gone up in many economies (igure 10). In the United States, the average unemployed worker found a job ater 3–4 months of job search prior to the crisis, but the average duration increased to around six months in 2012. In Spain, unemployment duration increased from around ive months in 2008 to eight months in 2012. In Greece, where the average unemployment duration has always been high, the unemployed now wait on average more than nine months before getting back into the workforce, more than a month longer than in 2009. Other developed countries experienced similar increases in unemployment duration. In several developing and emerging countries, in contrast, the average unemployment duration has trended downwards and the global economic crisis had only a slight impact on unemployment duration. Only in South Africa did the average un-employment duration increase, rising by 0.5 months to more than nine months over the period from 2008 to 2011.
Longer spells of unemployment can have persistent efects. As unemployment spells lengthen, labour market attachment tends to diminish and skills to depreciate. he observed increase in the average unemployment duration in some countries can make job searches harder and unemployment more persistent (e.g. Shimer, 2008). his change in the composition of the unemployment pool has likely been another factor inhibiting a labour market recovery.
Unemployment comes with considerable personal and social costs, such as decreased life satisfaction and stigmatization. Further, the iscal cost of unemployment is oten underesti-mated, both for the short term and for the medium to long term. he most obvious short-term iscal cost of an increase in unemployment is the immediate cost of higher unemployment beneits and welfare payments. Spain, for example, has seen an increase in iscal expenditure on unemployment beneits and early retirement plans from 1.5 per cent of GDP in 2007 to 2.9 per cent in 2011, contributing to the increase in public debt in the country. For Ireland,
Figure 10. Average unemployment duration in selected economies (months)
3 4 6
5 7 8 9 10
Note: To calculate the average, unemployment is assumed to be distributed equally within the different duration categories, e.g. the average unemployment duration of those unemployed for more than three and less than six months is assumed to be 4.5 months. The average unemployment duration of those unemployed for at least 12 months is assumed to be exactly 12 months.
Source: ILO (2013e).
2004 2005
2003 2006 2007 2008 2009 2010 2011 2012
Spain
Greece
United Kingdom
Canada United States
Japan
Turkey
Brazil
South Africa
U
n
e
m
p
lo
ym
e
nt
d
ur
a
tio
n
(
m
o
n
th
26 Global Employment Trends 2014 | Risk of a jobless recovery?
this expenditure category has grown even faster, from 0.9 per cent of GDP in 2007 to 2.6 per cent of GDP in 2011.4 In addition to direct outlays, elevated unemployment levels indicate that an economy is producing below potential, which, in turn, has a negative impact on economic growth and on associated tax revenues, forcing governments to either cut on the expenditure side or increase their debt holdings.
Unemployment can also have adverse iscal efects in the medium and long term. As longer unemployment spells lower workers’ earnings throughout their careers, more tax rev-enues are foregone. Further, at least partly due to lower income, the unemployed tend to become less healthy on average than the employed, which increases the need for public health expenditures. hese are costs that public budgets will have to address in the years to come.
Economic uncertainty remains high, with negative effects on hiring
One of the factors weighing on labour markets is hiring uncertainty that increased at the onset of the crisis in 2007 (igure 11). Given the persistence of weak aggregate demand and the uncertainty about the strength and speed of future recovery, irms may choose to wait for new information and further developments before investing and hiring (see also ILO, 2013c). In 2013, uncertainty continued to be fuelled in some countries by the lack of policy coordination
4 hese numbers were calculated on the basis of data from Eurostat.
Figure 11. Macroeconomic uncertainty in selected economies
A. United States
0 20 60
40 80 100
Note: Uncertainty indicators are shown on a scale from 0 to 100 for 2004–13. Source: Ernst and Viegelahn (forthcoming); Baker, Bloom and Davis (2013).
2005
2004 2006 2007 2008 2009 2010 2011 2012 2013
Q1 Q3 Q1 Q3 Q1 Q3 Q1 Q3 Q1 Q3 Q1 Q3 Q1 Q3 Q1 Q3 Q1 Q3 Q1 Q3
B. United Kingdom
0 20 60
40 80 100
2005
2004 2006 2007 2008 2009 2010 2011 2012 2013
Q1 Q3 Q1 Q3 Q1 Q3 Q1 Q3 Q1 Q3 Q1 Q3 Q1 Q3 Q1 Q3 Q1 Q3 Q1 Q3
C. Italy
0 20 60
40 80 100
2005
2004 2006 2007 2008 2009 2010 2011 2012 2013
Q1 Q3 Q1 Q3 Q1 Q3 Q1 Q3 Q1 Q3 Q1 Q3 Q1 Q3 Q1 Q3 Q1 Q3 Q1 Q3
D. France
0 20 60
40 80 100
2005
2004 2006 2007 2008 2009 2010 2011 2012 2013
Q1 Q3 Q1 Q3 Q1 Q3 Q1 Q3 Q1 Q3 Q1 Q3 Q1 Q3 Q1 Q3 Q1 Q3 Q1 Q3
Policy uncertainty Hiring uncertainty
Policy uncertainty Hiring uncertainty
Policy uncertainty Hiring uncertainty Policy uncertainty
Hiring uncertainty
In
d
ic
a
to
r v
al
u
e (
n
o
rm
al
iz
e
d
)
In
d
ic
a
to
r v
al
u
e (
n
o
rm
al
iz
e
d
1. Macroeconomic challenges and global labour market developments 27 and the continued delaying of critical decisions. his elevated level of uncertainty is particu-larly harmful towards employment in economies with salary schemes that tie signiicant components of managers’ salaries directly or indirectly to the short-term proitability of com-panies. Since investments require an upfront cost and generate a return only in the medium or long term, there is little incentive for managers to invest (Smithers, 2013), and they may ind it more attractive to buy back company shares or increase dividends (see Chapter 3). If the uncertainty surrounding returns to productive investment is elevated, these incentives are decreased further. Business investment and hiring rates, as a consequence, decrease.
Hiring uncertainty is a measure for the uncertainty that weighs on employers when they make decisions about hiring new workers.5 In contrast, policy uncertainty intends to measure the uncertainty that surrounds economic policy decisions of governments. Both hiring uncer-tainty and policy unceruncer-tainty are at elevated levels in most of the G7 economies when com-pared with pre-crisis years (igure 11). For all countries, both indicators of uncertainty are highly correlated, which indicates that much of the uncertainty that is relevant for hiring managers is also related to decisions by policy-makers. he hesitation of companies to invest is therefore unlikely to be driven merely by economic fundamentals.
Uncertainty may be a signiicant factor afecting unemployment in some countries, making it more persistent. For the United States, for instance, estimates indicate that the trend in unemployment since 2007 can be largely associated with movements in output growth. he lack of aggregate demand has been the most important factor in the increase of unemployment rates during the crisis. Uncertainty rather had a level-impact, shiting un-employment rates up by an additional 1.5 percentage points (igure 12).
How is the growth slowdown in emerging economies
shaping labour markets?
Between 2011 and 2013, growth in emerging economies slowed markedly, another major trend shaping global labour markets (igure 13). In the previous decade, China grew at 10.5 per cent annually, but growth decelerated to 7.6 per cent in 2013 and is expected to slow further to an average of 7.0 per cent in the period from 2014 to 2018. India grew at a rate of only 3.2 per cent in 2012. Even though growth re-accelerated to 3.8 per cent in 2013, this igure is still far below the 7.6 per cent observed on average between 2001 and 2010. Brazil has also seen more growth in 2013 compared with 2012, but growth fell short by more than 1 percentage point of
5 See Appendix for a discussion of the ILO hiring uncertainty indicator and its set-up.
Figure 12. Contribution of hiring uncertainty to the increase in the unemployment rate since 2007 in the United States (percentage points)
–0.5 0.5 1.0 1.5 2.0 2.5 3.0 3.5
Note: The graph depicts the contributions of uncertainty, GDP growth and other factors to changes in the unemployment
rate of the United States since the first
quarter of 2007, based on the estimations of a structural VAR model.
Source: Ernst and Viegelahn (forthcoming).
2011 2012
2009 2010
2007 2008
Uncertainty
GDP growth
Other factors
0
C
o
n
tr
ib
u
ti
o
n
s t
o c
h
a
n
g
e i
n t
h
e u
n
e
m
p
lo
ym
e
n
t r
a
te
si
n
c
e 2
0
0
7
Q
1 (
p
e
rc
e
n
ta
g
e p
o
in
ts
28 Global Employment Trends 2014 | Risk of a jobless recovery?
the igures achiev