Progress on the
New York Declaration on Forests
An Assessment Framework and Initial Report
November 2015
Acknowledgements
This report is in the public domain. Users are welcome to download, save, or distribute this report electronically or in any other format. An electronic copy of this report is available at
www.forestdeclaration.org. Please use the following citation:
Climate Focus. 2015. Progress on the New York Declaration on Forests – An Assessment Framework and Initial Report. Prepared by Climate Focus, in collaboration with Environmental Defense Fund, Forest Trends, The Global Alliance for Clean Cookstoves, and The Global Canopy Program.
Authors:
Darragh Conway, Paul Keenlyside, Stephanie Roe, Charlotte Streck (project leader), Gustavo Vargas-Victoria, Theo Varns.
Principal Data Sources:
Chatham House, Forest Trends, Global Witness, The Global Canopy Programme, The Global Alliance for Clean Cookstoves, The Rights and Resources Initiative, The Sustainability Consortium, The World Resources Institute.
Advisory Group:
Marco Albani, Joseina Braña-Varela, Penny Davies, Donna Lee, Charles McNeill, Nat Keohane, Nigel Purvis, Lucia Ruiz, Daniel Zarin
Acknowledgements:
We gratefully acknowledge the many individuals who ofered their time and expertise, in many diferent ways, to the development and improvement of this work. Special thanks goes to Melissa Tupper and Charlie Parker. This project was funded by the Climate and Land Use Alliance.
Disclaimer: Any views expressed in this report are those of the authors. They do not necessarily represent the views of the supporting institutions or the inancial sponsors of this report.
Design:
Circle Digital - www.circle.co.ke
Contents
Foreword
4
Executive
Summary
5
Introduction
9
Goals
Goal 1 11
Goal 2 15
Goal 3 20
Goal 4 23
Goal 5 26
Goal 6 29
Goal 7 31
Goal 8 33
Goal 9 36
Goal 10 39
Summary
of
Assessment
44
Foreword
Helen Clark
Administrator of the United Nations Development Programme
We stand at a crossroads, and not even the smoke and haze from thousands of burning forest and peatland ires can obscure the stark choice before us. Do we, in partnership, recognize and act upon the imperative of conserv
-ing and restor-ing natural forests as part of a 21st century strategy for grow-ing better, stronger, more inclusive rural economies? Or do we revert to “business-as-usual” depletion of natural resources, with most of the inancial beneits accruing to narrow private interests and most of the costs—social and environmental as well as inancial —debited against broader public interests and falling disproportionately on the poor, including small farmers and
indigenous communities?
Agriculture, forestry, and other land uses are responsible for nearly a quarter of all anthropogenic emissions of greenhouse gases, about half of that from deforestation and forest degradation, mostly driven by demand for food
and wood products, and inequities and ineiciencies in the use of land for their production. The newly adopted Sustainable Development Goals recognize that forests provide goods and services, which are essential for human societies to thrive. Forests provide economic, social, and environmental beneits locally, regionally, and globally—
including for climate change mitigation and resilience. Hence promoting action to protect forests is in the self-in-terest of the international community.
Last year, the New York Declaration on Forests (NYDF) promised action, bringing together an extraordinary coali -tion of government, business, indigenous, and civil society leaders in recogni-tion of the indispensable roles which
forests play globally—from mitigating climate change and bufering its impacts, to the vast array of economic,
cultural, and environmental goods and services which well-managed forests can provide.
The ten goals laid out in the Declaration speak to shared commitments to a range of critical outcomes around
reducing deforestation, forest restoration, international agreements and inance, and better governance. This
document, “Progress on the New York Declaration on Forests: An Assessment Framework and Initial Report,” and the supporting website (www.forestdeclaration.org), represent both an initial efort to monitor the extent to which
those commitments are being realized, and an intention to monitor future progress toward meeting NYDF goals.
One year on is too early for drawing conclusions about progress in most areas. But new initiatives have been
launched, additional commitments have been made, and implementation has begun. More action is urgently needed.
We stand at a crossroads. Transparency and accountability are essential elements for choosing wisely. This prog-ress report and the supporting website provide the former, promote the latter, and tell us where we must have bet-ter information than what is currently available. In so doing, it provides the global community with a great service,
and provides NYDF signatories and others with encouragement to carry on the important work they have begun.
We look forward to future editions of this report in the years ahead, and to the delivery on the promises made in
Executive Summary
In September 2014, a broad coalition of governments, corporations, indigenous peoples’ organizations, and nongovernmental organizations signed the New York Declaration on Forests (NYDF), thereby en -dorsing its 10 goals. Achieving NYDF goals could reduce the global emissions of greenhouse gases by 4.5 – 8.8 billion metric tons every year.
Goal 1 is to halt natural forest loss by 2030, with a 2020 milestone of a 50% reduction. Most other goals are subsidiary to Goal 1, including halting deforestation from agricultural supply chains (Goal 2), reducing deforestation from other economic sectors (Goal 3), and supporting alternatives to deforesta -tion driven by poverty and basic needs (Goal 4). One goal is aimed at restoring 150 million hectares of degraded land by 2020 and an additional 200 million hectares by 2030 (Goal 5). Another set of goals aims at improving the enabling environment to help signatories and other entities meet the deforesta-tion goals. These goals include establishing a strong internadeforesta-tional framework (Goals 6 and 7), better inancing (Goals 8 and 9), and improved forest governance with more secure forest and land rights for local communities and indigenous peoples (Goal 10).
The NYDF is supported by an action agenda, but lacks a process or methodology that would allow monitoring progress toward achieving its goals. “Progress on the New York Declaration on Forests: An Assessment Framework and Initial Report” seeks to ill that gap by proposing a framework of indica -tors that could provide an initial assessment and monitor progress over time. This report is supported by a website (www.forestdeclaration.org) with supplementary material, including a detailed assessment of the status of each goal. The creation of this framework is intended to support the monitoring of progress toward meeting the NYDF goals.
For an initial assessment, we propose a number of imperfect indicators and proxies that allow the mea -surement of progress toward the goals. We anticipate that indicators will improve over time as data gaps and shortcomings of existing datasets are illed.
Box 1: Action taken in the last 12 months
Since the signing of the New York Declaration on Forests in September 2014, early achieve -ments have already emerged. Most notable has been the inclusion in the inal text of the Sus -tainable Development Goals of an ambitious target to halt deforestation by 2020. Also note -worthy are national government pledges to restore nearly 40 million hectares of forest, tripling the previous amount. In terms of forest inance, early indications are that 2014 oicial devel -opment assistance commitments to reduce emissions from the forest sector were the largest to date, though they have yet to be oicially reported. Finance for clean, eicient cookstoves, in particular, has accelerated dramatically. Large private-sector actors continue to make sustain -ability pledges, with one-third of all pledges to reduce or end deforestation from supply chains made since 2014. Large institutional investors are beginning to consider the forest implications of their investments. For example, the Norwegian Pension Fund has begun to divest shares in companies associated with unsustainable palm oil production, and has introduced new guide-lines to exclude investment in companies whose activities entail unacceptable greenhouse gas emissions. Some progress has also been made to further strengthen forest governance and the rights of indigenous peoples. With respect to the latter, indigenous, community, and civil society organizations have launched the irst global initiative to map indigenous and community land.
Summary analysis for the New York Declaration on Forests goals:
Goal 1. At least halve the rate of loss of natural forests globally by 2020 and strive to end natural forest loss by 2030.
Key messages:
• Globally, the annual loss of natural forest area appears to be declining, if forest regrowth is counted
as ofsetting forest clearing.
• At the same time, there is no sign that the annual rate at which natural forests are being cleared or harvested is slowing.
Goal 2. Support and help meet the private-sector goal of eliminating deforestation from the production of agricultural commodities such as palm oil, soy, paper, and beef products by no later than 2020, recogniz-ing that many companies have even more ambitious targets.
Key messages:
• Half the forests providing wood iber for paper are under sustainability certiied production. Certiied sustainable palm oil has grown to 18% of the global market. Certiied sustainable soy is only 2% of the global market. There is no data on beef products. For palm and soy, most certiication is through sustainability ofsets rather than on-site certiication.
• The number of companies pledging to reduce deforestation has grown rapidly in recent years and for
palm oil and wood iber represents a large percentage of production. Overall it is still a small per
-centage of agricultural commodity market actors. Companies that endorsed the NYDF generally have
Goal 3. Signiicantly reduce deforestation derived from other economic sectors by 2020.
Key messages:
• The most signiicant nonagricultural drivers of forest loss are infrastructure development, human settle -ments, and mining.
• Though some interventions can be highlighted, there is no coordinated efort to track efort to reduce
the forest impact of these sectors.
Goal 4. Support alternatives to deforestation driven by basic needs (such as subsistence farming and reliance on woodfuel for energy) in ways that alleviate poverty and promote sustainable and equitable development.
Key messages:
• In the absence of data on interventions to tackle subsistence agriculture as a driver of forest loss, we focus solely on woodfuel interventions for which data is available.
• The global distribution of clean cookstoves is accelerating rapidly, almost doubling every year from
2008 to 2013. Global investments in clean cookstove distribution have also increased in recent years, peaking at US$260 million in 2014.
Goal 5. Restore 150 million hectares of degraded landscapes and forestlands by 2020 and signiicantly
increase the rate of global restoration thereafter, which would restore at least an additional 200 million hectares by 2030.
Key messages:
• Since 2011, countries, regions and organizations have committed to restore 62.6 million hectares of forest landscapes under the Bonn Challenge—approximately 42% of the 2020 restoration target. To meet the 2020 target, restoration pledges will need to be made at a greater rate to cover the remaining 90 million hectares.
• Parties to the United Nations Framework Convention on Climate Change have committed to restore, reforest, and/or aforest about 122 million hectares as part of their land-sector intended nationally de
-termined contributions—approximately 35% of the 350-million-hectare 2030 restoration target.
Goal 6. Include ambitious, quantitative forest conservation and restoration targets for 2030 in the post-2015 global development framework as part of new international sustainable development goals. Key messages:
• An ambitious and quantitative target for forest conservation has been adopted as part of the
Sustain-able Development Goals, namely to halt deforestation by 2020.
• However, no ambitious and quantitative target for forest restoration has been adopted.
Goal 7. Agree in 2015 to reduce emissions from deforestation and forest degradation as part of a post-2020 global climate agreement, in accordance with internationally agreed rules and consistent with the goal of not exceeding 2°C warming.
Key messages:
• Although the contents of the post-2020 agreement to be reached in December 2015 are not known, it is
unlikely that the main agreement will include more than a high-level reference to forests.
• Of the 122 countries that have submitted public outlines of their post-2020 mitigation contributions (INDCs), 40 have included speciic actions on land use and forests, while 18 have excluded land use and
Goal 8. Provide support for the development and implementation of strategies to reduce forest emissions. Key messages:
• In the 12 years from 2002 to 2013, though varying signiicantly from year to year, bilateral ODA for reducing forest emissions in developing countries increased from an annual average of US$365 million during 2002-07 to US$744 million in 2008-13.
• There is not suicient data to track public inance lows between developing countries, or domestic
spending in developed and developing countries to reduce forest-related emissions, but indications are
that it is increasing. Neither is there suicient data to track private investment in strategies to reduce
forest emissions but indications are that it is also increasing.
Goal 9. Reward countries and jurisdictions that, by taking action, reduce forest emissions—particularly
through public policies to scale-up payments for veriied emission reductions and private-sector sourcing
of commodities. Key messages:
• Between 2008 and 2014, over US$3 billion was committed, almost exclusively from international public sources, for performance-based REDD+ payments. Disbursements, at just over US$1 billion, have
lagged behind commitments.
• The forest carbon market expanded rapidly to US$237 million in 2011, but growth has subsequently leveled of.
Goal 10. Strengthen forest governance, transparency and the rule of law, while also empowering com-munities and recognizing the rights of indigenous peoples, especially those pertaining to their lands and resources.
Key messages:
• Forest governance has improved modestly in recent years, coinciding with a signiicant expansion of bilateral and multilateral programs providing inancial support to that end.
• Illegality remains high in the wood-based products market.
• Forest communities continue to live under the threat of violence, with killings related to land disputes continuing unabated.
Introduction
The New York Declaration on Forests (NYDF) was endorsed by more than 150 governments, companies and business associations, indigenous peoples’ and civil society organizations at the United Nations Climate Summit in September 2014. Since then, the number of signatories has grown to more than 180. These signatories have committed to do their part to achieve the NYDF’s ten goals and follow its accompanying action agenda.1
The NYDF has roots in other processes, and its aims overlap with the Sustainable Development Goals and the new climate agreement expected to be adopted in December 2015 in Paris. The NYDF builds on the Tropical Forest Alliance 2020 and other initiatives. Complementary processes include the 2011 Bonn Challenge to restore 150 million hectares of degraded land by 2020 and the Aichi Biodiversity Targets, which include at least halving the loss of all natural habitats. The NYDF goals are well aligned with discussions and agreements on forests that have emerged in international climate negotiations. Achieving NYDF goals could reduce the global emissions of greenhouse gases (GHG) by 4.5–8.8 billion metric tons every year.2
The NYDF comprises 10 goals (Table 1). The irst and overarching goal is to strive to end natural forest loss by 2030, with a 2020 milestone of a 50% reduction. A number of the other goals are subsidiary to Goal 1, including halting defor -estation from agricultural supply chains (Goal 2), reducing deforestation from other economic sectors (Goal 3), and supporting alternatives to deforestation driven by poverty and basic needs (Goal 4). Another goal calls for restoring 150 mil -lion hectares of degraded land by 2020 and an additional 200 million hectares by 2030 (Goal 5). A set of goals aim at improving the enabling en-vironment to help signatories and other entities meet deforestation-related goals; they include establishing a strong international framework (Goals 6 and 7), better inancing (Goals 8 and 9),
and improved forest governance with more se-cure forest and land rights for local communities and indigenous peoples (Goal 10).
The NYDF goals may be categorized according to the following typology:
• Quantitative output goals (1 and 5) provide numeric targets, and are timebound.
• Qualitative output goals (3 and 10) are direc -tional, and may or may not be timebound. • Support goals (2, 4, and 8) refer to inputs in
-tended to help achieve the goals.
• Policy goals (6 and 7) refer to the inclusion of forest conservation, restoration, or emission reductions in international agreements. • Reward goals (9) refer to results-based pay
-ments to countries and/or subnational jurisdic-tions.
This report proposes a framework for assessing progress toward NYDF goals and summarizes the status of the ten goals on the one-year anniver-sary of the NYDF signing. The NYDF is ambitious,
and its signatories represent a powerful and diverse coalition. Nevertheless, while the NYDF is supported by an action agenda, it does not deine a process or establish a forum to monitor progress toward achieving its goals. This report aims to address that gap.
A number of indicators and proxies are proposed for measuring progress toward NYDF goals. The diferent types of NYDF goals present distinct challenges for monitoring progress. For example, where goals are framed quantitatively, data are often missing; where goals are framed qualita-tively, it can be diicult to agree on appropriate metrics to measure progress. Indicators and monitoring will likely improve over time as data gaps are illed.
Detailed summaries of our assessments for each goal are available online at:
www.forestdeclaration.org.
Table 1: The 10 NYDF goals to halt deforestation
Goals
Goal 1. At least halve the rate of loss of natural forests globally by 2020 and strive
to end natural forest loss by 2030
Goal 2. Support and help meet the private-sector goal of eliminating deforestation from the production of agricultural commodities such as palm oil, soy, paper, and
beef products by no later than 2020, recognizing that many companies have even
more ambitious targets
Goal 3. Signiicantly reduce deforestation derived from other economic sectors by
2020
Goal 4. Support alternatives to deforestation driven by basic needs (such as sub-sistence farming and reliance on fuel wood for energy) in ways that alleviate pov-erty and promote sustainable and equitable development
Goal 5. Restore 150 million hectares of degraded landscapes and forestlands by
2020 and signiicantly increase the rate of global restoration thereafter, which would restore at least an additional 200 million hectares by 2030
Goal 6. Include ambitious, quantitative forest conservation and restoration targets
for 2030 in the post-2015 global development framework, as part of new interna -tional sustainable development goals
Goal 7. Agree in 2015 to reduce emissions from deforestation and forest degrada
-tion as part of a post-2020 global climate agreement, in accordance with interna
-tionally agreed rules and consistent with the goal of not exceeding 2°C warming
Goal 8. Provide support for the development and implementation of strategies to reduce forest emissions
Goal 9. Reward countries and jurisdictions that, by taking action, reduce forest
emissions—particularly through public policies to scale-up payments for veriied
emission reductions and private-sector sourcing of commodities
Goal 10. Strengthen forest governance, transparency, and the rule of law, while
also empowering communities and recognizing the rights of indigenous peoples,
Goal 1
At least halve the rate of loss of natural forests globally by 2020 and
strive to end natural forest loss by 2030
KEY MESSAGES
• Globally, the annual loss of natural forest area appears to be declining, if forest regrowth is counted as ofsetting forest clearing.
• At the same time, there is no sign that the annual rate at which natural forests are being cleared or harvested is slowing.
The NYDF’s overarching goal, Goal 1, aims to end natural forest loss by 2030, with at least a 50% reduction by 2020 as a milestone toward its achievement. While natural forests clearly do not include monoculture tree plantations. Goal 1 does not specify whether the aim is to reduce and then end gross or net loss of natural forests (see Box 1 for deinitions). Thus we have selected separate proxy indica -tors to monitor each type of loss:
INDICATOR 1
Annual gross forest/tree cover loss in hectares
INDICATOR 2
Annual net natural forest/tree cover change in hectares
We used data from Hansen et al. (2013, updated by Global Forest Watch) for Indicator 1 and data from the Food and Agriculture Organisation of the United Nations’ Global Forest Resources Assessment (FAO FRA 2015) for Indicator 2. Each indicator uses a diferent method and both embody substantial uncer -tainties (see Data Gaps and Limitations section, below, and supplementary material for more detail). • The Hansen et al. (2013) dataset uses satellite imagery at a 30 meter pixel resolution and measures
areas with tree cover as a proxy for forest area, deined as all vegetation 5 meters or taller with a default canopy cover threshold of 25%. Global Forest Watch (GFW) illustrates the Hansen et al. 2013 dataset, with updated data for 2013 and 2014 using a 30% default canopy threshold (www. globalforestwatch.org).
• FAO FRA compiles data on forest area reported by countries every ive years. Forests are deined based on national land use classiications, with a minimum threshold of 0.5 hectare of land area, trees over 5 meters and a 10% minimum canopy cover. The igures for net natural forest loss are reported by subtracting the total natural forest area of one reporting period from that of the previ-ous reporting period.
Gross loss of natural forest measures the magnitude of annual change, counting all tree cover or forest
area lost, without regard to any regeneration or reforestation of natural forest. Since 1988, this approach
has been used by the Brazilian Space Agency (INPE) to monitor deforestation in the Brazilian Amazon. INPE’s analyses are widely recognized as credible and transparent. In this satellite-based approach, a pixel classiied as forest in 1988 may be deforested only once, after which it is masked from future analy -sis, regardless of whether its conversion to “non-forest” is temporary or permanent. Ending gross natural forest loss would mean that, from year-to-year, there would be no measurable clearing of natural forest area.
Net loss of natural forests measures the diference in forest area between two points in time, averaged
over the number of years between reporting periods. The United Nations Food and Agriculture Organiza
-tion’s Global Forest Resources Assessment (FAO FRA) monitors net changes in forest area every ive years, based on tabular data that are self-reported by participating countries – using their own inventories, sur
-veys, and maps. Recent data assembled and analyzed by FAO FRA allow separation of net natural forest
loss from plantation forest data. Ending net natural forest loss would mean that the measurable area of natural forest regeneration/reforestation is equal to or greater than the measurable area of gross natural
forest loss over a speciied time period.
Beyond the data limitations described for the Goal 1 indicators, there are important trade-ofs between
targeting gross vs. net natural forest loss:
• Gross forest loss treats loss as categorically distinct from regeneration/reforestation (noting that the
latter is addressed in Goal 5), whereas net forest loss conlates the two. For numerous purposes, and
in most (but not all) cases, newly regenerating/reforesting areas are inferior to the forests that they
ofset under a net accounting approach. These purposes include:
º Carbon storage, insofar as it can take 30 to 300 or more years for an area of regenerated or restored forest to accumulate the amount of carbon emitted to the atmosphere from the same area of lost natural forest,
hence regeneration/restoration is unlikely to ofset carbon emissions from natural forest loss—especially if the “new forest” subsequently experiences cycles of clearing and regrowth. Zero net forest loss does not equal zero net forest emissions.
º Hydrological cycle functions may return more quickly than carbon storage, but it generally takes well over a
decade of regrowth to regain the extent of water-pumping from ground to atmosphere that deep-rooted natu -ral forests provide, hence the potential impact on rainfall may be important.
º Biodiversity difers between older and younger forests with marked changes in plant species composition, and
structure in the new forests ofering diferent habitats that attract diferent types of wildlife.
Achieving zero natural forest loss could result in perverse outcomes for both gross and net accounting
approaches, unless modiications or contingencies to the deinition of “zero” are developed and applied:
º Because zero gross natural forest loss means no clearing of any natural forest for any purpose, strict adher-ence would translate (inter alia) to:
– No construction of roads or other infrastructure in natural forest areas.
– No clearing of natural forest (including secondary forest) for agriculture of any kind, even by small farmers and/or indig -enous peoples.
– Overmanagement of forests to prevent loss, including where disturbances (e.g., natural ires) are part of maintaining a
healthy ecosystem.
º Because zero net natural forest loss conlates loss with reforestation/regeneration, this target could be
successfully achieved at the same time as the world’s remaining primary/old-growth forests are completely replaced by regenerated forests.
Sources:
Brown, S., and Zarin, D. (2013); FAO. (2015); INPE. (2015)
INDICATOR 1
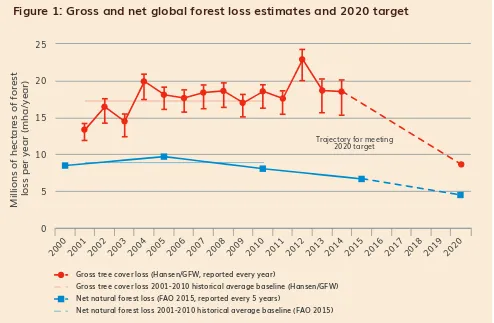
Figure 1 shows the data from both Hansen/GFW and FAO FRA over 15–20 years as well as the 2020 targets. The Hansen/GFW data shows an increase in gross tree cover loss (9%) between 2010 and 2014 compared with the preceding decade. In the igure, gross tree cover loss (red line) spikes in 2012, and trends downward in 2013 and 2014, but there is not signiicant progress toward halving gross an -nual loss by 2020.
INDICATOR 2
As for net natural forest loss (blue line), the FAO FRA data show a signiicant and continuous decline in net forest loss since the 2000-05 reporting period (roughly a 25% decrease in the 2010-15 reporting period compared with the 2001-10 historical average). The rate of net natural forest loss may be on a trajectory for meeting the milestone of halving natural forest loss by 2020.
Figure 1: Gross and net global forest loss estimates and 2020 target
The Hansen/GFW data for gross tree cover loss is depicted using the default canopy cover of 30%, with the upper error bars representing 50% canopy cover and lower error bars representing estimates at 10% canopy cover. The FAO FRA data for net natural forest loss is depicted using the default canopy cover of 10%, aggregated for the 140 countries that reported.
Source: Climate Focus graph based on Hansen et al 2013 (updated on GFW) and FAO FRA 2015.
Data Gaps and Limitations
A major limitation of the Hansen data set is that it does not distinguish between natural forest and plantations, land-use designations, or types of forest disturbance (e.g., logging, ires, storms). Tree cover loss counts tree plantation rotations and shifting cultivations as well as natural disturbances, and
20002001 2002 20032004 2005 20062007 2008 20092010 2011 20122013 2014 20152016 2017 20182019 2020 0
5 10 15 20 25
Gross tree cover loss (Hansen/GFW, reported every year)
Gross tree cover loss 2001-2010 historical average baseline (Hansen/GFW)
Net natural forest loss (FAO 2015, reported every 5 years)
Net natural forest loss 2001-2010 historical average baseline (FAO 2015)
Millions of hec
tares
of fores
t
los
s per year (mha/yea
r)
does not distinguish them from anthropogenic natural forest conversion. GFW intends to delineate plantations for seven key tropical countries so they can be removed from this analysis.
Goal 2
Support and help meet the private-sector goal of eliminating
defor-estation from the production of agricultural commodities such as palm
oil, soy, paper, and beef products by no later than 2020, recognizing
that many companies have even more ambitious targets
KEY MESSAGES
• Half the forests providing wood iber for paper are under sustainability certiied production. Certiied sustainable palm oil has grown to 18% of the global market. Certiied sustainable soy is only 2% of the global market. There is no data on beef products. For palm and soy, most certiication is through sustainability ofsets rather than on-site certiication.
• The number of companies pledging to reduce deforestation has grown rapidly in recent years and for palm oil and wood iber represents a large percentage of production. Overall it is still a small percentage of agricultural commodity market actors. Companies that endorsed the NYDF generally have better-than-average sustainability ratings.
Goal 2 targets eliminating deforestation from the production of a deined set of agricultural commod -ities by 2020 and relects a pledge by the Consumer Goods Forum, a private sector consortium.4 Agri-culture causes about two-thirds of all deforestation in tropical countries, where commercial agriAgri-culture accounts for about 40% and subsistence agriculture accounts for about 33% of total tropical forest loss.5 Commercial tropical agriculture increasingly drives tropical forest loss because of growing de-mand for a small group of agricultural commodities including palm oil, soy, paper, and beef.6
To assess progress on the private-sector goal of halting deforestation from agricultural commodities, we selected two proxy indicators. The irst measures the market share of certiied sustainable palm oil, soy, paper, and beef production. The second measures private companies’ and governments’ support for the production of low deforestation or deforestation-free commodities.
These indicators are imperfect measures of progress toward meeting Goal 2 (see supplementary mate -rials), but can help monitor the direction of progress.
INDICATOR 1
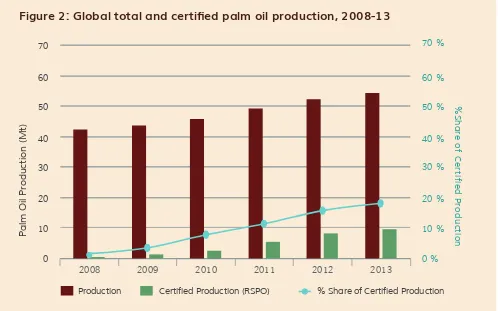
The market share of certiied production varies across the commodities considered for this goal. Be -tween 2008 and 2013, certiied sustainable palm oil production increased from 0.6 million tons to 9.8 million tons, representing 18% of global palm oil production (Figure 2). However, a large proportion of sustainable production is currently certiied through sustainability ofsets,7 which means that forest
INDICATOR 1
Market share of certiied commodities
(palm oil, soy, paper, beef)
INDICATOR 2
Companies’ and governments’ support
may still be lost in production. Most production is still uncertiied in major producing countries like Indo -nesia, Malaysia, and Thailand.8
In contrast, the share of certiied sustainable soybean production remained constant between 2008 and 2012 reaching a mere 2.1% of global soybean production by 2012. In the coming years, the Round Table on Responsible Soy expects a doubling in market share of certiied soy among its members.9
According to the International Council of Forest & Paper Associations half the total industry-managed forests supplying pulp for paper are under certiication from the Forest Stewardship Council (FSC) or the Programme for the Endorsement of Forest Certiication (PEFC).10 However, certiication has pla -teaued with three-quarters of the certiied forest areas located in North America and Western Europe. Bringing more industrial forest under certiication will require the expansion of certiication programs in developing countries.
There is no global certiication standard on sustainably produced beef with market share information. This leaves a monitoring gap in one of the major deforestation risk commodities.
Figure 2: Global total and certiied palm oil production, 2008-13
Production refers to the global production of palm oil. Certiied Production (RSPO) refers to the production with a certiication
from the Roundtable on Sustainable Palm Oil.
Source: Climate Focus calculations based on data from the Roundtable on Sustainable Palm Oil (2015), and FAOSTAT for the
global production data for palm oil.
% S h a re o f C e rt if ie d P ro d u c tio n
2008 2009 2010 2011 2012 2013
0 20 10 30 50 70 40 60 0 % 20 % 10 % 30 % 50 % 40 % 60 % 70 %
Production Certified Production (RSPO) % Share of Certified Production
P
alm Oil Pr
oduction (M
INDICATOR 2
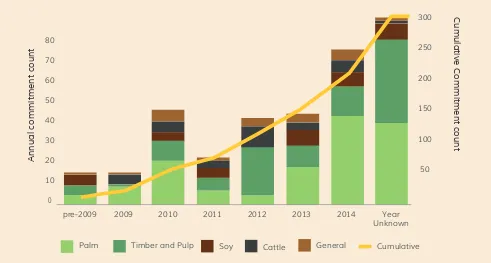
The number of pledges by corporations to reduce deforestation risk in their production, supply, and procurement of commodities has rapidly increased from the single digits in 2009 to the hundreds by September 2015, according to Forest Trends’ Supply-Change.org platform, which tracks corporate commitments (Figure 3).11 Although many large companies that play a signiicant role in these supply chains have made commitments, the percentage of companies in the major commodity supply chains that have made pledges remains low.
Figure 3: Number of companies making commitments to reduce deforestation
Source: Courtesy of Supply Change, a project of Forest Trends. 2015. www.supply-change.org
According to Forest 500,12 an initiative of the Global Canopy Programme, only 7% of the most inluen -tial companies identiied as “powerbrokers” in these agricultural supply chains have zero or zero net deforestation commitments covering all agricultural commodities they use, produce or procure. Never -theless, it is encouraging that a large proportion of companies identiied by Forest 500 have commod -ity-speciic production or procurement policies. A greater number of palm oil and timber companies have commodity-speciic sustainability commitments than soy or cattle companies (Figure 3). Of the companies with commodity-speciic commitments, those in the palm oil sector had the most compre -hensive policies and scored highest in a system that measures the progress in meeting deforestation-re-lated commitments.13
The Sustainability Consortium14 develops key sustainability performance indicators used by Walmart and other companies to evaluate supplier performance on issues including commodity-speciic defor -estation commitments. Focused on product categories such as paper, beef, and seed oils, these indi-cators enable retailers and other users to track progress on product-level environmental and social
pre-2009 2009 2010 2011 2012 2013 2014
0 10 20 30 40 50 60 70 80
50 100 150 200 250 300
Year Unknown
Annual commitment count
Cumulativ
e Commi
tment count
General Cattle
Soy Timber and Pulp
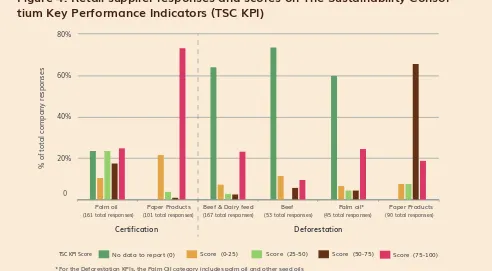
Figure 4: Retail supplier responses and scores on The Sustainability
Consor-tium Key Performance Indicators (TSC KPI)
The KPIs evaluate the success of the companies in meeting their deforestation-related commitments. Soy-based feed is included
in the Beef and Dairy Feed KPI. These scores are based on supply chain reporting conducted by companies.
Source: Figure provided by The Sustainability Consortium based on personal communication.
impacts.Although companies may source certiied iber and palm oil, less than 20% can report that their supply is 100% certiied or 100% deforestation free. Additionally, only 20% of companies can report zero deforestation in their dairy and beef feed supply chain and the majority of companies have no data on deforestation for either feed or cattle.15 Availability of data and visibility into long supply chains is important in understanding how companies score on these indicators. Data availability may improve as systems are put in place for annual reporting.
Figure 4 shows key performance indicator (KPI) results on commodity-speciic deforestation commit -ments by retailers as compiled by The Sustainability Consortium.
Compared with companies from other sectors, inancial institutions have made the least progress in supporting sustainable, low-deforestation, or deforestation-free commodity production. Less than 20% of major investors have developed forest safeguards or made commodity-speciic pledges. However, a number of major banks have signed up to the Banking Environment Initiative and/or the Natural Capi -tal Declaration suggesting that the risks associated with investing in companies involved in deforesta-tion are beginning to be acknowledged.
As for governments, according to Forest 500, almost a quarter of the exporting and almost half of the
0
No data to report (0) Score (0-25) Score (25-50) Score (50-75) Score (75-100)
% of total company responses 20%
40% 60% 80%
Palm oil Paper Products Beef & Dairy feed Beef Palm oil* Paper Products
TSC KPI Score
Certification Deforestation
(161 total responses) (101 total responses) (167 total responses) (53 total responses) (45 total responses) (90 total responses)
importing countries have made public zero-deforestation commitments for one or more commodities.
Data Gaps and Limitations
Goal 3
Signiicantly reduce deforestation derived from other economic sectors
by 2020
KEY MESSAGES
• The most signiicant nonagricultural drivers of forest loss are infrastructure development, human settlements, and mining.
• Though some interventions can be highlighted, there is no coordinated efort to track efort to reduce the forest impact of these sectors.
Goal 3 focuses on economic sectors other than agriculture. The most signiicant non-agricultural drivers of deforestation are infrastructure development, human settlements, and mining, while logging is the most important driver of forest degradation.16 Between 2000 and 2010, infrastructure (construction of roads, railroads, pipelines, hydroelectric dams) and human settlements (urban expansion) were each responsible for 10% of all tropical deforestation, while mining accounted for 7% of all tropical defor -estation. During the same period, timber extraction and logging accounted for approximately 52% of all tropical forest degradation, making them the main drivers of total forest degradation (see Goal 10).
Unfortunately, few countries have disaggregated data that link deforestation spatially to particular drivers. The lack of such data prevents adequate measurement of aggregate deforestation from infra-structure, mining, and logging and makes it diicult to formulate indicators. Consequently, we do not deine indicators to track progress toward Goal 3, but rather highlight public and private sector activi -ties that address these drivers and thereby reduce pressure on forests. Public policies and private-sec-tor-led initiatives show action that has been or can be taken to support this goal, though we cannot assess its efectiveness.
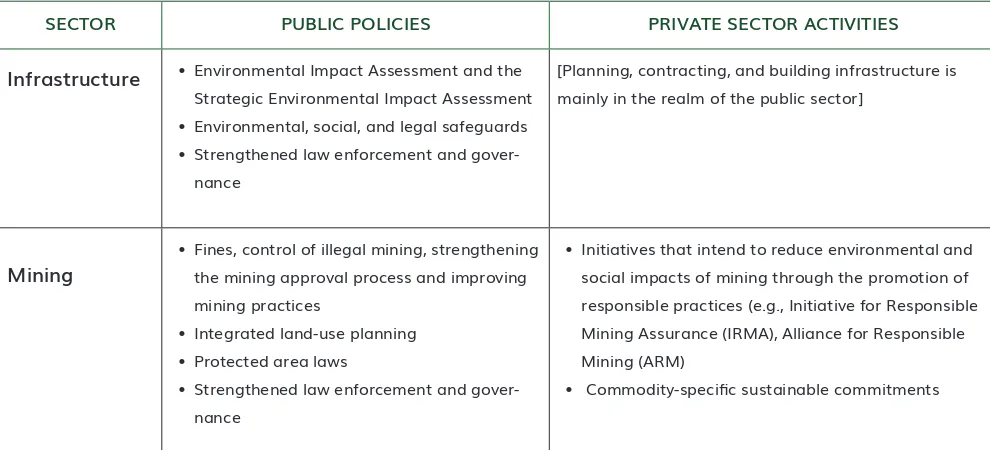
Table 2 summarizes public polices and private sector activities in infrastructure and mining that ad -dress economic drivers of deforestation. Additional measures are taken to control human settlements and infrastructure. The timber and logging sector is discussed in Goal 10 below.
Table 2: Public and private interventions addressing some economic drivers of
defor-estation
Enhanced regulation and oversight can better control these non-agricultural drivers and may reduce their impacts on forests. Examples of such approaches include:
• Regulation of activities and enforcement (e.g., Peru is starting to control gold mining by introducing ines for illegal mining, strengthening its mining approval process, and regulating mining practices;17 charcoal production in the Congo Basin is being regulated).
• Integrated land-use planning that reconciles mining development and forest conservation (e.g., infrastructure associated with the Mbalam-Nabeba iron project are developed in an integrated land use process that takes into account biodiversity and forest cover in Cameroon and the Republic of Congo).18
• Designation of protected areas (e.g., heightened protection of ecosystems is included in the Constitu-tion of Colombia).
Currently, no certiication scheme sets standards for minimizing the impacts of mining on forests. How -ever, the Initiative for Responsible Mining Assurance and the Alliance for Responsible Mining promote responsible mining practices that reduce environmental and social impacts.
Public inance institutions have environmental, social, and legal safeguards to ensure that their inanc -ing operations do not cause environmental and social damage. The World Bank’s safeguard policies, for example, require its lending to be accompanied by environmental and social risk assessments and risk-reduction plans. World Bank operational principles explicitly address forests: for example, no inancing is allowed of projects that “would involve signiicant conversion or degradation of critical forest areas or related critical natural habitat,”19 or of “natural forest harvesting or plantation develop-ment that would involve any conversion or degradation of critical forest areas or related critical natural habitats.”20 In addition, social and environmental impact assessments are often mandated by law as well as by public and private institutions that inance infrastructure.
SECToR PUblIC PolICIES PRIvATE SECToR ACTIvITIES
Infrastructure • Environmental Impact Assessment and the
Strategic Environmental Impact Assessment
• Environmental, social, and legal safeguards
• Strengthened law enforcement and
gover-nance
[Planning, contracting, and building infrastructure is
mainly in the realm of the public sector]
Mining
• Fines, control of illegal mining, strengthening the mining approval process and improving
mining practices
• Integrated land-use planning
• Protected area laws
• Strengthened law enforcement and
gover-nance
• Initiatives that intend to reduce environmental and
social impacts of mining through the promotion of
responsible practices (e.g., Initiative for Responsible
Mining Assurance (IRMA), Alliance for Responsible
Mining (ARM)
Data Gaps and Limitations
Goal 4
Support alternatives to deforestation driven by basic needs (such as
subsistence farming and reliance on fuel wood for energy) in ways that
alleviate poverty and promote sustainable and equitable development
KEY MESSAGES
• In the absence of data on interventions to tackle subsistence agriculture as a driver of forest loss, we focus solely on woodfuel interventions for which data is available.
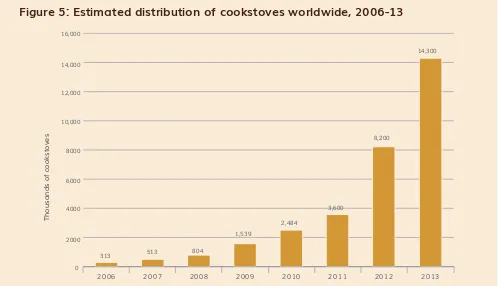
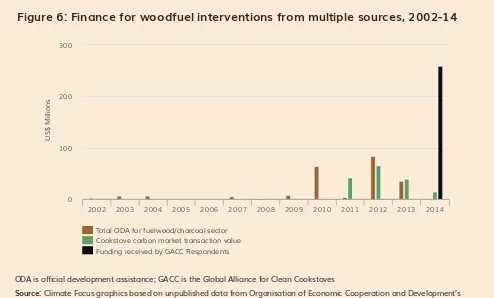
• The global distribution of clean cookstoves is accelerating rapidly, almost doubling every year from 2008 to 2013. Global investments in clean cookstove distribution have also increased in recent years, peaking at US$260 million in 2014.
Goal 4 promotes the reduction of forest loss by supporting economically sustainable alternatives to slash-and-burn farming and unsustainable harvesting of fuel wood from natural forests. Across trop-ical and subtroptrop-ical countries in Africa, Asia, and America, small scale and subsistence agriculture are estimated to be responsible for about 33% of deforestation, 21 with woodfuel and charcoal responsible for 27-34% of forest degradation.22 Small-scale agriculture remains a signiicant driver of deforestation in Africa.23 Approximately 275 million people live in woodfuel depleted “hotspots,” where harvesting to meet unsustainable demand is likely to cause deforestation.
There is no simple correlation between smallholder activities and forest loss; therefore, the relationship between poverty and forest loss is not linear (see supplementary materials). Poverty and low-yielding production practices can drive forest loss by increasing the land footprint required for subsistence, but not always, and traditional rotational cultivation is not necessarily bad for forests. Conversely, in-creasing wealth and returns on agricultural investment can drive forest loss by inin-creasing the inancial incentive and technological capacity to deforest. The focus of Goal 4 is not just avoiding forest loss associated with poverty, but also avoiding forest loss driven by unsustainable development pathways out of poverty.
No global datasets quantify government, corporate, or civil society support for alternatives to defor -estation driven by basic needs; hence our ability to monitor progress toward achievement of this goal is currently inadequate. The only relevant metric identiied is the growth in distribution of clean cook -stoves that reduce woodfuel consumption. To monitor support for reducing the role of woodfuel har-vesting as a driver of forest loss, we ofer two proxy indicators:
INDICATOR 1
Global distribution of clean cookstoves
INDICATOR 2
Financial support for woodfuel interventions
Figure 5: Estimated distribution of cookstoves worldwide, 2006-13
Source: Climate Focus graphics based on data provided by Partnership for Clean Indoor Air (PCIA), and Global Alliance for Clean
Cookstoves (2013). pollution.
Woodfuel is any type of bioenergy derived directly or indirectly from trees and shrubs grown on forest or nonforest land,24 including irewood and charcoal. In many of the least developed countries, over 90% of households rely on woodfuel for cooking.25 In some countries, estimated GHG emissions from woodfuel consumption are equivalent to, or even greater than, reported emissions from deforestation.26
INDICATOR 1
Figure 5 indicates a signiicant acceleration in the distribution of clean cookstoves globally. Analysis indicates that a large number of these cookstoves are distributed in countries where the link between woodfuel consumption and forest loss is well established (see supplementary materials). Our detailed analysis identiies countries where subsistence and smallholder activities correlate with high rates of forest loss, and includes case studies on speciic interventions to reduce poverty among smallholder farmers while successfully protecting the forest.
INDICATOR 2
Finance for woodfuel interventions comes from oicial development assistance (ODA), carbon markets, other private investments, and other sources. While measuring total inance lows is not straightfor -ward, several data sources indicate escalating sums. ODA directed to the woodfuel sector has in-creased from an annual average of US$3.6 million between 2006 and 2009, to US$47 million between
2006 2007 2008 2009 2010 2011 2012 2013
0 2000 4000 6000 8000 12,000 14,000 16,000
10,000
Thousands o
f cookst
ov
es
313 513 804
2,484
3,600
8,200
14,300
Figure 6: Finance for woodfuel interventions from multiple sources, 2002-14
ODA is oicial development assistance; GACC is the Global Alliance for Clean Cookstoves
Source: Climate Focus graphics based on unpublished data from Organisation of Economic Cooperation and Development’s Development Assistance Committee, the Global Alliance for Clean Cookstoves, and Ecosystem Marketplace.
2010 and 2013. Ecosystem Marketplace data indicate a ramping up of the value of carbon market transactions for cookstove projects between 2011 and 2012, with a decline from 2013 to 2014.27 Cook-stove project developers, however, have reported far higher investments. According to a Global Alliance for Clean Cookstoves market survey, cookstove project developers received US$ 273 million in 2014 (Global Alliance for Clean Cookstoves (GACC), Figure 6). This igure, which includes ODA and carbon market lows, is signiicantly higher than igures for previous years.
Data Gaps and Limitations
OECD countries do not currently distinguish ODA lows to subsistence or smallholder agriculture from lows to the agricultural sector in general. Changing this would make it possible to track climate-rele -vant international public inance in this area.
2002 2003 2004 2005 2006 2007 2008 2009 2010 2011 2012 2013 2014
0 100 200 300
Total ODA for fuelwood/charcoal sector Cookstove carbon market transaction value Funding received by GACC Respondents
Goal 5
Restore 150 million hectares of degraded landscapes and forestlands
by 2020 and signiicantly increase the rate of global restoration
thereafter, which would restore at least an additional 200 million
hectares by 2030
KEY MESSAGES
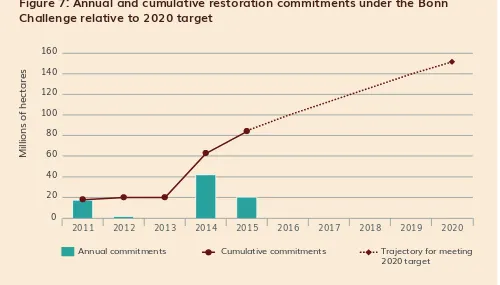
• Since 2011, countries, regions and organizations have committed to restore 62.6 million hectares of forest landscapes under the Bonn Challenge—approximately 42% of the 2020 restoration target. To meet the 2020 target, restoration pledges will need to be made at a greater rate to cover the remaining 90 million hectares.
• Parties to the United Nations Framework Convention on Climate Change have committed to restore, reforest, and/or aforest about 122 million hectares as part of their land-sector intended nationally determined contributions—approximately 35% of the 350-million-hectare 2030
restoration target.
Goal 5 adopts the 2011 Bonn Challenge target of restoring 150 million hectares of forest by 2020,28 and extends it to restore an additional 200 million hectares by 2030. A methodology for tracking prog -ress toward these goals by the International Union for the Conservation of Nature (IUCN) is expected to be released shortly making it possible to monitor implementation of Goal 5. In the meantime, we use restoration pledges made under the Bonn Challenge and the United Nations Framework Convention on Climate Change (UNFCCC) as imperfect proxies to signal progress. It is important to note that the UNFCCC pledges do not specify the type of land (degraded or other landscapes) being restored nor are the pledges all bound by the same timeframe.
INDICATOR 1
Forest restoration pledges under the
Bonn Challenge, in hectares
INDICATOR 2
Aforestation, restoration, and refor -estation pledges as part of the Intended
Nationally Determined Contributions (INDCs) of Parties to the UNFCCC, in
hectares
INDICATOR 1
INDICATOR 2
Since early 2015, 68 parties to the UNFCCC have submitted INDCs containing land- sector targets. The total, forest restoration, reforestation, and aforestation pledges are estimated at 121.7 million hectares—equal to 35% of the 350-million-hectare 2030 restoration target. The speciicity of foresta -tion and restora-tion pledges vary signiicantly, with some having explicit hectare targets, regions, and timelines, and others providing a percentage-of-forest-cover goal for the country or targets conditional on support. Our rough estimate provides a glimpse of the potential restoration eforts underway, and shows a path for reaching the 2030 target.
Figure 7: Annual and cumulative restoration commitments under the Bonn
Challenge relative to 2020 target
Source: Climate Focus analysis based on Bonn Challenge numbers from www.bonnchallenge.org.
ducting country land assessments to help identify where restoration activities should take place.30 The size of the Bonn Challenge commitments and the year they were made are shown in Figure 7. Since 2011, 14 countries, three subnational regions, and two organizations have committed to restore 62.6 million hectares of forest landscapes under the Bonn Challenge—equal to 41.7% of the 150-mil -lion-hectare 2020 restoration target. With projected announcements during the 2015 UNFCCC climate conference in Paris, it is expected that the total will increase to 83.8 million hectares of forest land -scapes – equal to 55.8% of the target. While the number and size of commitments have increased over time, they have been clustered around major, multi-stakeholder agreements, primarily at the start of the Bonn Challenge in 2011 and the NYDF in 2014. Further commitments to the Bonn Challenge/NYDF process will need to be made at a faster rate to meet the restoration target by 2020.
2011 2012 2013 2014 2015 2016 2017 2018 2019 2020
0
Millions
of hecta
res
Annual commitments Cumulative commitments Trajectory for meeting
2020 target
Data Gaps and Limitations
Goal 6
Include ambitious, quantitative forest conservation and restoration
targets for 2030 in the post-2015 global development framework, as
part of new international sustainable development goals
KEY MESSAGES
• An ambitious and quantitative target for forest conservation has been adopted as part of the Sustainable Development Goals, namely to halt deforestation by 2020.
• However, no ambitious and quantitative target for forest restoration has been adopted.
The Sustainable Development Goals (SDGs), adopted on September 25, 2015, replace and amend the Millennium Development Goals, which expire in 2015. Indicators to monitor implementation of the SDGs are under development by a United Nations inter-agency expert group. Meanwhile, we can as -sess the extent to which NYDF Goal 6 is relected in the SDGs based on two indicators:
INDICATOR 1
Inclusion in the SDGs of an ambitious,
quantitative 2030 target for forest
conservation
INDICATOR 2
Inclusion in the SDGs of an ambitious,
quantitative 2030 target for forest
restoration
Sustainable Development Goal 15 aims to:
Protect, restore, and promote sustainable use of terrestrial ecosystems, sustainably manage forests,
combat desertiication, and halt and reverse land degradation and halt biodiversity loss.
Two of the nine targets adopted under SDG 15 are relevant to the NYDF:
Target 15.1:
By 2020, ensure the conservation, restoration, and sustainable use of terrestrial and inland fresh
-water ecosystems and their services, in particular forests, wetlands, mountains, and drylands, in line
with obligations under international agreements.
Target 15.2:
By 2020, promote the implementation of sustainable management of all types of forests, halt
deforestation, restore degraded forests, and substantially increase aforestation and reforestation
globally.
INDICATOR 1
INDICATOR 2
Goal 7
Agree in 2015 to reduce emissions from deforestation and forest
degradation as part of a post-2020 global climate agreement, in
accordance with internationally agreed rules and consistent with the
goal of not exceeding 2°C warming
KEY MESSAGES
• Although the contents of the post-2020 agreement to be reached in December 2015 are not known, it is unlikely that the main agreement will include more than a high-level reference to forests.
• Of the 122 countries that have submitted public outlines of their post-2020 mitigation
contributions (INDCs), 40 have included speciic actions on land use and forests, while 18 have excluded land use and forests.
Goal 7 aims for the inclusion of forest-related mitigation measures in a post-2020 global climate agree -ment, the draft text of which is subject to intense negotiations but expected to be completed in Paris in December 2015. This agreement is expected to be general in nature, build on existing decisions of the UNFCCC, and be accompanied by bottom-up commitments of countries to domestic mitigation eforts (communicated through their INDCs).
We propose two indicators to assess whether and to what extent the Paris Agreement provides a framework that promotes reduction of emissions from deforestation and forest degradation (REDD+).
INDICATOR 1
References to land use (including REDD+)
in the Paris Agreement text
INDICATOR 2
References to land use (including REDD+)
in submitted INDCs
INDICATOR 1
Throughout 2015, various versions of the UNFCCC negotiating text have included proposals for the inclusion of the land-use sector, including in the preamble and in the context of accounting rules and market mechanisms. The structure and substance of the agreement are being intensely debated, and major changes can be expected in Paris. While the inal text may contain high-level references to land use or the forest sector, Parties may settle the main implementation questions (e.g., principles of ac-counting for land-use emissions) in later decisions.
INDICATOR 2
Goal 8
Provide support for the development and implementation of strategies
to reduce forest emissions
KEY MESSAGES
• In the 12 years from 2002 to 2013, though varying signiicantly from year to year, bilateral ODA for reducing forest emissions in developing countries increased from an annual average of US$365 million during 2002-07 to US$744 million in 2008-13.
• There is not suicient data to track public inance lows between developing countries, or
domestic spending in developed and developing countries to reduce forest-related emissions, but indications are that it is increasing. Neither is there suicient data to track private investment in strategies to reduce forest emissions but indications are that it is also increasing.
We interpret NYDF Goal 8 to refer to the provision of inancial and other support for eforts to reduce forest emissions through policies, laws, and government programs, or through private sector initiatives, eforts of local communities, indigenous peoples, or local projects. This broad interpretation of the goal relects the diversity of signatories to the NYDF and the range of their capacities to deliver on this goal.
NYDF Goal 8 overlaps somewhat with several other NYDF goals. To avoid double counting we exclude here inancial support for payments for veriied emissions reductions (VER), which is covered by Goal 9. Three proxy indicators can monitor Goal 8, recognizing some overlap with other goals:
South-South cooperation in support of forest protection, contributions by indigenous peoples, and con-tributions by nongovernmental organizations (NGOs), are presented in more detail in the supplementa -ry material.
INDICATOR 1
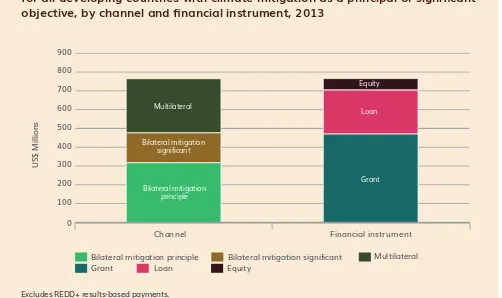
In 2013, the OECD’s Development Assistance Committee (OECD DAC) presented the irst integrated pic -ture of bilateral and multilateral commitments of climate relevant ODA,32 showing a total commitment of US$763.5 million to the forest sector (excluding results-based payments for REDD+). The majority of these funds (62%) came from bilateral sources, and the majority (also 62%) was reported as grants (Figure 8).
INDICATOR 1
Amount of climate-relevant
oicial development
assistance for forests committed by OECD donor countries and disbursed either bilaterally or through multilateral institutions
INDICATOR 2
Domestic public spending
in NYDF signatory countries
on policies and measures that include an intent to reduce forest emissions
INDICATOR 3
Private support for
Figure 8: Total bilateral and multilateral ODA committed to the forestry sector
for all developing countries with climate mitigation as a principal or signiicant
objective, by channel and inancial instrument, 2013
Excludes REDD+ results-based payments.
Source: Climate Focus calculations based on Organisation of Economic Cooperation and Development’s Development Assistance Committee dataset: Climate-related development inance in 2013.
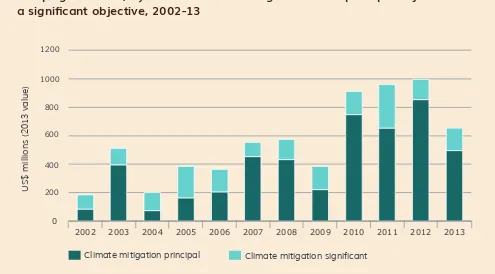
In the 12 years from 2002 to 2013, though varying signiicantly from year to year, bilateral ODA for reducing forest emissions in developing countries increased from an annual average of US$365 million during 2002-07 to US$744 million in 2008-13 (Figure 9). Indications are that 2014 commitments were over US$1 billion, the strongest to date, though this has yet to be reported by OECD DAC.
INDICATOR 2
No global data set reports relevant domestic public spending and data are patchy for developed and developing countries. Nonetheless, there is evidence of increased spending on forest management, for example, in the United States and Europe. In some developing countries, domestic public spending on forest conservation is equal to or greater than that received from international sources (see supple-mentary materials for details).
Channel Financial instrument 0
Bilateral mitigation principle Multilateral
Grant Loan Equity
Bilateral mitigation significant
US$ Millions
Multilateral
Bilateral mitigation significant
Bilateral mitigation principle
Grant Loan Equity
Figure 9: Total bilateral ODA to reduce forest emissions committed to all
de-veloping countries, by whether climate mitigation was a principal objective or
a signiicant objective, 2002-13
Source: Climate Focus calculations based on Organisation of Economic Cooperation and Development’s
Development Assistance Committee dataset: Aid activities targeting global environmental objectives.
INDICATOR 3
Impact investments in forest conservation and the production of sustainable forest-related commod-ities, while still small, are also growing. Large investors, including major international banks and sov -ereign wealth funds, are developing sustainable investment policies that may reduce emissions from deforestation. These policies are still aspirational and their impact is diicult to assess. NGOs and indigenous peoples also make signiicant contributions toward strategies to reduce deforestation. It is diicult to distinguish whether NGOs are spending their own funds or passing through government funds, though this has been attempted in places. For example, it is estimated that between 2007 and 2013, four international NGOs contributed an estimated US$100 million toward reducing deforestation in the Amazon Basin (see supplementary materials for details).33
Data Gaps and Limitations
Reliable data is available only for climate ODA commitments by OECD countries. It would increase transparency if OECD members would ile complete disbursement data in DAC statistics, and if non-OECD countries would report on international inancial assistance. There is no globally harmonized database that shows domestic public spending on forests to allow for an accurate assessment of own-country contributions to reducing forest loss. Nor is there adequate information on the scale or impact of private-sector and other investments for forests.
2002 2003 2004 2005 2006 2007 2008 2009 2010 2011 2012 2013
0
Climate mitigation principal
US$ millions (2013 v
alue)
Climate mitigation significant 200
Goal 9
Reward countries and jurisdictions that, by taking action, reduce forest
emissions—particularly through public policies to scale-up payments
for veriied emission reductions and private-sector sourcing of com
-modities
KEY MESSAGES
• Between 2008 and 2014, over US$3 billion was committed, almost exclusively from international public sources, for performance-based REDD+ payments. Disbursements, at just over
US$1 billion, have lagged behind commitments.
• The forest carbon market expanded rapidly to US$237 million in 2011, but growth has subsequently leveled of.
Goal 9 encourages signatories to establish inancial incentives that reward tropical forest countries and jurisdictions through payments, especially for veriied emission reductions (VERs) from forests. Over the past decade, a range of approaches to making private and public payments for ecosystem services have been developed; this is one such efort in which it is assumed that forest emission reductions, measured against a baseline or reference level, will ultimately qualify for payment. A small but growing body of experience with payments for VERs is being developed as part of REDD+ result-based payment schemes, including Norway’s bilateral partnerships with Brazil, Indonesia, and Guyana, as well as the German REDD+ Early Movers Program. There is also private sector interest in rewarding VERs through carbon markets.
We propose two indicators to track progress on Goal 9:
INDICATOR 1
International payments for VERs disbursed through multilateral and bilateral funds and public programs
INDICATOR 2
The value of purchases of forest VERs through voluntary and compliance markets
INDICATOR 1
Between 2008 and 2014, a number of bilateral and multilateral results-based programs for reducing forest emissions were established, with over US$3 billion committed (Figure 10). These programs have been funded largely through Norway’s International Climate and Forests Initiative, although Germany, the United Kingdom, and other donor countries have also made signiicant contributions. Norway’s contribution to Brazil’s Amazon Fund is a preeminent example of performance-based payments for avoided deforestation.
Figure 10: Commitments to and disbursements from international
payment-for-performance funds, 2014
NICFI is Norway’s International Climate Initiative, FCPF is the Forest Carbon Partnership Facility, KfW REM is the REDD Early Mover’s Program of Germany’s Kreditanstalt für Wiederaufbau.
Source: Graph by Climate Focus based on following data sources:
NICFI commitments taken from Memorandi of Understanding with Brazil, Indonesia, Guyana, Peru and Liberia. Commitments to FCPF Carbon Fund, BioCarbon Fund and REM programs were retrieved from respective fund websites. NICFI disbursements available from Amazon Fund website and Real-Time Evaluation of Norway’s International Climate and Forest Initiative. No disbursements recorded from FCPF Carbon Fund and BioCarbon Fund to date. REM disbursement data have been received
from Forest Trends.
behind donors’ inancial commitments. This is because forest countries have been engaging in a “read -iness” process—building national strategies, developing monitoring systems, and so on—and are only recently starting to implement programs expected to reduce emissions from deforestation and forest degradation. Internal procedures and administrative requirements of donors and multilateral funds have also delayed disbursements.
INDICATOR 2
Between 2005 and 2008, the value of the forest carbon market expanded steadily from US$8 million to US$32 million (Figure 11). The market then climbed rapidly over three years to US$ 237 million in 2011, representing an average annual growth of 90%. This was driven primarily by an increase in the size of the voluntary carbon market, which in 2011 represented 73% of the forest carbon market. However, in 2013 the value of the forest carbon market fell back to approximately US$150 million.34
Commitments Disbursements
0
Kfw REM (TBC)
NICFI - Peru NICFI - Indonesia NICFI - Amazon Fund NICFI - Guyana
Bio Carbon Fund
US$ millions
FCPF Carbon Fund NICFI - Liberia
Figure 11: Value of the forest carbon market, 2005-13
Excludes payments of the REDD Early Mover’s Program (REM), which are recorded under Indicator 1.
Source: Climate Focus calculations based on data provided by Forest Trends State of the Forest Carbon Market, 2014.
Greater market demand for forest VERs will require the integration of forest carbon credits into emis-sions trading systems, which will encourage regulated entities to purchase credits as ofsets. However, market-based systems such as the Clean Development Mechanism and the European Emission Trading System have restricted the generation and use of forest carbon credits due to concerns over the per-manence of emission reductions represented by forestry activities, and the potential for an oversupply of REDD+ credits to remove incentives for other ofset projects. Though California’s Cap-and-Trade Program does not currently allow for the use of international forest ofsets, this may change. Similarly the International Civil Aviation Association may provide opportunities for airlines to use forest VERs to ofset airline emissions.
Data Gaps and Limitations
Most payment-for-performance programs focusing on forests and REDD+ have publicly accessible and up-to-date information on commitments and disbursements. However, this is not the case across all funds. Regular updates on commitment and disbursement levels by all payment-for-performance pro-grams would help assess progress achieved under this goal.
USD, millions
2005 2006 2007 2008 2009 2010 2011 2012 2013
0 50 100 150 200 250
Goal 10
Strengthen forest governance, transparency, and the rule of law, while
also empowering communities and recognizing the rights of
indige-nous peoples, especially those pertaining to their lands and resources
KEY MESSAGES
• Forest governance has improved modestly in recent years, coinciding with a signiicant expansion of bilateral and multilateral programs providing inancial support to that end.
• Illegality remains high in the wood-based products market.
• Forest communities continue to live under