Ž .
Journal of Health Economics 19 2000 93–119
www.elsevier.nlrlocatereconbase
Recent trends in employer-sponsored health
insurance coverage: are bad jobs getting worse?
Henry S. Farber
a, Helen Levy
b,) aPrinceton UniÕersity, USA b
140 Warren Hall, RWJF Program, UniÕersity of California at Berkeley, Berkeley, CA 94720-7360,
USA
Abstract
We examine whether the decline in the availability of employer-provided health insurance is a phenomenon common to all jobs or is concentrated only on certain jobs. We find that declines in own-employer insurance coverage over the 1988–1997 period are driven primarily by declines in takeup for long-term full-time workers and declines in eligibility for new and part-time workers. We also look at trends by workers’ education level, and see how much of the decline in is offset by an increase in coverage through a spouse’s policy.q2000 Elsevier Science B.V. All rights reserved.
JEL classification: J32; I10
Keywords: Employer-sponsored health insurance; Nonwage compensation
1. Introduction
In the midst of one of the longest economic expansions in US history, an increasing number of Americans — 43.4 million in 1997 — lack health insurance
Ž .
coverage Bennefield, 1998 . Rates of coverage by employer-sponsored insurance are dropping at the same time that the gap in wages between high and low-wage workers is widening. Motivated both by concern about declining availability of employer-sponsored health insurance and by more general concern about declining
) Corresponding author. Tel.: q1-510-643-0790; fax: q1-510-643-8614; e-mail:
0167-6296r00r$ - see front matterq2000 Elsevier Science B.V. All rights reserved.
Ž .
( ) H.S. Farber, H. LeÕyrJournal of Health Economics 19 2000 93–119 94
job quality in the United States, we are interested in understanding what is driving the decline in coverage and which workers have been affected. The central goal of this study is therefore to investigate the decline in the availability of employer-pro-vided health insurance in the context of an examination of the quality of jobs.1 In order to shed some light on these issues, we examine whether the decline in the availability of employer-provided health insurance is a phenomenon common to all jobs or is concentrated only on certain jobs. In particular, we investigate the extent to which employers have continued to provide health insurance on what we term ‘‘core’’ jobs while reducing the availability of health insurance on ‘‘periph-eral’’ jobs. We operationalize the concept of core and peripheral jobs using information about job tenure and usual weekly hours of work, classifying jobs as
Ž
either old or new defined for our purposes as jobs that have started within the
. Ž
previous 12 months and part-time or full-time based on whether usual hours of . 2
work are greater than 35 per week . Old full-time jobs are what we consider ‘‘core’’ jobs; all others are ‘‘peripheral’’ according to our definition. Using data
Ž .
from the Current Population Survey CPS for 1988 through 1997, we examine three intermediate measures of access to health insurance for these different
Ž .
groups of workers: 1 the fraction of workers who are in firms that offer health
Ž . Ž .
insurance to at least some workers the offer rate ; 2 the fraction of workers who are eligible for health insurance, conditional on being in a firm where it is offered Žthe eligibility rate ; and 3 the fraction of workers who enroll in health insurance. Ž .
Ž .
when they are eligible for it the takeup rate .
This analysis reveals that, for both core and peripheral workers, health insur-ance offering by employers actually increased over this period and therefore explains none of the decline in coverage. The coverage decline is instead attributable to declines in eligibility and takeup. Moreover, the factors driving the declines in coverage for core workers are quite different from those affecting peripheral workers. Among core workers, a decline in takeup accounts for nearly all of the decline in coverage, while for part-time workers on old or new jobs all of the decline in coverage is due to a decline in eligibility. The difference between core and peripheral workers persists when we incorporate coverage as a dependent on a spouse’s policy into the analysis; we find that an increase in the rate of spousal coverage offsets approximately one-third of the decline in own-job
1
Important contributors to the literature on changes in job quality include Bluestone and Harrison
Ž1986; 1988 , Kosters and Ross 1988 , Costrell 1990 , and Houseman 1995 . See Cutler and Gruber. Ž . Ž . Ž . Ž1996 , Fronstin and Snider 1996r97 , Shore-Sheppard 1996 Krueger and Levy 1997 , Cooper and. Ž . Ž . Ž .
Ž . Ž .
Schone 1997 , and Levy 1998 for evidence of a gradual decline in rates of coverage by employer-sponsored health insurance throughout the 1980s and 1990s.
2 Ž .
The rationale for this definition of new jobs is discussed in detail in Farber 1997 . While there is not a perfect correspondence between jobs with low tenure and jobs that are destined to be short-term
Žafter all, long-term jobs have to start somewhere it is clear that workers in short-term jobs, and.
( )
H.S. Farber, H. LeÕyrJournal of Health Economics 19 2000 93–119 95
coverage but that this offset occurred primarily for workers in core jobs. Finally, Ž
an analysis for workers in four different educational categories less than high . school, high school graduate, some college, and four years of college or more reveals that among peripheral jobs, declines in coverage and eligibility occurred across the board, while on core jobs the least-educated workers experienced the largest decline in coverage. Thus, while education served as a buffer against coverage declines for core workers, for peripheral workers it did not. Our analysis of trends in employer-sponsored health insurance coverage leads us to conclude that the quality of core and peripheral jobs in this dimension is diverging.
2. Trends in health insurance coverage
We begin by using data from the Current Population Survey to look at health Ž
insurance coverage rates. The four benefit supplements to the CPS May 1979, .
May 1983, May 1988, and April 1993 and the two Contingent and Alternative
Ž .
Employment Arrangement Supplements February 1995 and February 1997 con-tain information on employer-provided health insurance. In this section, we establish that coverage by employer-provided health insurance has been declining,
Ž 1 .
which is consistent with the results of other studies see above . Additionally, we establish that workers on peripheral jobs are less likely to be covered by health insurance provided by their employer and that this gap has grown over time. Due to data limitations, we do not consider the financing of employer-provided health insurance in terms of whether or not the worker contributes to the premium, although there is some evidence that another change has been an increase in
Ž
employee contributions to employer-provided health insurance Levy, 1998; Blostin . 3
and Pfuntner, 1998 .
2.1. Trends in the oÕerall coÕerage rate by sector
We first examine trends in coverage by employer-provided health insurance separately for private and public sector workers. Table 1 contains a breakdown by year in coverage by employer-provided health insurance between May 1979 and February 1997. The results are clear. Public sector workers are substantially more
Ž
likely to be covered by health insurance provided by their employer average over the 1979–1997 period of 80.9% in the public sector and 67.8% in the private
.
sector . Additionally, the public-private differential in health insurance coverage has been increasing. The differential was 7.6 percentage points in May 1979 and
3
( ) H.S. Farber, H. LeÕyrJournal of Health Economics 19 2000 93–119 96
Table 1
Ž .
Fraction covered by health insurance provided by their employer by year and sector privaterpublic workers ages 20–64
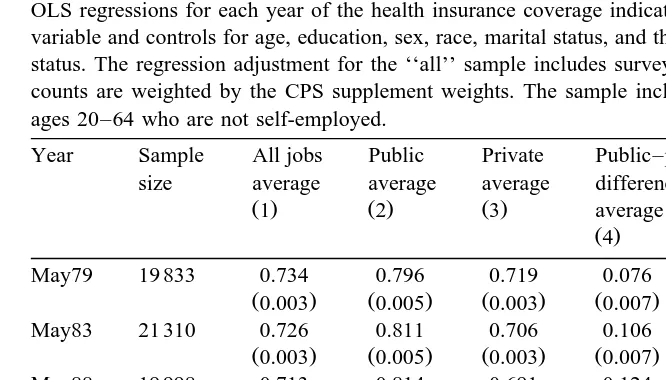
The numbers in parentheses are standard errors. The numbers in columns 1–3 are the fraction of workers in each group reporting that they are covered by their own employer-provided health insurance based on weighted tabulations of data from the relevant supplements to the CPS. The average difference in column 4 is computed as the difference between the health insurance coverage rate in the
Ž . Ž .
public sector column 2 and the coverage rate in the private sector column 3 . The adjusted differences reported in column 5 are the coefficients on a public sector dummy variable from separate OLS regressions for each year of the health insurance coverage indicator on the public sector dummy variable and controls for age, education, sex, race, marital status, and the interaction of sex and marital status. The regression adjustment for the ‘‘all’’ sample includes survey dummy variables as well. All counts are weighted by the CPS supplement weights. The sample includes all private sector workers ages 20–64 who are not self-employed.
Year Sample All jobs Public Private Public–private Public–private size average average average difference difference
Ž .1 Ž .2 Ž .3 average adjusted
Ž .4 Ž .5
May79 19 833 0.734 0.796 0.719 0.076 0.067
Ž0.003. Ž0.005. Ž0.003. Ž0.007. Ž0.008.
May83 21 310 0.726 0.811 0.706 0.106 0.078
Ž0.003. Ž0.005. Ž0.003. Ž0.007. Ž0.008.
May88 19 998 0.713 0.814 0.691 0.124 0.092
Ž0.003. Ž0.005. Ž0.003. Ž0.006. Ž0.008.
Apr93 19 663 0.677 0.807 0.647 0.160 0.124
Ž0.002. Ž0.005. Ž0.003. Ž0.006. Ž0.008.
Feb95 41 951 0.675 0.819 0.641 0.178 0.142
Ž0.003. Ž0.007. Ž0.004. Ž0.009. Ž0.006.
Feb97 37 040 0.674 0.808 0.645 0.163 0.128
Ž0.003. Ž0.007. Ž0.004. Ž0.009. Ž0.006.
All 159 794 0.703 0.809 0.678 0.130 0.100
Ž0.001. Ž0.002. Ž0.001. Ž0.003. Ž0.003.
increased to 16.3 percentage points by February 1997. This reflects entirely a decline in coverage in the private sector from 71.9% in May 1979 to 64.5% by February 1997. In contrast, the coverage rate in the public sector increased slightly from 79.6% in May 1979 to 80.8% in February 1997.
Column 5 of Table 1 contains regression-adjusted differences in coverage rates between private and public sector workers. These are computed using separate
Ž .
linear probability models OLS regressions for each survey year to control for Ž
observable worker demographic characteristics age, sex, race, marital status, the .
( )
H.S. Farber, H. LeÕyrJournal of Health Economics 19 2000 93–119 97
public-private differential in health insurance coverage rates is not accounted for by worker characteristics. The regression-adjusted estimates confirm that the public-private differential in health insurance coverage rates increased substan-tially between 1979 and 1997, reflecting the sharp decline in coverage rates on private sector jobs. While the public sector makes up a substantial fraction of
Ž .
employment 19.8% in May 1979 declining to 18.1% in February 1997 , it is clear that the decline in coverage by employer-provided health insurance is strictly a private-sector phenomenon. On this basis, we proceed with our analysis of coverage using only private sector workers.
2.2. The coÕerage rate by type of job for priÕate sector workers
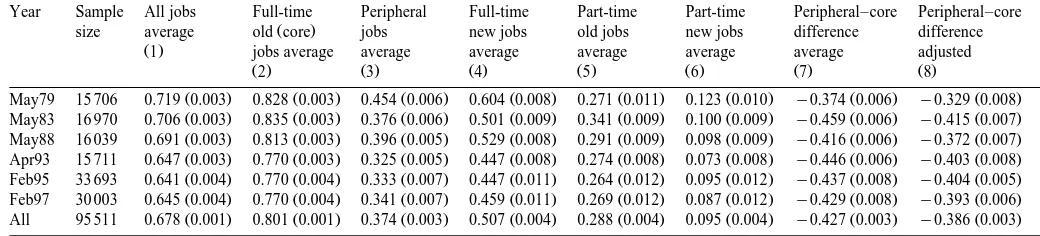
We start with an analysis of coverage by employer-provided health insurance for private-sector workers by type of job. Column 1 of Table 2 contains the mean coverage rate at each survey date for all private sector workers. Columns 2 and 3 present the average coverage rate for private sector workers in core and peripheral jobs, respectively. Columns 4, 5 and 6 present average coverage rates separately
Ž
for each of the three types of peripheral jobs full-time new, part-time old and .
part-time new ; the entry in column 3 for all peripheral jobs is therefore a weighted average of these three columns. Considering all private sector jobs, the
Ž
health insurance coverage rate fell by 7.4 percentage points from 71.9% in May
. 4 Ž
1979 to 64.5% in February 1997 . Coverage is highest on core jobs 80.1% on
. Ž .
average during the period we examine and lowest on new part-time jobs 9.5% , with new full-time and old part-time jobs in between with coverage rates of 50.7% and 28.8%, respectively. There was a 5.8 percentage point decline in the coverage
Ž .
rate on core jobs from 82.8% to 77.0% , with most of that decline occurring between 1988 and 1993. In contrast, the decline in the coverage rate on new
Ž .
full-time jobs was 14.5 percentage points from 60.4% to 45.9% , approximately zero on new part-time jobs, and 3.6 percentage points on new part-time jobs. The raw core-peripheral difference in employer-provided health insurance coverage Žcolumn 7 of Table 2 increased over the period from 37.4 percentage points in. 1979 to 44.6 percentage points by 1993; the largest change occurred during the 1979 to 1983 period. The core–peripheral difference then declined slightly to 42.9 percentage points between 1993 and 1997. Column 8 of Table 2 contains regression-adjusted differences in coverage rates between core and peripheral
4
This is a conservative estimate of the decline. The May 1979 CPS sample includes incorporated
Ž .
self-employed workers about 3% of employment in later years , who are less likely to be covered by employer-provided health insurance, so that the figures for May 1979 provide a slightly downward
Ž .
()
H.S.
Farber,
H.
Le
Õ
y
r
Journal
of
Health
Economics
19
2000
93
–
119
98
Table 2
Fraction covered by health insurance provided by their employer by year and job type private sector workers ages 20–64
The numbers in parentheses are standard errors. The numbers in columns 1–6 are the fraction of workers in each group reporting that they are covered by their own employer-provided health insurance based on weighted tabulations of data from the relevant supplements to the CPS. The average difference in column 7
Ž .
is computed as the difference between the health insurance coverage rate for workers in peripheral jobs column 3 and the coverage rate for workers in core
Ž .
jobs column 2 . The adjusted differences reported in column 8 are the coefficients on a peripheral job dummy variable from separate OLS regressions for each year of the health insurance coverage indicator on the peripheral job dummy variable and controls for age, education, sex, race, marital status, and the interaction of sex and marital status. The regression adjustment for the ‘‘all’’ sample includes survey dummy variables as well. All counts are weighted by the CPS supplement weights. The sample includes all private sector workers ages 20–64 who are not self-employed.
Year Sample All jobs Full-time Peripheral Full-time Part-time Part-time Peripheral–core Peripheral–core
Ž .
size average old core jobs new jobs old jobs new jobs difference difference
Ž .1 jobs average average average average average average adjusted
Ž .2 Ž .3 Ž .4 Ž .5 Ž .6 Ž .7 Ž .8
Ž . Ž . Ž . Ž . Ž . Ž . Ž . Ž .
May79 15 706 0.719 0.003 0.828 0.003 0.454 0.006 0.604 0.008 0.271 0.011 0.123 0.010 y0.374 0.006 y0.329 0.008
Ž . Ž . Ž . Ž . Ž . Ž . Ž . Ž .
May83 16 970 0.706 0.003 0.835 0.003 0.376 0.006 0.501 0.009 0.341 0.009 0.100 0.009 y0.459 0.006 y0.415 0.007
Ž . Ž . Ž . Ž . Ž . Ž . Ž . Ž .
May88 16 039 0.691 0.003 0.813 0.003 0.396 0.005 0.529 0.008 0.291 0.009 0.098 0.009 y0.416 0.006 y0.372 0.007
Ž . Ž . Ž . Ž . Ž . Ž . Ž . Ž .
Apr93 15 711 0.647 0.003 0.770 0.003 0.325 0.005 0.447 0.008 0.274 0.008 0.073 0.008 y0.446 0.006 y0.403 0.008
Ž . Ž . Ž . Ž . Ž . Ž . Ž . Ž .
Feb95 33 693 0.641 0.004 0.770 0.004 0.333 0.007 0.447 0.011 0.264 0.012 0.095 0.012 y0.437 0.008 y0.404 0.005
Ž . Ž . Ž . Ž . Ž . Ž . Ž . Ž .
Feb97 30 003 0.645 0.004 0.770 0.004 0.341 0.007 0.459 0.011 0.269 0.012 0.087 0.012 y0.429 0.008 y0.393 0.006
Ž . Ž . Ž . Ž . Ž . Ž . Ž . Ž .
( )
H.S. Farber, H. LeÕyrJournal of Health Economics 19 2000 93–119 99
workers, calculated similarly to those presented in Table 1 for public and private sector workers, where the entry in this table is the coefficient on the ‘‘peripheral job’’ dummy variable. As in Table 1, the addition of control variables does not substantially alter the result: the regression-adjusted estimates confirm that the core–peripheral differential in health insurance coverage rates in the private sector increased considerably between 1979 and 1997.
2.3. The preÕalence of peripheral jobs
The effect of the widening core–peripheral differential in coverage on the overall decline in health insurance will be exacerbated by any increase in the fraction of workers in peripheral jobs. Therefore, before proceeding to analyze the
Ž .
separate components of coverage offering, eligibility, takeup , we want to deter-mine whether the fraction of jobs that are new or part-time has changed over the 1979–1997 period. We use data from four mobility supplements to the CPS ŽJanuary 1983, 1987, and 1991, and February 1996 in addition to the six benefits. supplements already mentioned to calculate these fractions.5
The fraction of workers in new jobs averages 20.9% over the period covered. This fraction moves cyclically in the sense that new-job rates tend to be higher in tight labor markets such as in 1979, 1987–1988, and 1996–1997; the average new job rate over these periods was 21.5%. This cyclicality of the new-job rate is not surprising given the fact that new hiring in an expansion implies that there will be an increase in employment at low-tenure levels. Additionally, to the extent that layoffs are concentrated among low-tenure workers, there will be a decrease in
Ž
employment at low tenure levels in slack labor markets Abraham and Medoff, .
1984; Farber, 1993 , as in 1983 and 1991, when the average new job rate was 20.5%. While it is difficult to separate secular changes from cyclical movements in a relatively short time series, there is no evidence of a systematic increase in the incidence of new jobs over the 1979–1997 period.
The part-time rate averages 14.5% over this period. Our analysis also shows that the part-time rate is substantially lower in 1979 than in later years. Addition-ally, there seems to be a weak cyclical pattern to the part-time employment rate with relatively low rates of part-time employment in periods with a tight labor
Ž .
market 1979, 1988, 1996; average part-time rate 12.7% and relatively high rates Ž
part-time rates in periods with a slack labor market 1983, 1991–1993; average .
part-time rate 15.2% . But temporal fluctuations are small and are generally not statistically significant; the one clear exception is the significant increase in the
Ž .
part-time rate between May 1979 11.7%, the lowest in the sample and January
Ž .
1983 16.4%, the highest in the sample .
5
Complete results of the analysis and further discussion of the data are provided in Farber and Levy
( ) H.S. Farber, H. LeÕyrJournal of Health Economics 19 2000 93–119 100
The distribution of private-sector employment across type of job associated with the these probabilities, on average during this period, is the following: 70.0% core workers, 15.6% full-time new, 9.6% part-time old, and 4.9% part-time new. Our analysis shows that peripheral workers are a substantial fraction of the workforce-about 30% of all workers-and this fraction has not changed over the period we examine. Thus, an increased incidence of peripheral employment cannot account for any of the decline in coverage by employer-provided health insurance. We therefore proceed to our analysis of exactly which elements of coverage are causing the decline in the private sector. Coverage by employer-provided health
Ž .
insurance is the result of a sequence of steps: 1 The employer must offer health Ž .
insurance as a fringe benefit to at least some employees, 2 the employee must be Ž .
eligible for coverage, and 3 the employee must elect to be covered. We analyze each of these steps in turn. Unfortunately, information on coverage is the only information on health insurance available in the May 1979 and May 1983 benefit supplements so that our analysis is restricted to the 1988–1997 period.
3. The components of health insurance coverage: offering, eligibility, and takeup
3.1. Health insurance offering
Ž
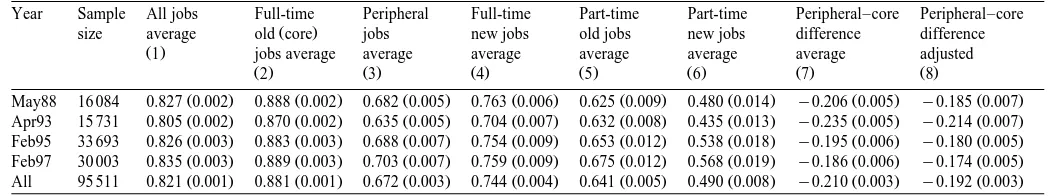
The first six columns of Table 3 contain mean offering rates the fraction of . workers whose employers offer health insurance to at least some employees at
Ž .
each survey date from May 1988 through February 1997 overall and by type of job as in Table 2. As with coverage, the offering rate is substantially lower on
Ž
peripheral jobs than on core jobs 67.2% overall on peripheral jobs vs. 88.1% .
overall on core jobs . The overall offering rate actually increased over this period Ž
by about a percentage point from 82.7% in May 1988 to 83.5% in February
. 6 Ž .
1997 . This contrasts with a decline in coverage rates Table 2 of 4.6 percentage points over the same period. Core workers experienced no change in offering rates over this period. Part-time workers experienced the largest percentage point increases in health insurance offering: offer rates increased from 62.5% to 67.5% for part-time workers on old jobs, and from 48.0% to 56.8% for part-time workers on new jobs. Overall, there appears to have been a small decline in the raw core-peripheral differential in offer rates, which decreases from 20.6 percentage
Ž .
points in 1988 to 18.6 percentage points in 1997 column 7 . The
regression-ad-6 Ž .
Cooper and Schone 1997 also report an increase in the offer rate between 1987 and 1996, using
Ž .
data from the National Medical Expenditure Survey 1987 and the Medical Expenditure Panel Survey
Ž1996 . Our definition of offering differs from theirs somewhat the product of what we call offering. Ž .
()
H.S.
Farber,
H.
Le
Õ
y
r
Journal
of
Health
Economics
19
2000
93
–
119
101
Table 3
Fraction whose employers offer health insurance coverage to at least some employees by year and job type private sector workers ages 20–64
The numbers in parentheses are standard errors. The numbers in columns 1–6 are the fraction of workers in each group who are in a firm that offers health insurance to at least some workers in the firm based on weighted tabulations of data from the relevant supplements to the CPS. The average difference in
Ž .
column 7 is computed as the difference between the health insurance offer rate for workers in peripheral jobs column 3 and the offer rate for workers in core
Ž .
jobs column 2 . The adjusted differences reported in column 8 are the coefficients on a peripheral job dummy variable from separate OLS regressions for each year of the health insurance offering indicator on the peripheral job dummy variable and controls for age, education, sex, race, marital status, and the interaction of sex and marital status. The regression adjustment for the ‘‘all’’ sample includes survey dummy variables as well. All counts are weighted by the CPS supplement weights. The sample includes all private sector workers ages 20–64 who are not self-employed.
Year Sample All jobs Full-time Peripheral Full-time Part-time Part-time Peripheral–core Peripheral–core
Ž .
size average old core jobs new jobs old jobs new jobs difference difference
Ž .1 jobs average average average average average average adjusted
Ž .2 Ž .3 Ž .4 Ž .5 Ž .6 Ž .7 Ž .8
Ž . Ž . Ž . Ž . Ž . Ž . Ž . Ž .
May88 16 084 0.827 0.002 0.888 0.002 0.682 0.005 0.763 0.006 0.625 0.009 0.480 0.014 y0.206 0.005 y0.185 0.007
Ž . Ž . Ž . Ž . Ž . Ž . Ž . Ž .
Apr93 15 731 0.805 0.002 0.870 0.002 0.635 0.005 0.704 0.007 0.632 0.008 0.435 0.013 y0.235 0.005 y0.214 0.007
Ž . Ž . Ž . Ž . Ž . Ž . Ž . Ž .
Feb95 33 693 0.826 0.003 0.883 0.003 0.688 0.007 0.754 0.009 0.653 0.012 0.538 0.018 y0.195 0.006 y0.180 0.005
Ž . Ž . Ž . Ž . Ž . Ž . Ž . Ž .
Feb97 30 003 0.835 0.003 0.889 0.003 0.703 0.007 0.759 0.009 0.675 0.012 0.568 0.019 y0.186 0.006 y0.174 0.005
Ž . Ž . Ž . Ž . Ž . Ž . Ž . Ž .
( ) H.S. Farber, H. LeÕyrJournal of Health Economics 19 2000 93–119 102
justed difference in offering rates contained in column 8 of Table 4, calculated analogously to those in Table 2, look very much like the unadjusted differences, implying that most of the core–peripheral differential in offering rates is not accounted for by worker characteristics. These estimates also verify that the core–peripheral differential in health insurance offering rates did not change substantially between 1988 and 1997.
3.2. Eligibility conditional on offering
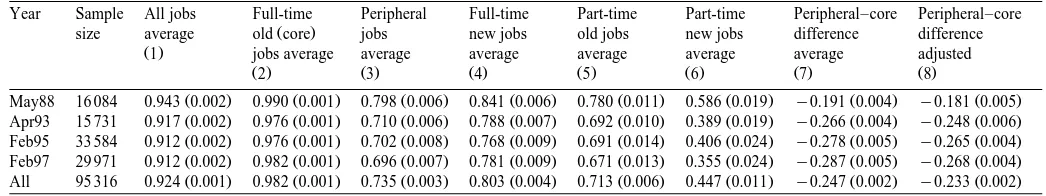
Given that coverage rates fell substantially between 1988 and 1997 while offering rates increased, it must be the case that either eligibility rates or takeup rates fell over this period. We present an examination of eligibility conditional on offering in Table 4. The first six columns of the table contain mean conditional eligibility rates at each survey date overall and by job type. As with coverage and offering, the eligibility rate is substantially lower on peripheral jobs than on core
Ž .
jobs 73.5% overall on peripheral jobs vs. 98.2% overall on core jobs . The overall Ž
eligibility rate fell by 3.1 percentage points from 94.3% in May 1988 to 91.2% in .
February 1997 . This reflects a sharp decline in eligibility for all three types of peripheral workers: eligibility declined for part-time workers on old jobs from 78.0% to 67.1%, for part-time workers on new jobs from 58.6% to 35.5%, and for full-time workers on new jobs from 84.1% to 78.1%. Core workers, by contrast, experienced almost no decline, with an eligibility rate of 99.0% in 1988 and 98.2% in 1997. These trends imply a substantial increase in the core-peripheral
Ž differential in eligibility rates. The unadjusted core-peripheral differential column
. Ž
7 rose by 9.6 percentage points from 19.1 percentage points to 28.7 percentage
. Ž .
points , while the regression adjusted differential column 8 rose by 8.7
percent-Ž .
age points from 18.1 percentage points to 26.8 percentage points . The substantial decrease in eligibility for workers on new jobs may signal an increase in employers’ use of ‘‘waiting periods’’ before an employee becomes eligible for coverage by the employer’s plan, while the increases in ineligibility for part-time workers may indicate that employers are simply excluding all part-time workers from eligibility for coverage. We return to this issue in our discussion of results.
( )
3.3. Enrollment conditional on eligibility takeup
Ž
Table 5 contains estimates of takeup rates the fraction of eligible workers who .
()
H.S.
Farber,
H.
Le
Õ
y
r
Journal
of
Health
Economics
19
2000
93
–
119
103
Table 4
Fraction eligible for health insurance coverage conditional on employer offering by year and job type private sector workers ages 20–64
The numbers in parentheses are standard errors. The numbers in columns 1–6 are the fraction of workers in each group who are eligible for health insurance, conditional on being in a firm that offers it, based on weighted tabulations of data from the relevant supplements to the CPS. The average difference in column
Ž .
7 is computed as the difference between the health insurance eligibility rate for workers in peripheral jobs column 3 and the eligibility rate for workers in
Ž .
core jobs column 2 . The adjusted differences reported in column 8 are the coefficients on a peripheral job dummy variable from separate OLS regressions for each year of the health insurance eligibility indicator on the peripheral job dummy variable and controls for age, education, sex, race, marital status, and the interaction of sex and marital status. The regression adjustment for the ‘‘all’’ sample includes survey dummy variables as well. All counts are weighted by the CPS supplement weights. The sample includes all private sector workers ages 20–64 who are not self-employed.
Year Sample All jobs Full-time Peripheral Full-time Part-time Part-time Peripheral–core Peripheral–core
Ž .
size average old core jobs new jobs old jobs new jobs difference difference
Ž .1 jobs average average average average average average adjusted
Ž .2 Ž .3 Ž .4 Ž .5 Ž .6 Ž .7 Ž .8
Ž . Ž . Ž . Ž . Ž . Ž . Ž . Ž .
May88 16 084 0.943 0.002 0.990 0.001 0.798 0.006 0.841 0.006 0.780 0.011 0.586 0.019 y0.191 0.004 y0.181 0.005
Ž . Ž . Ž . Ž . Ž . Ž . Ž . Ž .
Apr93 15 731 0.917 0.002 0.976 0.001 0.710 0.006 0.788 0.007 0.692 0.010 0.389 0.019 y0.266 0.004 y0.248 0.006
Ž . Ž . Ž . Ž . Ž . Ž . Ž . Ž .
Feb95 33 584 0.912 0.002 0.976 0.001 0.702 0.008 0.768 0.009 0.691 0.014 0.406 0.024 y0.278 0.005 y0.265 0.004
Ž . Ž . Ž . Ž . Ž . Ž . Ž . Ž .
Feb97 29 971 0.912 0.002 0.982 0.001 0.696 0.007 0.781 0.009 0.671 0.013 0.355 0.024 y0.287 0.005 y0.268 0.004
Ž . Ž . Ž . Ž . Ž . Ž . Ž . Ž .
()
H.S.
Farber,
H.
Le
Õ
y
r
Journal
of
Health
Economics
19
2000
93
–
119
104
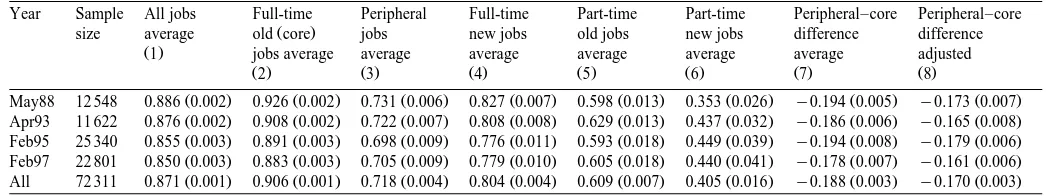
Table 5
Ž .
Fraction covered by employer-provided health insurance conditional on eligibility takeup rate by year and job type private sector workers ages 20–64 The numbers in parentheses are standard errors. The numbers in columns 1–6 are the fraction of workers in each group who are enrolled in their employer’s health insurance plan, conditional on being eligible for it, based on weighted tabulations of data from the relevant supplements to the CPS. The average
Ž .
difference in column 7 is computed as the difference between the enrollment rate for workers in peripheral jobs column 3 and the enrollment rate for workers
Ž .
in core jobs column 2 . The adjusted differences reported in column 8 are the coefficients on a peripheral job dummy variable from separate OLS regressions for each year of the health insurance enrollment indicator on the peripheral job dummy variable and controls for age, education, sex, race, marital status, and the interaction of sex and marital status. The regression adjustment for the ‘‘all’’ sample includes survey dummy variables as well. All counts are weighted by the CPS supplement weights. The sample includes all private sector workers ages 20–64 who are not self-employed.
Year Sample All jobs Full-time Peripheral Full-time Part-time Part-time Peripheral–core Peripheral–core
Ž .
size average old core jobs new jobs old jobs new jobs difference difference
Ž .1 jobs average average average average average average adjusted
Ž .2 Ž .3 Ž .4 Ž .5 Ž .6 Ž .7 Ž .8
Ž . Ž . Ž . Ž . Ž . Ž . Ž . Ž .
May88 12 548 0.886 0.002 0.926 0.002 0.731 0.006 0.827 0.007 0.598 0.013 0.353 0.026 y0.194 0.005 y0.173 0.007
Ž . Ž . Ž . Ž . Ž . Ž . Ž . Ž .
Apr93 11 622 0.876 0.002 0.908 0.002 0.722 0.007 0.808 0.008 0.629 0.013 0.437 0.032 y0.186 0.006 y0.165 0.008
Ž . Ž . Ž . Ž . Ž . Ž . Ž . Ž .
Feb95 25 340 0.855 0.003 0.891 0.003 0.698 0.009 0.776 0.011 0.593 0.018 0.449 0.039 y0.194 0.008 y0.179 0.006
Ž . Ž . Ž . Ž . Ž . Ž . Ž . Ž .
Feb97 22 801 0.850 0.003 0.883 0.003 0.705 0.009 0.779 0.010 0.605 0.018 0.440 0.041 y0.178 0.007 y0.161 0.006
Ž . Ž . Ž . Ž . Ž . Ž . Ž . Ž .
( )
H.S. Farber, H. LeÕyrJournal of Health Economics 19 2000 93–119 105
insurance: takeup rates for old part-time workers remained approximately constant at about 60%, while the takeup rate for new part-time workers increased from 35.3% to 44.0% between 1988 and 1997. The result is very little change in the
Ž .
core-peripheral differential, either unadjusted column 7 or regression-adjusted Žcolumn 8 ..
4. Decomposing the decline in health insurance coverage
Our analysis so far has focused on trends in three components of health insurance coverage — offering, eligibility, and takeup — for four groups of jobs Žold full-time, new full-time, old part-time and new part-time . We would like to. be able to say at this point how important each component of coverage is in driving the overall trend in coverage. In order to do this, recall that the coverage
Ž .
rate in period t 1988 or 1997 is defined as
CtsO E Tt t t
Ž .
1where C is the coverage rate in period t, O is the offering rate in period t, E ist t t
the eligibility rate conditional on offering in period t, and T is the takeup ratet
conditional on offering and eligibility in period t. The change in coverage can be written as
C97yC88s
Ž
O97yO88.
E T88 88qŽ
E97yE88.
O T88 88qŽ
T97yT88.
O88E88qcovariance term
Ž .
2or in more compact notation as:
DCsDO E TqDE O TqDT O Eqcov
Ž .
3where the first three terms are percentage point changes in the coverage rate due to changes in the offering rate, the eligibility rate, and the takeup rate, respectively.7
Ž .
The elements of the decomposition in Eq. 3 using data for all workers are presented in the far right-hand column of the first panel in Table 6. A similar decomposition performed separately for each group of workers is presented in the first four columns of the first panel of Table 6.
The decomposition for all workers shows that declines in takeup rates and declines in eligibility rates contributed equally to the overall decline in coverage. These two factors were offset by an increase in the offer rate that reduced the overall decline in coverage by about eight-tenths of a percentage point.
7
( ) H.S. Farber, H. LeÕyrJournal of Health Economics 19 2000 93–119 106
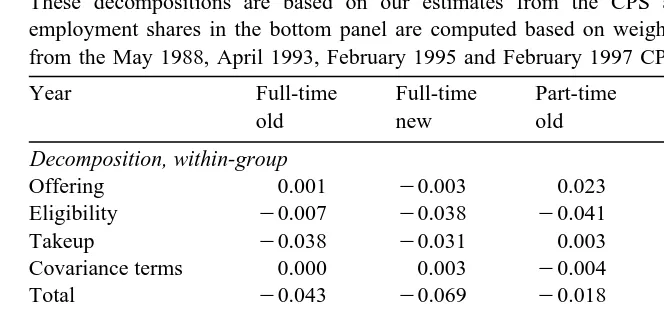
Table 6
Decomposition of decline in health insurance coverage: 1988–1997 private sector workers ages 20–64 by job type
These decompositions are based on our estimates from the CPS as described in the text. The employment shares in the bottom panel are computed based on weighted averages of the cell counts from the May 1988, April 1993, February 1995 and February 1997 CPS samples.
Year Full-time Full-time Part-time Part-time Total
old new old new
Decomposition, within-group
Offering 0.001 y0.003 0.023 0.018 0.007
Eligibility y0.007 y0.038 y0.041 y0.039 y0.023
Takeup y0.038 y0.031 0.003 0.024 y0.028
Covariance terms 0.000 0.003 y0.004 y0.014 0.000
Total y0.043 y0.069 y0.018 y0.011 y0.044
Decomposition of oÕerall changes, weighted by employment share
Offering 0.001 y0.001 0.004 0.003 0.007
Eligibility y0.004 y0.007 y0.008 y0.007 y0.026
Takeup y0.024 y0.006 0.001 0.003 y0.026
Covariance terms 0.000
Total y0.027 y0.013 y0.003 y0.001 y0.044
Employment Share 0.712 0.150 0.095 0.044 1.000
Looking at within-group decompositions reveals that the factors driving the decline in coverage are quite different across job types. The most striking difference is in the role of eligibility. For core workers, the decline in eligibility contributes less than one-fifth of the overall decline in coverage; for new full-time workers, eligibility declines account for more than half of the declines in coverage, and for both old and new part-time workers, eligibility declines are entirely responsible for the decline in coverage, since both offering and takeup for these groups actually increased to offset the decline in eligibility.
Changes in takeup rates were also quite different across job types. Takeup contributed a substantial part of the decline for both old and new full-time workers Ž3.8 percentage points and 3.1 percentage points, respectively , while it con-.
Ž .
tributed a slight increase for old part-time workers 0.3 percentage points and a
Ž .
substantial increase for new part-time workers 2.4 percentage points . Changes in offer rates had little effect on the overall decline in coverage for both old and new full-time workers. For old part-time workers, however, the increase in offer rates offset about half the decline in coverage that would otherwise have occurred. These findings are consistent with our view that employers are maintaining benefits for core workers, while restricting access to these benefits for peripheral workers.
( )
H.S. Farber, H. LeÕyrJournal of Health Economics 19 2000 93–119 107
example, how much did the decline in eligibility for part-time new workers contribute to the overall decline in coverage? In order to do this, we begin by noting that since the employment shares of the four groups of workers are fairly constant over this period we can write the overall change in each element of coverage as the weighted average of changes for subgroups of workers:
DOsa DO qa DO qa DO qa DO
Ž .
4where a is the employment share and O , E , and T are the offering, eligibility
i i i i
Ž .
and takeup rates for group i is1, 2, 3, 4 . Substituting each of these expressions Ž .
into Eq. 3 yields the following expression:
DCs
Ž
a DO E Tqa DO E Tqa DO E Tqa DO E T.
where each element of this expression represents the contribution of a particular group and factor the overall change in coverage. So, for example, the first element of the first row represents the change in coverage attributable to the change in
Ž .
offering for ‘‘group 1’’ workers however ‘‘group 1’’ is defined ; the second element of the first row represents the change in coverage attributable to the change in offering for ‘‘group 2’’ workers; the first element of the second row represents the change in coverage attributable to the change in eligibility for ‘‘group 1’’ workers, etc.
The final result of these calculations is presented in the bottom panel of Table 6. Presenting our results this way allows us to see which factors are driving declines in coverage, and several conclusions emerge. The single most important grouprfactor driving the overall decline in coverage is the decline in takeup for
Ž
core workers not surprising since they are by far the largest group of workers, . 8
comprising 71.2% of total employment . Changes in eligibility for each of the three types of peripheral workers are the next largest factors contributing to the decline, and together explain almost as much of the decline in overall coverage as
Ž .
does takeup for core workers. Overall, about six-tenths s0.027r0.044 of the decline in coverage is driven by the coverage decline for core workers, with the remaining four-tenths driven by peripheral workers.
To summarize the results we have presented so far: we find that there are declines in coverage for all types of workers. The rate at which workers are offered insurance either did not change or increased over the period 1988 to 1997,
8 Ž .
( ) H.S. Farber, H. LeÕyrJournal of Health Economics 19 2000 93–119 108
while eligibility declined for all types of workers. Take-up rates declined for core workers and new full-time workers, while they increased for both old and new part-time workers. The most important factors contributing to the overall decline in health insurance were the decline in eligibility for peripheral workers and the decline in takeup for core workers.
5. Spousal coverage
The fact that takeup declines among core workers, which are presumably voluntary, are a substantial factor in the overall decline in coverage leads us to wonder whether some of the coverage decline represents a shift from one source of coverage to another rather than the decision to go without health insurance altogether. So far, we have considered only whether workers are covered by group health insurance sponsored by their own employer. A substantial fraction of workers, however, may obtain coverage as dependents on a spouse’s employer-sponsored insurance policy. We hypothesize that some of the declines in coverage
Ž .
from a worker’s own employer referred to as ‘‘own coverage’’ that we have documented may have been offset by increased rates of coverage from a spouse’s
Ž . 9
employer referred to as ‘‘spousal coverage’’ . Further, if this phenomenon has affected core and peripheral workers differently, it may explain some of the apparently widening gap between these groups of workers. We use information contained in these supplements and also in the March 1988 CPS to construct an estimate of the fraction of workers with spousal coverage and use this measure to
Ž
see how rates of own coverage, spousal coverage, and any coverage the sum of .
own and spousal coverage vary by type of job. We conclude by presenting a decomposition that is similar to the one in Table 6, but focuses on the change in
Ž .
the rate of coverage from any source own policy or spousal coverage so that we can say how changing rates of spousal coverage have affected the overall trend in insurance coverage.
5.1. Trends in spousal coÕerage
Table 7 incorporates the new information on spousal coverage with the information on own coverage from Table 2 and presents the resulting rate of
9
Note that we define spousal coverage and own coverage so that they are mutually exclusive: spousal coverage is held only by those who do not have their own coverage. This is because the February 1995 and 1997 supplements do not include information on other sources of insurance coverage for individuals with their own employer-sponsored coverage. The 1988 and 1993 data do include this information but we have chosen not to use it in favor of constructing variables that are consistent over a longer time period. Because the method of constructing these variables varies over
Ž .
()
H.S.
Farber,
H.
Le
Õ
y
r
Journal
of
Health
Economics
19
2000
93
–
119
109
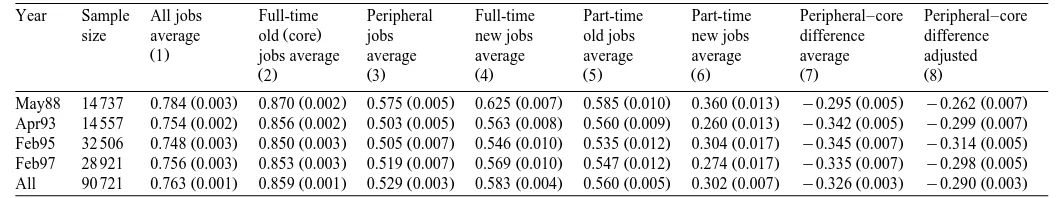
Table 7
Fraction of workers with any employer-sponsored health insurance coverage by year and job type private sector workers ages 20–64
The numbers in parentheses are standard errors. The numbers in columns 1–6 are the fraction of workers in each group with any employer-sponsored health insurance coverage based on weighted tabulations of data from the relevant supplements to the CPS. The average difference in column 7 is computed as the
Ž .
difference between the rate of employer-sponsored health insurance coverage from any source for workers in peripheral jobs column 3 and the coverage rate
Ž .
for workers in core jobs column 2 . The adjusted differences reported in column 8 are the coefficients on a peripheral job dummy variable from separate OLS regressions for each year of the any health insurance coverage indicator on the peripheral job dummy variable and controls for age, education, sex, and race. The regression adjustment for the ‘‘all’’ sample includes survey dummy variables as well. All counts are weighted by the CPS supplement weights. The sample includes all private sector workers ages 20–64 who are not self-employed.
Year Sample All jobs Full-time Peripheral Full-time Part-time Part-time Peripheral–core Peripheral–core
Ž .
size average old core jobs new jobs old jobs new jobs difference difference
Ž .1 jobs average average average average average average adjusted
Ž .2 Ž .3 Ž .4 Ž .5 Ž .6 Ž .7 Ž .8
Ž . Ž . Ž . Ž . Ž . Ž . Ž . Ž .
May88 14 737 0.784 0.003 0.870 0.002 0.575 0.005 0.625 0.007 0.585 0.010 0.360 0.013 y0.295 0.005 y0.262 0.007
Ž . Ž . Ž . Ž . Ž . Ž . Ž . Ž .
Apr93 14 557 0.754 0.002 0.856 0.002 0.503 0.005 0.563 0.008 0.560 0.009 0.260 0.013 y0.342 0.005 y0.299 0.007
Ž . Ž . Ž . Ž . Ž . Ž . Ž . Ž .
Feb95 32 506 0.748 0.003 0.850 0.003 0.505 0.007 0.546 0.010 0.535 0.012 0.304 0.017 y0.345 0.007 y0.314 0.005
Ž . Ž . Ž . Ž . Ž . Ž . Ž . Ž .
Feb97 28 921 0.756 0.003 0.853 0.003 0.519 0.007 0.569 0.010 0.547 0.012 0.274 0.017 y0.335 0.007 y0.298 0.005
Ž . Ž . Ž . Ž . Ž . Ž . Ž . Ž .
( ) H.S. Farber, H. LeÕyrJournal of Health Economics 19 2000 93–119 110
employer-sponsored coverage from any source by type of job. While the raw differences in rates of any coverage between core and peripheral workers are smaller than were the differences in own coverage reported in Table 2, they are
Ž . Ž
still large 32.6 percentage points on average and increasing over time from 29.5 .
percentage points in 1988 to 33.5 percentage points in 1997 . The
regression-ad-Ž .
justed differentials are slightly smaller 29.0 percentage points on average but exhibit a similar trend.10
5.2. Adding spousal coÕerage to the decomposition
In order to determine how much of the decline in own-employer group coverage is offset by the increase in spousal coverage, we analyze changes in the rate of employer-sponsored coverage from any source using an amended version of the decomposition described in Section 4. We begin by writing the rate of coverage by any employer-sponsored health insurance, HI , as the sum of own-t
employer coverage and spousal coverage:
HItsCtqSt
Ž .
8where C and S represent own coverage and spousal coverage as defined above.t t
Writing the change in the overall rate of group insurance coverage as
DHIsDCqDS
Ž .
9Ž .
and substituting the right-hand side of Eq. 3 above for DC yields a five-term decomposition of DHI:
DHIsDO E TqDE O TqDT O EqcovqDS
Ž
10.
We can also decompose the change in spousal coverage by worker group as in Section 4:
DSsa DS qa DS qa DS qa DS
Ž
11.
1 1 2 2 3 3 4 4
Ž .
and substitute this result into Eq. 10 . Doing this and expanding the other
Ž Ž . Ž ..
elements of the decomposition as before shown in Eqs. 4 – 6 yields the following expression for the change in overall health insurance coverage rates:
DHIs
Ž
a DO E Tqa DO E Tqa DO E Tqa DO E T.
1 1 2 2 3 3 4 4
q
Ž
a DE O Tqa DE O Tqa DE O Tqa DE O T.
1 1 2 2 3 3 4 4
q
Ž
a DT O Eqa DT O Eqa DT O Eqa DT O E.
1 1 2 2 3 3 4 4
q
Ž
a DS qa DS qa DS qa DS.
qcovŽ
12.
1 1 2 2 3 3 4 4
10
( )
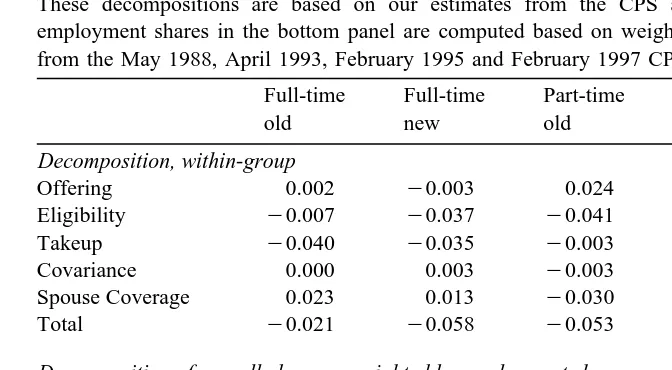
H.S. Farber, H. LeÕyrJournal of Health Economics 19 2000 93–119 111 Table 8
Decomposition of decline in health insurance coverage: 1988–97 private sector workers ages 20–64 by job type May 1988
These decompositions are based on our estimates from the CPS as described in the text. The employment shares in the bottom panel are computed based on weighted averages of the cell counts from the May 1988, April 1993, February 1995 and February 1997 CPS samples.
Full-time Full-time Part-time Part-time Total
old new old new
Decomposition, within-group
Offering 0.002 y0.003 0.024 0.018 0.007
Eligibility y0.007 y0.037 y0.041 y0.039 y0.022
Takeup y0.040 y0.035 y0.003 0.020 y0.031
Covariance 0.000 0.003 y0.003 y0.013 0.000
Spouse Coverage 0.023 0.013 y0.030 y0.072 0.015
Total y0.021 y0.058 y0.053 y0.085 y0.031
Decomposition of oÕerall changes, weighted by employment share
Offering 0.001 0.000 0.002 0.001 0.004
Eligibility y0.005 y0.005 y0.004 y0.002 y0.016
Takeup y0.028 y0.005 0.000 0.001 y0.033
Covariance 0.000 0.000 0.000 y0.001 y0.000
Spouse Coverage 0.016 0.002 y0.002 y0.003 0.012
Total y0.015 y0.009 y0.005 y0.004 y0.032
Employment Share 0.713 0.149 0.095 0.043 1.000
We proceed as in Section 4 by performing this decomposition separately for each subgroup of workers. We also present overall results based on weighting the elements of each decomposition by the group’s employment share.
Table 8 presents the results of these decompositions. The addition of spousal coverage changes the results noticeably: about 30% of the overall decline in coverage is offset by increases in spousal coverage. More than half of the decline
Ž
in takeup or approximately half of the total decline in coverage that would .
otherwise have occurred for core workers is offset by the increase in spousal coverage for this group. Increases in spousal coverage also offset about one-fifth of the effect of takeup and eligibility declines for new full-time workers. For both old and new part-time workers, however, decreases in spousal coverage contribute to rather than offset the decline in overall coverage that occurred for these groups. Thus, adding spousal coverage to the analysis lends further support to the view that peripheral workers have been harder hit by declining benefits than have core workers.
6. Analysis by educational category
We would also like to know whether declines in health insurance have
Ž .
()
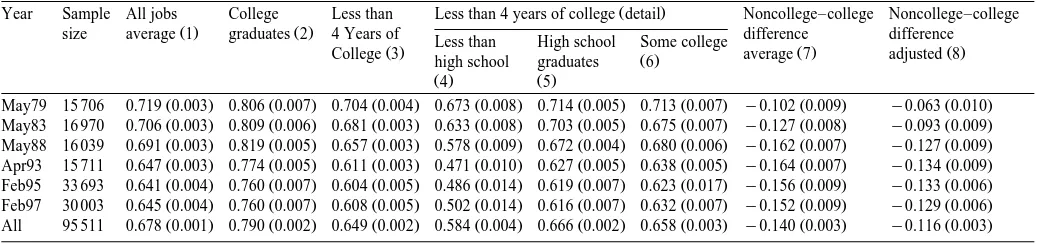
Fraction covered by health insurance provided by their employer by year and educational attainment private sector workers ages 20–64 all job types core and
.
peripheral
The numbers in parentheses are standard errors. The numbers in columns 1–6 are the fraction of workers in each group reporting that they are covered by their own employer-provided health insurance based on weighted tabulations of data from the relevant supplements to the CPS. The average difference in column 7
Ž .
is computed as the difference between the health insurance coverage rate for workers with less than four years of college column 3 and the coverage rate for
Ž .
all workers with four years of college or more column 2 . The adjusted differences reported in column 8 are the coefficients on a less-than-four-years-of-col-lege dummy variable from separate OLS regressions for each year of the health insurance coverage indicator on the less-than-colless-than-four-years-of-col-lege dummy variable and controls for age, education, sex, race, marital status, and the interaction of sex and marital status. The regression adjustment for the ‘‘all’’ sample includes survey dummy variables as well. All counts are weighted by the CPS supplement weights. The sample includes all private sector workers ages 20–64 who are not self-employed.
Ž .
Year Sample All jobs College Less than Less than 4 years of college detail Noncollege–college Noncollege–college
Ž . Ž .
size average 1 graduates 2 4 Years of Less than High school Some college difference difference
Ž . Ž . Ž .
College 3 high school graduates Ž .6 average 7 adjusted 8
Ž .4 Ž .5
Ž . Ž . Ž . Ž . Ž . Ž . Ž . Ž .
May79 15 706 0.719 0.003 0.806 0.007 0.704 0.004 0.673 0.008 0.714 0.005 0.713 0.007 y0.102 0.009 y0.063 0.010
Ž . Ž . Ž . Ž . Ž . Ž . Ž . Ž .
May83 16 970 0.706 0.003 0.809 0.006 0.681 0.003 0.633 0.008 0.703 0.005 0.675 0.007 y0.127 0.008 y0.093 0.009
Ž . Ž . Ž . Ž . Ž . Ž . Ž . Ž .
May88 16 039 0.691 0.003 0.819 0.005 0.657 0.003 0.578 0.009 0.672 0.004 0.680 0.006 y0.162 0.007 y0.127 0.009
Ž . Ž . Ž . Ž . Ž . Ž . Ž . Ž .
Apr93 15 711 0.647 0.003 0.774 0.005 0.611 0.003 0.471 0.010 0.627 0.005 0.638 0.005 y0.164 0.007 y0.134 0.009
Ž . Ž . Ž . Ž . Ž . Ž . Ž . Ž .
Feb95 33 693 0.641 0.004 0.760 0.007 0.604 0.005 0.486 0.014 0.619 0.007 0.623 0.017 y0.156 0.009 y0.133 0.006
Ž . Ž . Ž . Ž . Ž . Ž . Ž . Ž .
Feb97 30 003 0.645 0.004 0.760 0.007 0.608 0.005 0.502 0.014 0.616 0.007 0.632 0.007 y0.152 0.009 y0.129 0.006
Ž . Ž . Ž . Ž . Ž . Ž . Ž . Ž .
( )
H.S. Farber, H. LeÕyrJournal of Health Economics 19 2000 93–119 113
document a substantial increase in the college wage premium between 1979 and 1987, so we are particularly interested in any differences in trends in health insurance coverage for college-educated workers and those with less education over that period. Therefore, we replicate the preceding analysis, this time catego-rizing workers by their educational attainment instead of corerperipheral status. We present results based on four categories: four years of college or more, some
Ž .
college but less than four years , high school graduate, and less than high school. Table 9 shows trends in own health insurance coverage by educational category for all workers from 1979 to 1997. At any point in time, the coverage rate increases monotonically with workers’ education. Moreover, while workers with less than four years of college experienced a decrease in the coverage rate from
Ž .
70.4% in 1979 to 65.7% in 1988 column 3 , coverage for college graduates
Ž .
increased over the same period from 80.6% to 81.9% column 2 . As a result, the
collegernoncollege differential in health insurance coverage increased from 10.2 percentage points in 1979 to 16.2 percentage points in 1988. This result suggests that if health insurance were taken into account, the picture for less-educated
Ž
workers would appear to have grown even bleaker relative to more highly .
educated workers over the 1979–1988 period than an analysis of wages alone
Ž .
would suggest. This is consistent with a recent study by Brooks Pierce 1998 using data from the Employment Cost Index to show that the dispersion of
Ž .
compensation wages plus health insurance plus pensions is greater than the dispersion of wages alone at a point in time, and has also increased more in the past 10–15 years.
Since 1988, the coverage differential between college graduates and those with less education has remained more or less constant. This is because college graduates experienced a decline in coverage between 1988 and 1993 of
approxi-Ž mately the same absolute size as that experienced by less-educated workers about
.
4.5 percentage points . Thus, adding health insurance to an analysis of more recent wage changes would increase inequality in compensation at any point in time but would not necessarily contribute to any increase in inequality over the 1988–1997 period.
We also perform an analysis of trends in different components of coverage Žoffering, eligibility and takeup over the 1988–1997 period by education category. separately for all workers, core workers, and peripheral workers. The highlights of these analyses are presented in the decompositions in Table 10.11 Because the distribution of employment across educational categories was not stable over this period, we present only within-group decompositions and omit the decomposition weighted by employment share that was presented earlier.
The results of the decomposition reveal striking differences in the factors underlying the coverage trends for workers with different levels of education. The
11
( ) H.S. Farber, H. LeÕyrJournal of Health Economics 19 2000 93–119 114
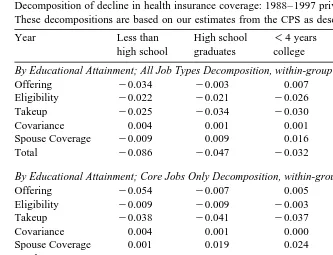
Table 10
Decomposition of decline in health insurance coverage: 1988–1997 private sector workers ages 20–64 These decompositions are based on our estimates from the CPS as described in the text.
Year Less than High school -4 years College Total
high school graduates college graduates
By Educational Attainment; All Job Types Decomposition, within-group
Offering y0.034 y0.003 0.007 y0.004 0.007
Eligibility y0.022 y0.021 y0.026 y0.019 y0.022
Takeup y0.025 y0.034 y0.030 y0.037 y0.030
Covariance 0.004 0.001 0.001 0.001 0.000
Spouse Coverage y0.009 0.009 0.016 0.030 0.015
Total y0.086 y0.047 y0.032 y0.029 y0.030
By Educational Attainment; Core Jobs Only Decomposition, within-group
Offering y0.054 y0.007 0.005 y0.002 0.002
Eligibility y0.009 y0.009 y0.003 y0.005 y0.007
Takeup y0.038 y0.041 y0.037 y0.046 y0.040
Covariance 0.004 0.001 0.000 0.000 0.000
Spouse Coverage 0.001 0.019 0.024 0.036 0.023
Total y0.097 y0.037 y0.012 y0.016 y0.021
By Educational Attainment; Peripheral Jobs Only Decomposition, within-group
Offering y0.001 y0.003 0.012 y0.006 0.013
Eligibility y0.035 y0.053 y0.060 y0.055 y0.050
Takeup 0.002 y0.033 y0.023 y0.015 y0.020
Covariance 0.000 0.005 0.001 0.002 0.000
Spouse Coverage y0.032 y0.012 0.000 0.008 y0.005
Total y0.066 y0.095 y0.070 y0.065 y0.061
overall decomposition for both core and peripheral workers is presented in panel 1 of Table 10. This table shows that workers who did not complete high school experienced declines in all components of coverage, including offering. The most highly educated group of workers, by contrast, experienced the smallest decline in eligibility, and the largest offsetting increase in spousal coverage. In general, as education level increases, workers experience smaller declines in coverage, the share of the decline that is attributable to changes in takeup increases, the share of the decline that is attributable to changes in eligibility decreases, and the offsetting effect of spousal coverage increases.
Disaggregating workers into core and peripheral and repeating the analysis by education category reveals interesting differences between the two types of jobs in the effect of education on coverage trends. While the decomposition by education category for workers on core jobs look very much like the decomposition for all
Ž .
workers discussed in the previous paragraph see panel 2 of Table 10 , education did not serve uniformly as a buffer against declines in health insurance for
Ž .
( )
H.S. Farber, H. LeÕyrJournal of Health Economics 19 2000 93–119 115
the board by declines in eligibility, regardless of their education level.12 How-ever, more highly-educated peripheral workers were still better off than their less-educated counterparts. For peripheral workers with less than a high school education, spousal coverage declined as much as did own coverage, while more highly-educated peripheral workers saw very little change in rates of spousal coverage. Overall, then, education protected workers on core jobs against coverage declines but offered only limited protection to workers on peripheral jobs against declines in coverage.
7. Discussion of results
The finding that eligibility has declined substantially for peripheral workers leads us to wonder about the legal limits on firms’ ability to offer health insurance to some workers but not others, based on their tenure with the firm or weekly hours of work, without sacrificing the tax deductibility of premiums from workers’ incomes.13 In fact, the laws governing non-discrimination in the provision of health insurance changed during the period we analyze.14 Table 11 summarizes these laws, which distinguish between commercially purchased insurance plans
Ž
and those that are self-insured that is, those for which financial risk is borne .
primarily by the firm, rather than by an insurance company . Before 1978, there were no nondiscrimination requirements applicable to employer-sponsored health
Ž .
insurance. In 1978, Title 26 of the US Code the Internal Revenue Code was amended to include provisions prohibiting discrimination in favor of ‘‘highly compensated individuals’’ in the provision of health insurance; if a plan was found to discriminate, the benefits of the highly compensated individuals would be subject to income tax. These provisions applied to self-insured plans but not to commercially insured plans. In 1986 the Code was amended again to include even stricter nondiscrimination requirements that applied to both self-insured and commercially insured plans. These stricter requirements were repealed in 1989,
12
We performed separate analyses by education category for each subgroup of peripheral workers as well. These analyses reveal that trends for full-time new workers — who, as noted above, include both workers in short-term jobs and workers in what will ultimately be long-term jobs — vary by education level as do those for core workers, while it is primarily for both types of part-time workers that education provides less of a buffer. This supports the view that full-time new workers are a diverse group containing some workers who might better be considered ‘‘core’’ workers.
13
The discussion that follows relies on a report prepared by the staff of the Joint Committee on
Ž . Ž
Taxation 1998 and on Sections 105, 106 and 125 of the Internal Revenue Code Title 26 of the US
.
Code and Section 89 of an earlier version of the Code. We are grateful to an anonymous referee for pointing out the relevance of nondiscrimination law and to Bill Bortz of the US Department of the Treasury for helpful conversations on this issue.
14
Ž .
()
H.S.
Farber,
H.
Le
Õ
y
r
Journal
of
Health
Economics
19
2000
93
–
119
116
Table 11
Summary of health insurance nondiscrimination laws related to part-time statusrjob tenure
Ž . Ž .
Source: US Code Title 26, Sections 105, 125, and 89 repealed ; Joint Committee on Taxation 1998 .
Provision Years in effect Covers Workers excluded from Non-discrimination requirement
Ž
consideration in determining applied to all workers except
.
whether plan is discriminatory those specified in the preceding column
Ž .
U.S.C 126, 1978–10r21r86; Self-insured i -3 years tenure Among workers not excluded from
Ž . Ž .
Section 105 h 11r9r86–present plans only ii -age 25 consideration, plan must cover 70%
Ž .iii part-timerseasonal workers of workers or 80% of all those eligible
Žnot further defined. if at least 70% of workers are eligible.
Ž .iv employees covered through their unions
Ž .v nonresident aliens with no US income from the firm
Ž .
U.S.C 126, 10r22r86–11r8r89 All plans i -6 months tenure A variety of complex rules; sufficient
Ž .
Section 89 ii -age 21 conditions to ensure nondiscrimination are
Ž .iii -17.5 hrweek or that 80% of non-highly compensated workers
-6 monthsryear are covered, and that eligibility rules
Ž . Živ same as iv aboveŽ . . do not discriminate in favor of highly
( )
H.S. Farber, H. LeÕyrJournal of Health Economics 19 2000 93–119 117
and the original, weaker requirements that had been in place in 1986 were reinstated, applying as before to self-insured plans only, so that commercially provided plans returned to their original unregulated state.15
Was the weakening of nondiscrimination requirements in 1989 responsible for the decline in eligibility for peripheral workers that occurred between 1988 and 1993? A convincing answer to this question would require data that allow us to distinguish between coverage self-insured and commercially insured plans, which the CPS data do not. Nonetheless, our results offer no evidence to refute this hypothesis, and since it is plausible that the change in the law may have contributed to the decline in eligibility, we believe this possibility deserves further attention.
It is also possible that employers have begun to chip away at eligibility along
Ž .
these dimensions job tenure and hours of work while remaining well within the margins of what is allowed by nondiscrimination laws. For example, an increase of the fraction of firms requiring a short waiting period before new workers are eligible for benefits would help explain the decline in eligibility we observe for
Ž .
new workers. Data from the Employee Benefits Surveys EBS sponsored by the Bureau of Labor Statistics suggest that this may be occurring. For medium and large firms in 1988, the proportion in the EBS with a service requirement, without a requirement, and data not available are 45%, 40% and 15%, respectively, while
Ž . 16
in 1995 they are 64%, 31% and 5% Bureau of Labor Statistics, 1989, 1998 . Further analysis of establishment-level data over time could provide more informa-tion on such increases in service requirements.
8. Conclusion
Our analysis of the CPS suggests that two factors are primarily responsible for declines in coverage. The first factor is a decline in takeup for core workers, more than half of which is offset by an increase in the rate of spousal coverage for these
15
Two other types of ‘‘nondiscrimination’’ law deserve mention although they are of less direct relevance to our analysis. First, since 1978, Section 125 of the IRS Code has required that cafeteria plans that provide health benefits must do so in a way that does not discriminate in favor of highly compensated employees; if this requirement is not met, the benefits of highly compensated employees will be taxable. The statute does not provide specific guidance about whether or not part-time workers must be considered in the determination of discrimination, but does allow workers with tenure of less than three years to be excluded from consideration; by analogy with the more sophisticated
nondiscrim-Ž .
ination rules for pensions contained in Section 410 b of Title 26, it is widely believed that excluding all part-time workers from coverage is acceptable. Second, one of the many effects of the 1996 Health Insurance Portability and Accountability Act was to prohibit eligibility rules which discriminate on the basis of health status, a category that our current analysis does not consider.
16
( ) H.S. Farber, H. LeÕyrJournal of Health Economics 19 2000 93–119 118
workers. The second factor is a decline in eligibility that is particularly large for new full-time workers and old part-time workers. While about four-tenths of the eligibility decline for new full-time workers is offset by an increase in spousal coverage, declines in the rate of own coverage for both new and old part-time workers are exacerbated by declining rates of spousal coverage. Moreover, we find that among core workers, the least educated workers were hardest hit by these declines, while among peripheral workers the declines occurred across the board regardless of workers’ education level. Thus, the evidence is consistent with the view that employers are continuing to make health insurance available to their core long-term, full-time employees but are restricting access to health insurance by their peripheral short-term and part-time employees, so that the quality of core and peripheral jobs in this dimension is diverging.
Acknowledgements
We thank Bill Bortz, David Cutler, Michael Gibbs, Jonathan Gruber, Michael Lettau, Doug Staiger, participants in the 1998 American Compensation Associa-tion Academic Research Conference, participants in the Princeton University labor lunch and two anonymous referees for helpful comments. Farber thanks the AARP for financial support of an earlier version of this work.
References
Abraham, K.G., Medoff, J.L., 1984. Length of service and layoffs in union and nonunion work groups. Industrial and Labor Relations Review 38, 87–97.
Bennefield, R., 1998. Health insurance coverage: 1997. Current Population Reports P60-202, US Bureau of the Census.
Blostin, A.P., Pfuntner, J.N., 1998. Employee medical care contributions on the rise. Compensation and Working Conditions Spring, 46–51.
Bluestone, B., Harrison, B., 1986. The great American jobs machine, Study prepared for the US Joint Economic Committee.
Bluestone, B., Harrison, B., 1988. The growth of low-wage employment: 1963–86. American
Ž .
Economic Review 78 2 , 124–128.
Bureau of Labor Statistics, 1989. Employee benefits in medium and large firms, 1988. Bulletin 2336. Bureau of Labor Statistics, 1998. Employee benefits in medium and large private establishments, 1995.
Bulletin 2496.
Ž .
Costrell, R.M., 1990. Methodology in the job quality debate. Industrial Relations 29 1 , 94–110. Cooper, P.F., Schone, B.S., 1997. More offers, fewer takers for employment-based health insurance:
Ž .
1987 and 1996. Health Affairs 16 6 , 142–149.
Cutler, D.M., Gruber, J., 1996. Does public insurance crowd out private insurance. Quarterly Journal of Economics 111, 391–430.