www.elsevier.comrlocaterdsw
Technical Note
Toward a taxonomy of manufacturing flexibility dimensions
Derrick E. D’Souza
), Fredrik P. Williams
Department of Management, UniÕersity of North Texas, Denton, TX 76203, USA
Received 26 February 1999; accepted 13 January 2000
Abstract
Researchers agree on the importance of manufacturing flexibility but are somewhat divided on the dimensions of this important construct. This paper seeks to find a middle-ground by working toward a generally acceptable taxonomy of manufacturing flexibility dimensions. The authors build on extant literature and propose a theoretically grounded opera-tionalization of the manufacturing flexibility construct. Operational measures of manufacturing flexibility dimensions are identified and tested on a sample of 240 manufacturing firms. Results indicate good support for the theorized taxonomy.
q2000 Elsevier Science B.V. All rights reserved.
Keywords: Manufacturing; Flexibility; Measurement; Empirical research
1. Introduction
Academicians and practitioners agree that the pressures of global competition will continue to grow in the twenty-first century. Barring some differences in terminology, the consensus is that the major com-petitive arenas will be cost, quality, and responsive-ness, where responsiveness refers to flexibility and
Ž .
speed Olhager, 1993 . Most managers agree that cost and quality will continue to be competitive arenas for a firm. However, they also note that these are not enough to compete effectively in the market-place. Flexibility to respond appropriately to changes in the competitive environment will be essential if a firm is to succeed in this increasingly global market-place. It is therefore incumbent on managers and
)Corresponding author. Tel.:q1-940-565-3140; fax:q
1-940-565-4394.
Ž .
E-mail address: [email protected] D.E. D’Souza .
researchers to strive for a better understanding of the flexibility construct.
The manufacturing flexibility construct is not as well understood as are the cost or quality constructs. We know that the cost of a product is a function of direct labor, direct materials, and allocated overhead. Consequently, most firms have a reasonably accurate understanding of the cost of producing their prod-ucts. The quality of a product is specifically defined when the firm identifies the characteristics that de-fine product quality in the mind of the customer. Firms measure those characteristics and compare the data with predetermined standards to assess the de-gree of conformance between the quality character-istics and the design specifications. Thus, one can conceivably determine whether a product has met a predetermined standard of quality.
Flexibility, on the other hand, is not determined quite so easily. Most researchers in the area of manufacturing flexibility agree on a workable
defini-0272-6963r00r$ - see front matterq2000 Elsevier Science B.V. All rights reserved.
Ž .
tion of manufacturing flexibility. However, we no-tice significant variation in perspectives when we try to break down manufacturing flexibility into its di-mensions, elements, and measures.
1.1. ObjectiÕes of the study
Gerwin notes that, ‘‘operationalizing flexibility is . . . the single most important research priority’’
Ž1993, p. 405 for researchers in the area of manu-.
facturing flexibility. However, only a few studies have operationalized this constructs, and even fewer studies have attempted to validaterrefine such opera-tionalizations based on empirical evidence. The ob-jective of this paper is to develop a theoretically-grounded and empirically-tested operationalization of the manufacturing flexibility construct. The devel-opment builds on extant literature and results in a set of dimensions and elements of the manufacturing flexibility construct. We use data collected from 264 manufacturing firms to assess the validity of our operationalization.
2. Manufacturing flexibility
Most studies on manufacturing flexibility provide implicitly or explicitly stated definitions of the man-ufacturing flexibility construct. Some representative definitions are presented below.
ØThe ability to change or react with few penalties
Ž .
in time, effort, cost, or performance Upton, 1994 .
ØThe ability to implement changes in the internal
operating environment in a timely manner at a rea-sonable cost in response to changes in market
condi-Ž .
tions Watts et al., 1993 .
ØIn the short run, flexibility means the ability to
adapt to changing conditions using the existing set and amount of resources. In the long run, it measures the ability to introduce new products, new resources and production methods, and to integrate these into
Ž .
the existing production system Olhager, 1993 .
ØThe ability to respond effectively to changing
Ž
circumstances Gerwin, 1987; Gupta and Gupta,
.
1991 .
ØThe capacity of a manufacturing system to adapt
successfully to changing environmental conditions and process requirements. It refers to the ability of
the production system to cope with the instability
Ž .
induced by the environment Swamidass, 1988 . There is considerable commonality in these defi-nitions of manufacturing flexibility. Specifically, they all describe manufacturing flexibility as the ability of the manufacturing function to react to changes in its environment. In addition, most of the definitions make some reference to the time such adjustments might take, the cost of the adjustments, and the effort
Ž .
required. This is consistent with Upton’s 1995 observation that each dimension of manufacturing flexibility can be represented by two elements: the
range of adjustment on the dimension, and the mo-bility of the adjustment on the dimension. We will
elaborate on these elements later. For now, we pre-sent a working definition of manufacturing flexibility that encompasses the components common to most definitions found in the literature: Manufacturing flexibility is a multidimensional construct that repre-sents the ability of the manufacturing function, to make adjustments needed to react to environmental changes without significant sacrifices to firm perfor-mance. Such adjustments are typically in the range of outputs andror the mobility to respond to change.
2.1. Dimensions of manufacturing flexibility
There is general agreement among researchers that manufacturing flexibility is a multidimensional concept. However, they differ on what the
underly-Ž .
ing dimensions should be. Sethi and Sethi 1990 suggest 11 dimensions of manufacturing flexibility,
Ž .
Gupta and Somers 1996 identify nine, whereas
Ž .
Gerwin’s 1993 taxonomy consists of seven dimen-sions. Some dimensions identified by researchers are strategic in nature. Examples include diversification of the product line, product innovation, responsive-ness to customer specifications, and strategic adapt-ability. Others are tactical in nature. Examples might include accommodating variations or shortages in components or raw materials and adjusting job rout-ing to bypass a disabled machine or process. Watts et
Ž .
is the manufacturing function of the organization, sometimes called the factory, plant, or production function of the firm. At this level of aggregation, the dimensions of interest are the ‘‘primary’’ dimen-sions. Hence, it is preferable that we focus on these primary dimensions, and not cloud our analysis with overlapping secondary dimensions.
Our initial task is to identify a parsimonious set of primary dimensions for manufacturing flexibility. We chose to use Gerwin’s taxonomy as the starting point for our development. It is representative of most of the flexibility frameworks discussed in the literature, and for the most part, it focuses on ‘‘primary’’ dimensions of manufacturing flexibility. His seven
Ž .
dimensions of manufacturing strategy include: 1
Õolume flexibility, the ability to change the volume
Ž .
of output of a manufacturing process; 2 materials
flexibility, the ability of the manufacturing system to
accommodate uncontrollable variations in the
materi-Ž .
als and parts being processed; 3 mix flexibility, the ability of the system to produce many different
Ž .
products during the same planning period; 4
modi-fication flexibility, the ability of the system to
incor-Ž .
porate design changes into a specific product; 5
changeoÕer flexibility, the ability of the system to
Ž .
adapt to changes in the production process; 6
rerouting flexibility, the ability to change the
se-quence of steps in the production process through
Ž .
which the product must progress; 7 flexibility re-sponsiÕeness, the ability to adjust emphasis on the
above flexibility dimensions given changes in the internal or external environment.
On viewing the first two dimensions, we note that as industries get more competitive, the ability of the manufacturing function to adjust the volume of out-put to meet market demand levels will increase. Thus,Õolume flexibility of the manufacturing system
is clearly an important primary flexibility dimension. On the other hand, the second dimension, materials
flexibility, has two components. The first is the
ability of the system to handle inputs that are ‘‘off-spec.’’ The second component is the materials han-dling flexibility of the system itself. We believe that competitive pressure on suppliers to deliver quality products, and the increasing popularity of TQM rou-tines that build supplier relationships, make off-spec inputs less of a problem for manufacturing firms. This has had the effect of diminishing the
signifi-cance of the first component of material flexibility. However, the second component, materials handling
flexibility, will continue to be an area of flexibility
that is very much under the control of the firm and hence will be of interest to researchers and managers alike.
Our analysis of the seven dimensions also reveals some commonality. While volume flexibility and material handling flexibility are unique flexibility dimensions, mix flexibility and modification flexibil-ity dimensions actually represent two perspectives on an underlying dimension that represents ‘‘ variety’’ of new and existing products that the manufacturing system can produce. We call this Õariety flexibility.
In addition, changeover flexibility and rerouting flex-ibility are two of several flexflex-ibility elements that reflect characteristics of the manufacturing ‘‘pro-cess’’ itself and are seen to represent a broader dimension that we call process flexibility. Finally, flexibility responsiveness is a category that reflects system mobility on each of the other dimensions and
Ž .
is what Upton 1994 called an element or sub-di-mension of all manufacturing flexibility disub-di-mensions. We will come back to this element a little later in the paper. We suggest that the remaining six components of manufacturing flexibility can be parsimoniously represented on four dimensions: volume flexibility, variety flexibility, process flexibility, and materials handling flexibility.
Ž
We also note that two of these dimensions volume
.
flexibility and variety flexibility are ‘‘externally driven,’’ toward meeting the market needs of the
Ž
firm. The other two dimensions process flexibility
.
and materials handling flexibility are ‘‘internally driven,’’ toward operational activities of the manu-facturing function. This classification is in line with the generally accepted view that the ‘‘dominant
ori-Ž
entation’’ of the firm Hambrick et al., 1982;
Gal-.
braith and Schendel, 1983 can be described along two dimensions — one that is internally driven and
Ž .
another that is externally driven Wheelwright, 1984 . In summary, the discussion presented above sug-gests that it is appropriate to view manufacturing flexibility dimensions as falling under two
general-Ž .
ized categories: 1 externally-driven dimensions, and
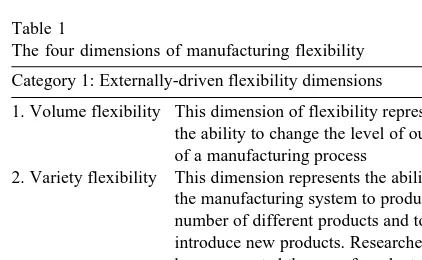
are process flexibility and materials handling flexi-bility. A more formal definition for each of the dimensions is presented in Table 1.
2.2. Manufacturing flexibility: integrating dimen-sions and elements
Implicit in the definitions of the four dimensions of manufacturing flexibility is the characterization of the extent or ‘‘range’’ of flexibility and also the agility or nimbleness of the firm to make the changes.
Ž .
Browne et al. 1984 were among the first to suggest the need to discuss the ability of a firm to operate within the broad parameters of a flexibility dimen-sion. They used the term ‘‘range of flexibility’’ when discussing the degree of flexibility provided by
Ž .
a flexible manufacturing system. Swamidass 1988 reinforced this notion when he argued that
manufac-Table 1
The four dimensions of manufacturing flexibility Category 1: Externally-driven flexibility dimensions 1. Volume flexibility This dimension of flexibility represents
the ability to change the level of output of a manufacturing process
2. Variety flexibility This dimension represents the ability of the manufacturing system to produce a number of different products and to introduce new products. Researchers have suggested the use of product mix and product modification as components of this dimension of manufacturing flexibility Category 2: Internally-driven flexibility dimensions
3. Process flexibility This dimension represents the ability of the system to adjust to and accommodate changesrdisruptions in the manufacturing process. Examples of these changesr disruptions found in the literature are, machine breakdowns, changes in the production schedules, or job sequencing 4. Materials handling This dimension represents the ability of flexibility the materials handling process to effec-tively deliver materials to the appropriate stages of the manufacturing process and position the part or the material in such a manner as to permit value adding operations
turing flexibility, when used properly, would result in a variety of products. However, he went one step further. He introduced the concept of ‘‘speed,’’ or mobility, when he stipulated that manufacturing flex-ibility could result in quicker changes in the product line. This quickness, or mobility is what Gerwin referred to as flexibility responsiÕeness, and is often
Ž
measured in terms of time and cost Gupta and
. Ž . Ž .
Goyal, 1989 . Gerwin 1993 , and later Upton 1994 , brought these concepts together when they argued that each dimension of manufacturing flexibility con-sisted of two elements, range and mobility. The greater the range of possible adjustments, the greater the flexibility. Also, the higher the mobility, the greater the flexibility.
To summarize, we identified four dimensions of manufacturing flexibility: Õolume flexibility, Õariety flexibility, process flexibility, and materials handling flexibility. We also note that each dimension has two
elements: range and mobility. Range is the element that defines the extent of flexibility on each dimen-sion. The element of mobility represents the firm’s agility in making the changes on each dimension. Section 3 explains how the dimensions and elements were operationalized.
3. Operationalizing the dimensions and elements of manufacturing flexibility
con-struct based on the dimension and element that they addressed.
We note that, although many measures have been suggested, not all of them explicitly focused on the range or the mobility element of the dimension. Hence, where a single measure seems to address both elements, we modified the measure so that it was directed toward only one element. For example, the dimension of volume flexibility might have been measured by the variation in quantity of output a system produces. Since it is possible to achieve wide ranges of variation if profitability is not a factor, the measure of the range element was appropriately al-tered to control for profitability. In general, some range elements may include references to cost, time, or profitability. However, these references are in-serted to improve the quality of the range measure by controlling for mobility.
Ž .
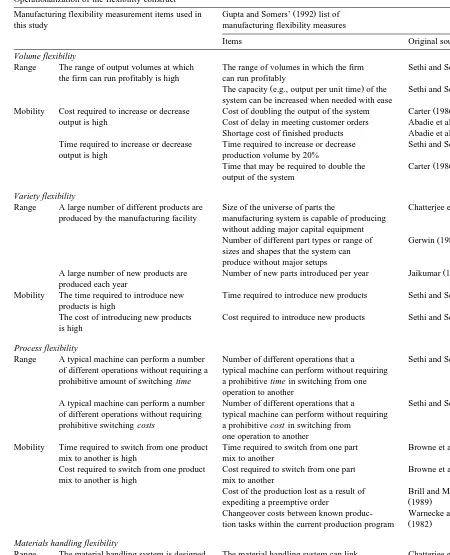
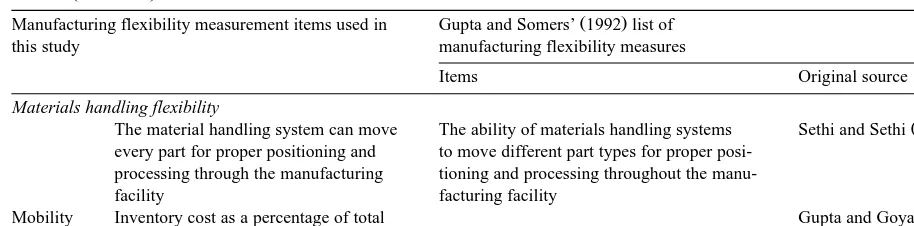
We used Gupta and Somers’ 1992 review of the literature on manufacturing flexibility as a baseline for operationalizing the four dimensions. Their work was one of the first attempts that used empirical evidence to associate measurement items with spe-cific underlying dimensions of manufacturing flexi-bility. Building on their work and other existing developments on the dimensions of manufacturing flexibility, we isolated measures that represent the range or the mobility element of the corresponding dimension. Details of the selection process are pre-sented below. A summary of the operationalizations of each manufacturing flexibility dimension is pre-sented in Table 2. In addition, the table presents
Ž .
measures recommended by Gupta and Somers 1996 . As Table 2 reveals, there is considerable agreement between the two sets of items. We have also pro-vided the sources of the measures used by both this study and that of Gupta and Somers.
3.1. Volume flexibility measures
3.1.1. Range
Measures of this element of the volume flexibility dimension are well documented in the literature.
Ž .
Browne et al. 1984 suggest that this element be measured as the smallest volume a system can pro-duce without significantly effecting firm
profitabil-Ž .
ity. Gerwin 1987 , on the other hand, offers two approaches. One is the ratio of average volume fluctuations to total capacity, and the other is an average of volume fluctuations over time. Sethi and
Ž .
Sethi 1990 recommend that one measure could be the range of output over which a firm can operate profitably.
We note that, although each of the above ap-proaches seems to address the range of volume flexibility from different perspectives, they all in-volve the determination of output levels at which the firm operates profitably. In fact, operationalization of the range element of volume flexibility is the least controversial flexibility dimension in the literature. Thus, we are comfortable using a single measure for volume flexibility that is both straightforward and objective, and we offer the following:
Ø The range of output volumes at which the firm
can run profitably.
3.1.2. Mobility
Fewer treatments of manufacturing flexibility ad-dress the issue of mobility as it pertains to volume flexibility. Those that do, however, are consistent in their use of ‘‘time’’ and ‘‘cost’’ as critical compo-nents for the mobility element of volume flexibility.
Ž .
Falkner 1986 recommends that constancy of per-unit manufacturing cost over different levels of out-put can be used as a measure of the mobility ele-ment. Two approaches are suggested by Carter
Ž1986 . One is the time required to double the output.
of a system in a given time period, and the other is the cost of doubling the system’s output. Sethi and
Ž .
Sethi 1990 place a quantitative limitation on the range of volume when they suggest using the time required to change volume of output by 20%. Be-cause of the practical limitations of acquiring time and cost data for a quantum change in manufacturing
Ž .
output e.g., 20% , we believe that generalized mea-sures would be more appropriate. We therefore pro-pose the following measures:
Ø Time required to increase or decrease output. Ø Cost of increasing or decreasing volume of
Table 2
Operationalization of the flexibility construct
Ž .
Manufacturing flexibility measurement items used in Gupta and Somers’ 1992 list of
this study manufacturing flexibility measures
Items Original source
Volume flexibility
Ž .
Range The range of output volumes at which The range of volumes in which the firm Sethi and Sethi 1990 the firm can run profitably is high can run profitably
Ž . Ž .
The capacity e.g., output per unit time of the Sethi and Sethi 1990 system can be increased when needed with ease
Ž .
Mobility Cost required to increase or decrease Cost of doubling the output of the system Carter 1986
Ž .
output is high Cost of delay in meeting customer orders Abadie et al., 1988
Ž .
Shortage cost of finished products Abadie et al., 1988
Ž .
Time required to increase or decrease Time required to increase or decrease Sethi and Sethi 1990
output is high production volume by 20%
Ž .
Time that may be required to double the Carter 1986 output of the system
Variety flexibility
Ž .
Range A large number of different products are Size of the universe of parts the Chatterjee et al. 1984 produced by the manufacturing facility manufacturing system is capable of producing
without adding major capital equipment
Ž .
Number of different part types or range of Gerwin 1987 sizes and shapes that the system can
produce without major setups
Ž .
A large number of new products are Number of new parts introduced per year Jaikumar 1984 produced each year
Ž .
Mobility The time required to introduce new Time required to introduce new products Sethi and Sethi 1990 products is high
Ž .
The cost of introducing new products Cost required to introduce new products Sethi and Sethi 1990 is high
Process flexibility
Ž .
Range A typical machine can perform a number Number of different operations that a Sethi and Sethi 1990 of different operations without requiring a typical machine can perform without requiring
prohibitive amount of switching time a prohibitive time in switching from one operation to another
Ž .
A typical machine can perform a number Number of different operations that a Sethi and Sethi 1990 of different operations without requiring typical machine can perform without requiring
prohibitive switching costs a prohibitive cost in switching from one operation to another
Ž .
Mobility Time required to switch from one product Time required to switch from one part Browne et al. 1984
mix to another is high mix to another
Ž .
Cost required to switch from one product Cost required to switch from one part Browne et al. 1984
mix to another is high mix to another
Cost of the production lost as a result of Brill and Mandelbaum
Ž .
expediting a preemptive order 1989
Changeover costs between known produc- Warnecke and Steinhilper
Ž .
tion tasks within the current production program 1982 Materials handling flexibility
Ž .
Range The material handling system is designed The material handling system can link Chatterjee et al. 1987 to link every machine with every other every machine to every other machine
Ž .
machine on the shop floor The ratio of the number of paths the Sethi and Sethi 1990 material handing systems can support to the total
Ž .
Table 2 continued
Ž .
Manufacturing flexibility measurement items used in Gupta and Somers’ 1992 list of
this study manufacturing flexibility measures
Items Original source
Materials handling flexibility
Ž .
The material handling system can move The ability of materials handling systems Sethi and Sethi 1990 every part for proper positioning and to move different part types for proper
posi-processing through the manufacturing tioning and processing throughout the
manu-facility facturing facility
Ž .
Mobility Inventory cost as a percentage of total Gupta and Goyal 1989
production cost is high
3.2. Variety flexibility measures
3.2.1. Range
This measure addresses the range of existing and new products produced by the manufacturing system. A measure of the existing range of products as
Ž .
offered by Carter 1986 is the extent to which the existing product mix can be changed while maintain-ing efficient production. As a measure of the range
Ž .
of new products, Dixon 1992 suggests a straight-forward measurement of the number of new products or the number of new samples produced. This
mea-Ž .
sure is similar to Gerwin’s 1987 suggestion of using the number of product innovations and the number of design changes as a measure. However, new products represent new designs. Discussions with product design engineers led us to conclude that the distinction between new product introduction and the modification of existing products is very indis-tinct. Exactly when does a product undergoing de-sign changes become a new product? We have tried to avoid that quagmire by making the simplifying assumption that new product introductions can also be used as an are an appropriate surrogate for prod-uct modificationrinnovation. We therefore offer the following measures for the range element of the variety dimension:
Ø The number of different products produced by the
manufacturing facility.
Ø The number of new products produced per year.
3.2.2. Mobility
As with volume flexibility, the measures of the mobility component of variety flexibility also fall
into the time and cost categories. Sethi and Sethi
Ž1990 recommend that the time and cost to intro-.
duce new products be used as measures. Abadie et
Ž .
al. 1988 offer a somewhat more ambiguous mea-sure: the cost of delay in meeting customer orders.
Ž .
Carter 1986 suggests a less direct way to measure variety mobility. He proposes the measurement of the robustness of production efficiencies. We chose Sethi and Sethi’s operationalization because it was straightforward and parsimonious. As with the range items, our mobility items also focus on new prod-ucts. Hence we offer the following measures:
Ø Time required to introduce new products. Ø Cost of introducing new products.
3.3. Process flexibility measures
3.3.1. Range
The research has highlighted several components of the manufacturing process that necessitate process flexibility. Those discussed in the literature include, machine breakdown, rerouting or resequencing of
Ž
jobs, and changes in the master schedule Browne et al., 1984; Chatterjee et al., 1984; Gerwin, 1987; Das
.
Ž .
similar to Sethi and Sethi’s 1990 global measures of the range of process flexibility:
Ø Number of operations a machine can perform
without incurring prohibitive switching times.
Ø Number of operations a machine can perform
without incurring prohibitive switching costs.
3.3.2. Mobility
Ž .
Sethi and Sethi 1990 suggest using the time required to add one unit of production capacity as a measure of the mobility element of process flexibil-ity. They also suggest using the cost of switching from one operation to another, and the procedural ease with which such changes can be made. Brill and
Ž .
Mandelbaum, 1989 recommend measuring the cost of production lost as a result of expediting a
preemp-Ž .
tive order. Warnecke and Steinhilper 1982 sug-gested using the costs incurred when switching be-tween one production program and other known
Ž .
alternatives. Browne et al. 1984 , however, sug-gested using the time and cost involved in switching from one part mix to another. It seems to us that the latter suggestion is the most direct and straight for-ward. In addition, it would be the easiest for opera-tions managers to assess. Since we are interested in flexibility at the factory level, we chose to use a global measure that captures the production program as a whole, and offer the following measures of the mobility element of process flexibility:
Ø Time required to switch from one product mix to
another.
Ø Cost required to switch from one product mix to
another.
3.4. Materials handling flexibility measures
3.4.1. Range
The literature offers a few suggestions for the measurement of materials handling flexibility. This dimension is generally described as the firm’s ability to move parts andror materials through a process in an effective and efficient manner. Sethi and Sethi
Ž1990 argue that the ratio of material handling paths.
to total number of processing paths would measure
the range of materials handling flexibility. Chatterjee
Ž .
et al. 1984 suggest a measure of this element might be the extent to which the material handling system can link every machine to all other machines. In
Ž .
addition, Sethi and Sethi 1990 recommend using the ability of the material handling system to move different parts for proper positioning and processing through the system as a measure. Consequently, the range element can best be measured in terms of the materials handling systems ability to support alterna-tive paths of movement through the various stages of a process. We therefore suggest the following mea-sures culled from previous operationalizations found in the literature:
Ø The materials handling system is designed to link
every machine with every other machine on the shop floor.
Ø The materials handling system can move every
part for proper positioning and processing through the system.
3.4.2. Mobility
operationalizations of this element, we chose to use this as our measure. Hence, we offer the following:
Ø Inventory cost as a percentage of total production
cost.
4. Analysis and results
4.1. Method
The primary objective of our statistical analysis is to confirm whether the data set behaves as the theory
suggests it should. If the data did behave as theo-rized, it would provide evidence of the appropriate-ness of the operationalization of the flexibility con-struct. Three statistical techniques were used during the analysis. First, correlations between the items that operationalized each of the four dimensions of manufacturing flexibility were assessed. Our theoret-ical development suggests that in each category, we should find higher correlation among the variables
Ž
within each of the two elements ‘‘range’’ and
‘‘mo-.
bility’’ of a dimension and we should find lower correlations among variables across elements. The
Table 3
Measurement items and scales
Theoretical premise Measurement items Scale
Dimension Element Symbol Description Strongly Somewhat Neither Somewhat Strongly
agree agree agree nor disagree disagree disagree
Volume Range Vol1 Range of output volumes at which 1 2 3 4 5
flexibility the firm can run profitably is high
Mobility Vol2 Time required to increase or decrease 1 2 3 4 5
output volume is high
Vol3 Cost incurred to increase or decrease 1 2 3 4 5
output volume is high
Variety Range Vri1 A large number of different products 1 2 3 4 5
flexibility are produced by the manufacturing facility
Vri2 A large number of new products 1 2 3 4 5
produced every year
Mobility Vri4 The time required to introduce 1 2 3 4 5
new products is high
Vri5 The cost of introducing new 1 2 3 4 5
products is high
Process Range Pr1 A typical machine can perform 1 2 3 4 5
flexibility number of different operations without requiring a prohibitive amount of switching time
Pr2 A typical machine can perform a 1 2 3 4 5
number of different operations without requiring a prohibitive amount of switching cost
Mobility Pr3 Time required to switch from one 1 2 3 4 5
part-mix to another is high
Pr4 Cost required to switch from one 1 2 3 4 5
part mix to another is high
Materials handling Range Mat1 The material handling system id 1 2 3 4 4
flexibility designed to link every machine with every other machine on the shop floor
Mat2 The material handling system can move 1 2 3 4 5
every part for proper positioning and pro-cessing through the manufacturing facility
Mobility Mat3 Process inventory cost as a percentage 1 2 3 4 5
second step of the analysis required that we cross-check our results using Cronbach’s a. This would
allow us to further assess whether the items in each element ‘‘hang together.’’
As a final step of the analysis, we propose to test the match between the theoretical model and the data by undertaking a confirmatory factor analysis for each dimension to assess the extent of separation across the elements. The existence of high loadings on the appropriate factors and non-significant
load-Ž .
ing on the other factor s along with a high level of variation explained by the model would be a positive signal. The existence of low factor loading, multiple factor loadings, or low levels of explained variance in the model are indicators of poor ‘‘fit’’ between the data set and the theory.
4.2. Data set
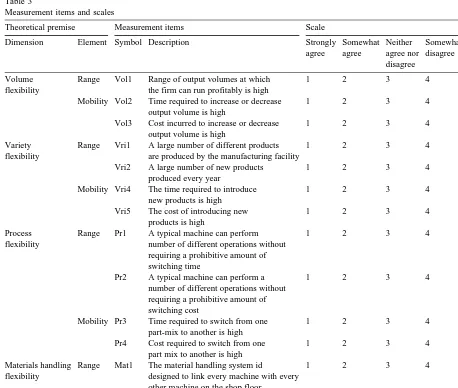
The current study is part of an ongoing stream of research that focuses on the manufacturing flexibility of firms. The database consists of 240 firms that responded to a pretested mailed questionnaire con-taining the items that related to manufacturing flexi-bility. Table 3 provides details on the items and the measurement scale. A 5-point Likert-type scale was used. Respondents were asked to circle the position on the scale that best represented their manufacturing function’s position relative to that of their competi-tors.
Firms were selected from the 1996 Directory of Texas Manufacturers, compiled by the Bureau of Business Research, in Austin, TX. Questionnaires were mailed to the CEO or Head of Operations at 995 firms in August, 1997. Two follow-up mailings were undertaken. The final response rate was 24.1%. To check for non-response bias, the sample was split into two groups: early and late respondents. A test for equality of means indicated no differences on three variables that were not part of the variables-of-interest. Specifically, we looked at the years that the respondent had been with the firm, and two
perfor-Ž
mance variables: Cost cost of production per unit
. Ž
output relative to the competition and quality
num-.
ber of customer complaints about product quality. We chose to include performance variables because we expect that they will eventually be important ‘‘dependent’’ variables in future research on
manu-facturing flexibility. In all three cases the results
Ž
were not significant significance levels were 0.22,
.
0.905, and 0.55, respectively . This suggests that late responses were not different from early responses, and it leads us to believe that non-response bias may not be a significant issue.
Our sample of respondents consisted primarily of senior level managers. There were 57 Presidents or CEOs, 76 General Managers or VPs of Operations, 45 Manufacturing Plant Managers, 27 manufactur-ingroperations managers and 35 other senior man-agers in the sample. A typical respondent had been with the firm for an average of about 14.5 years
Žstandard deviation 9.3 years , suggesting that they.
should be very knowledgeable about firm-specific issues. The SPSS statistical package was used to analyze the data set.
5. Results
Correlational analysis of all variables used in the study indicated no situations of multi-collinearity. As a precursor to our investigation of each manufactur-ing flexibility dimension, we felt it necessary to investigate the interdependence between the theoreti-cally-configured dimensions and elements of manu-facturing flexibility. If our theoretical developments are correct, the variable loadings on an eight-factor solution should be fairly representative of the eight-component theoretical taxonomy. The eight-factor solution that resulted from the data analysis is pre-sented in Table 4. We note that the solution that unfolded was identical to the one that was predicted. In addition, the eight-factor solution explained 87.4% of the variation. This provided encouraging prima facie evidence of the appropriateness of our instru-ment in operationalizing what we theorized to be relatively independent dimensions of manufacturing flexibility. In Section 5.1, we will assess the opera-tionalizations of each of the dimensions of manufac-turing flexibility.
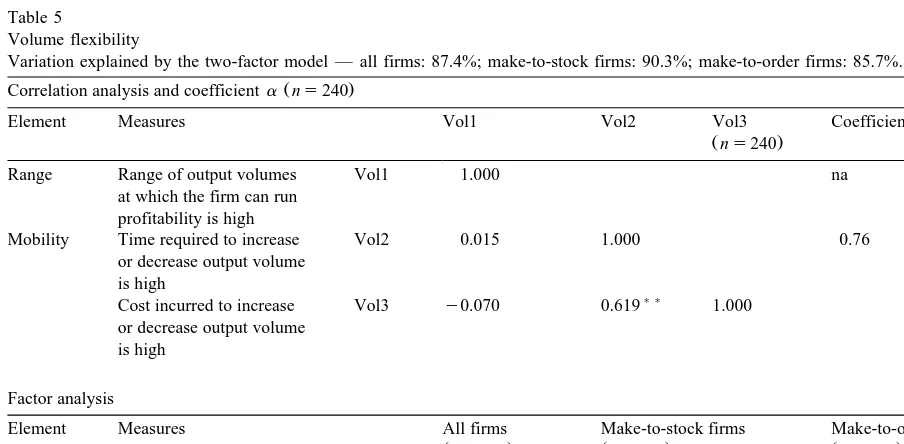
5.1. Volume flexibility
The correlation matrix for the items representing volume flexibility indicates significant correlation
Ž .
Table 4
Range and mobility elements of manufacturing flexibility in the data set
Ž .
Eight-factor solution: rotated component matrix variance explained: 87.4% . Type of flexibility variables Variable Factor loadings
that loaded on the factor 1 2 3 4 5 6 7 8
Process range Pr1 0.94
Pr2 0.94
Process mobility Pr3 0.93
Pr4 0.92
Variety mobility Vri3 0.91
Vri4 0.90
Materals handling range Mat1 0.91
Mat2 0.90
Volume mobility Vol2 0.87
Vol3 0.89
Variety range Vri1 0.85
Vri2 0.86
Materials handling mobility Mat3 0.99
Volume range Vol1 0.99
Ž .
exhibit good separation low correlation from the ‘‘range’’ item. Cronbach’s a for the two mobility
Ž .
items was at an acceptable level 0.76 for this type
Ž
of exploratory research Cronbach as for the scale
exceeded the 0.5 criterion generally considered
ade-.
quate for exploratory works .
Results from the factor analysis of the three items using the entire sample set of 240 observations are
Table 5
Volume flexibility
Variation explained by the two-factor model — all firms: 87.4%; make-to-stock firms: 90.3%; make-to-order firms: 85.7%.
Ž .
Correlation analysis and coefficienta ns240
Element Measures Vol1 Vol2 Vol3 Coefficienta
Žns240.
Range Range of output volumes Vol1 1.000 na
at which the firm can run profitability is high
Mobility Time required to increase Vol2 0.015 1.000 0.76
or decrease output volume is high
) )
Cost incurred to increase Vol3 y0.070 0.619 1.000
or decrease output volume is high
Factor analysis
Element Measures All firms Make-to-stock firms Make-to-order firms
Žns240. Žns101. Žns139.
Factor loadings Factor loadings Factor loadings
Range Vol1 0.998 0.993 0.999
Mobility Vol2 0.900 0.922 0.886
Vol3 0.897 0.907 0.885
) ) Ž .
Ž .
also presented in Table 5. As per Nunnally’s 1978 recommendation, only factor loadings that are greater than 0.40 are presented and used for analysis in this and subsequent factor analyses. The theorized
two-Ž .
factor model explained a significant portion 87.4% of the variation in the data set. In addition, factor loadings are high and mirror the theorized pattern. This suggests that it is appropriate to conceptualize the volume flexibility dimensions as being indepen-dent underlying elements. To further determine if the results are not sample-specific, we ran the factor analysis independently on two subsets of firms in the database. The first subsets consisted of 101 firms that were primarily ‘‘make-to-stock’’ businesses. The second subset consisted of 139 ‘‘make-to-order’’ businesses. The item in the questionnaire that al-lowed us to create the two sub-groups read: ‘‘Yours
Ž .
is predominantly a A Make-to-order business: Products are generally customized to customer
re-Ž .
quirements, or B Make-to-stock business: Products are made to standard specifications.’’ The results of the factor analysis for each sub-group were very
similar to those obtained for the entire set of 240
Ž .
firms Table 5 . This further supports the two-factor operationalization of volume flexibility.
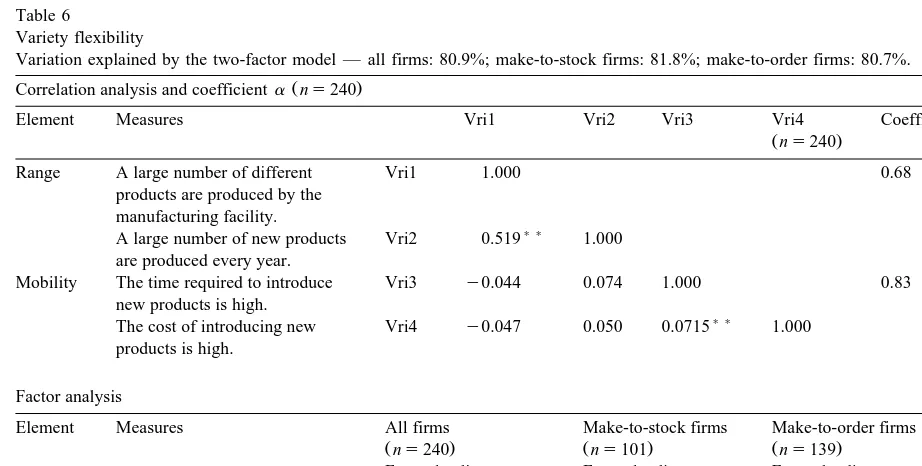
5.2. Variety flexibility
Correlation analysis indicated significant
correla-Ž . Ž
tions rs0.519 between the ‘‘range’’ items vri1
.
and vri2 . The coefficient a was 0.68. Results of the
Ž
correlation between the ‘‘mobility’’ items vri3 and
. Ž .
vri4 was also significant rs0.715 . Coefficient a
was a healthy 0.83. The correlation matrix for the four variety flexibility items is provided in Table 6. Results of the factor analysis of the four variety flexibility items using the entire sample set of firms are also presented in Table 6. The two-factor model explained 80.9% of the variation in the data. In addition the factor loadings were high, and fell out in the predicted pattern. Table 6 also provides results of the factor analysis run on the two subsets of
observa-Ž
tions 101 order firms and 139
make-to-.
stock firms . The similarities of factor loadings, and
Table 6 Variety flexibility
Variation explained by the two-factor model — all firms: 80.9%; make-to-stock firms: 81.8%; make-to-order firms: 80.7%.
Ž .
Correlation analysis and coefficienta ns240
Element Measures Vri1 Vri2 Vri3 Vri4 Coefficienta
Žns240.
Range A large number of different Vri1 1.000 0.68
products are produced by the manufacturing facility.
) )
A large number of new products Vri2 0.519 1.000 are produced every year.
Mobility The time required to introduce Vri3 y0.044 0.074 1.000 0.83
new products is high.
) )
The cost of introducing new Vri4 y0.047 0.050 0.0715 1.000
products is high. Factor analysis
Element Measures All firms Make-to-stock firms Make-to-order firms
Žns240. Žns101. Žns139.
Factor loadings Factor loadings Factor loadings
Range Vri1 0.872 0.866 0.881
Vri2 0.870 0.856 0.868
Mobility Vri4 0.925 0.935 0.917
Vri5 0.926 0.941 0.915
) ) Ž .
Ž
explained variance 81.8% for the make-to-stock
.
group and 80.7% for the make-to-order group con-firmed the two-factor model and further supports our operationalization of the variety flexibility dimen-sion.
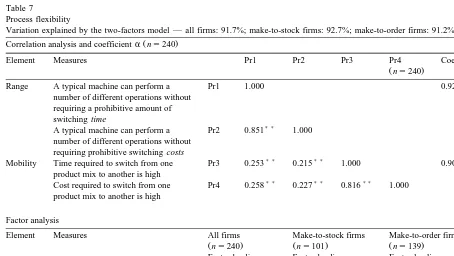
5.3. Process flexibility
Results of the correlation analysis have been pre-sented in Table 7. Correlations among the variables that were theorized to hang together are significantly higher than other bivariate correlations in the matrix
Žrs0.851 for the range items and rs0.816 for the .
mobility items . The coefficient as for the
corre-Ž
sponding elements support this finding 0.92 for
.
range items and 0.90 for the mobility items .
Ž .
Results of the factor analysis Table 7 confirm the appropriateness of the two-factor solution. The
Ž .
models full sample and subsets explained a high
Ž
level of the variation in the data sets 91.7% for the
full sample, 92.7% for make-to-stock firms, and
.
91.2% for make-to-order firms . In addition, appro-priately high loadings are observed on each factor that matched theorized relationship. This is true not only for the entire sample set of 240 observations but also for the sub-samples suggesting a rather robust instrument for measuring process flexibility.
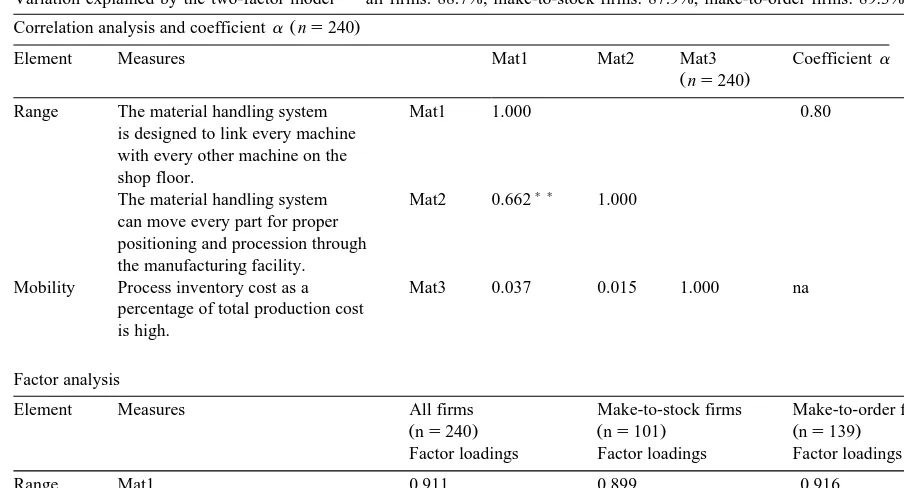
5.4. Materials flexibility
Ž .
We had identified two items mat1 and mat2 that operationalize the ‘‘range’’ of materials flexibility
Ž .
and one item mat3 that operationalize its ‘‘mobil-ity’’ component. Results of correlation analysis of these variables are presented in Table 8. As indicated in the table, intra-group correlations is high for the
Ž .
range items rs0.662 and the corresponding Cron-bach a is near 0.8 for the range items. In addition
the across-group correlations are low; suggesting good separation between the two sets of items.
Table 7
Process flexibility
Variation explained by the two-factors model — all firms: 91.7%; make-to-stock firms: 92.7%; make-to-order firms: 91.2%.
Ž .
Correlation analysis and coefficienta ns240
Element Measures Pr1 Pr2 Pr3 Pr4 Coefficienta
Žns240.
Range A typical machine can perform a Pr1 1.000 0.92
number of different operations without requiring a prohibitive amount of switching time
) )
A typical machine can perform a Pr2 0.851 1.000 number of different operations without
requiring prohibitive switching costs
) ) ) )
Mobility Time required to switch from one Pr3 0.253 0.215 1.000 0.90
product mix to another is high
) ) ) ) ) )
Cost required to switch from one Pr4 0.258 0.227 0.816 1.000
product mix to another is high Factor analysis
Element Measures All firms Make-to-stock firms Make-to-order firms
Žns240. Žns101. Žns139.
Factor loadings Factor loadings Factor loadings
Range Pr1 0.957 0.964 0.953
Pr2 0.951 0.961 0.944
Mobility Pr3 0.945 0.955 0.939
Pr4 0.944 0.940 0.947
) ) Ž .
Table 8
Materials flexibility
Variation explained by the two-factor model — all firms: 88.7%; make-to-stock firms: 87.9%; make-to-order firms: 89.3%.
Ž .
Correlation analysis and coefficienta ns240
Element Measures Mat1 Mat2 Mat3 Coefficienta
Žns240.
Range The material handling system Mat1 1.000 0.80
is designed to link every machine with every other machine on the shop floor.
) )
The material handling system Mat2 0.662 1.000 can move every part for proper
positioning and procession through the manufacturing facility.
Mobility Process inventory cost as a Mat3 0.037 0.015 1.000 na
percentage of total production cost is high.
Factor analysis
Element Measures All firms Make-to-stock firms Make-to-order firms
Žns240. Žns101. Žns139.
Factor loadings Factor loadings Factor loadings
Range Mat1 0.911 0.899 0.916
Mat2 0.910 0.897 0.916
Mobility Mat3 0.997 0.98 1.000
) ) Ž .
Correlations significant at the 0.01 level two-tailed .
Results of the factor analysis in Table 8 indicate that a two-factor solution explains 88.7% of the variation in the data set. In addition the factor load-ings reflect the pattern that was theorized. Similar factor loading patterns and similar levels of ex-plained variances were noted for the two subgroups
Ž
of firms 87.9% for the make-to-stock group and
.
89.3% for the make-to-order group . While the ex-plained variance was slightly higher for the make-to-order firms, the difference was marginal at best. Hence, we conclude that our operationalization of the two-factor model for materials flexibility is ap-propriate.
6. Discussion and conclusions
Ž .
Gerwin 1993 identified the task of operationaliz-ing the manufacturoperationaliz-ing flexibility construct as the single most important priority for researchers in this area. We have endeavored to answer Gerwin’s call
and to extend it a step further by empirically testing the operationalized dimensions of the manufacturing flexibility construct. The literature on manufacturing flexibility was reviewed and key theoretical develop-ments were isolated. We then developed a parsimo-nious conceptualization and operationalization of manufacturing flexibility dimensions that is grounded in the manufacturing flexibility literature. To assess the appropriateness of our taxonomy, we operational-ized and tested the taxonomy using empirical data from a sample set of 240 manufacturing firms. The value in our development lies in its ability to provide direction toward a generalizable taxonomy of manu-facturing flexibility dimensions.
configura-tionally different. The make-to-stock firms use man-ufacturing processes that tend to be configured as ‘‘line’’ or ‘‘continuous flow’’ while the make-to-order firms have manufacturing processes that tend to be ‘‘project-,’’ ‘‘job-shop-,’’ or ‘‘batch’’-ori-ented. Despite their configurational differences, both groups of firms were successfully characterized us-ing our operationalization of the manufacturus-ing flexi-bility construct. This lends support to the generaliz-ability of our operationalization across these types of manufacturing firms.
We believe that our taxonomy is useful in several respects. The parsimonious nature of the instrument makes it easy to implement. In addition, several researchers have noted that manufacturing flexibility may well be a critical competitive arena in the
Ž .
twenty-first century. Hayes and Upton 1998 argue that companies that use the operations function as an element in their competitive battles with other com-panies in their industry have discovered that such capabilities cannot be developed quickly. The exact organizational configuration that creates such flexi-bility has yet to be exactly determined. Greis and
Ž .
Kasarda 1997 suggest that a ‘‘collective enterprise’’ configuration might provide the broader range of resources, skills and technologies to adapt to market opportunities and provide the flexibility needed to compete effectively. Our conceptualization of manu-facturing flexibility may be useful to researchers and practitioners as they strive to take advantage of a better understanding of manufacturing flexibility.
Configurational research on manufacturing flexi-bility has not been profuse. We believe that the existence of our integrative taxonomy could stimu-late the search for robust manufacturing flexibility archetypes. Several important research questions ex-ist in this areas. For example, is it possible to isolate a set of manufacturing flexibility archetypes that are generalizable across most manufacturing firms? If not, are there sub-sets of firms within from which such typologies can be developed. We have noted that our taxonomy of manufacturing flexibility di-mensions is appropriate for both make-to-order and make-to-stock firms. But, will the flexibility archetypes also follow the same pattern? This is one of several ‘‘content’’ related questions that can be more readily addressed with an existing taxonomy of manufacturing flexibility dimensions.
The availability of a tested taxonomy of manufac-turing dimensions should be good news for re-searchers who investigate manufacturing flexibility ‘‘process’’ issues. For example, we do not fully understand the process of configuring manufacturing flexibility. While researchers have implicitly postu-lated a direct linkage between environmental uncer-tainty and manufacturing flexibility, new evidence from the field of organizational theory suggests that such a portrayal may be an oversimplification. Our taxonomy allows researchers to evaluate these and other process relationships at the dimensional level.
6.1. Study limitations
We would like to conclude by noting that this study is exploratory in nature. We do not present this research as the definitive work on manufacturing flexibility dimensions. Rather, we hope it moves us a few steps closer to a comprehensive, yet parsimo-nious model. When this is done, the resulting model might or might not have elements common to those that we have identified in this paper. For example, our review of the literature uncovered a variety of frameworks, each of which included a different set of manufacturing flexibility dimensions. Which one is the best? All of them can be defended on a theoretical basis. We have tried to simplify our model by identifying four and only four dimensions: volume, variety, materials handling, and process. We acknowledge that this could be seen by some as a limitation of our research. We believe, however, that it provides an effective springboard for further re-search in the area.
We recognize that further research is needed. Subsequent efforts might result in a more compre-hensive set of dimensions that are generalizable across a variety of industries. It is every researcher’s prerogative to question the appropriateness of any model specification.
indeed the case, it would lead to an increased level of parsimony in the operationalization of the flexibil-ity construct. Conversely, researchers may want to explore the alternate hypothesis that the operational-ization may be under-specified, and that there are, indeed, other significant dimensions that need to be included in the operationalization.
We have used an instrument that was constructed recently and could benefit from refinements. Two area may warrant further research. First, one might want to consider improvements on the single-item operationalizations of the range element of volume flexibility and the mobility item of materials flexibil-ity. Second, the range and mobility elements of the process construct did not show exceptionally good separation. This is probably due to the quality of the items used. We suggest that researchers attempt to develop items that provided better separation be-tween these two elements of process flexibility.
Although the sample set is rather large, all the firms are from one state. We do not believe that geographical location is a significant factor in this study. However, the reader may want to consider this aspect into account when interpreting our findings. Finally, although several studies have found that information provided by the manager of the ‘‘unit-of-analysis’’ in the firm is acceptable for this type of research, such information does reflects the subjec-tive judgement of the manager and should be treated with appropriate caution.
The operationalization that is developed and tested in this paper is an attempt to move toward a gener-ally acceptable taxonomy of manufacturing flexibil-ity dimensions. Although the results of our study are encouraging, we invite other researchers to further refine our operationalization and to delve deeper into its applicability in other organizational settings.
References
Abadie, J., Heran, C., Krasa, F., Llerena, P., 1988. Reduire les delais de reaction pour ameloirer la production. Rev. Fr. Gestion 67, 91–102.
Brill, P., Mandelbaum, M., 1989. On measures of flexibility in
Ž .
manufacturing systems. Int. J. Prod. Res. 27 5 , 747–756. Browne, J., Dubois, D., Rathmill, K., Sethi, S., Stecke, K., 1984.
Classification of flexible, manufacturing systems. FMS Mag., 114–117, April.
Carter, M., 1986. Designing flexibility into automated
manufactur-Ž .
ing systems. In: Stecke, K.E., Suri, R. Eds. , Proceedings of the 2nd ORSArTIMS Conference on Flexible Manufacturing Systems: Operations Research Models and Applications. Else-vier, Amsterdam, The Netherlands, pp. 107–118.
Chatterjee, A., Cohen, M., Maxwell, W., Miller, L., 1984. Manu-facturing flexibility: models and measurement. In: Proceedings of First Annual ORSArTIMS Conference on Flexible Manu-facturing Systems, Ann Arbor, MI. pp. 49–64.
Das, S., Nagendra, P., 1993. Investigation into the impact of flexibility on manufacturing performance. Int. J. Prod. Res. 31
Ž10 , 2337–2354..
Dixon, J., 1992. Measuring manufacturing flexibility: an empirical investigation. Eur. J. Oper. Res. 60, 131–143.
Falkner, C., 1986. Flexibility in manufacturing plants. In: Stecke,
Ž .
K.E., Suri, R. Eds. , Proceedings of the 2nd ORSArTIMS Conference on Flexible Manufacturing Systems: Operations Research Models and Applications. Elsevier, Amsterdam, The Netherlands, pp. 95–106.
Galbraith, C., Schendel, D., 1983. An empirical analysis of strat-egy types. Strategic Manage. J. 4, 153–173.
Gerwin, D., 1987. An agenda for research on the flexibility of manufacturing processes. Int. J. Oper. Prod. Manage. 7, 38–49. Gerwin, D., 1993. Manufacturing flexibility, a strategic
perspec-Ž .
tive. Manage. Sci. 39 4 , 395–410.
Greis, N., Kasarda, J., 1997. Enterprise logistics in the
informa-Ž .
tion era. Calif. Manage. Rev. 39 4 , 55–78.
Gupta, Y.P., Goyal, S., 1989. Flexibility of manufacturing sys-tems: concepts and measurements. Eur. J. Oper. Res. 43, 119–135.
Gupta, Y., Gupta, M., 1991. Flexibility and availability of flexible manufacturing systems: an information theory approach. Com-put. Ind. 17, 391–406.
Gupta, Y., Somers, T., 1996. Business strategy, manufacturing flexibility, and organizational performance relationships: a path analysis approach. Prod. Oper. Manage. 5, 204–233. Hambrick, D.C., McMillan, I.C., Day, D.L., 1982. Strategic
at-tributes and performance in the BCG matrix: a PIMS based analysis of industrial product businesses. Acad. Manage. J. 25, 510–531.
Hayes, R., Upton, D., 1998. Operations-based strategy. Calif.
Ž .
Manage. Rev. 40 4 , 8–25.
Jaikumar, R., 1984. Flexible Manufacturing Systems: A manage-rial Perspective. Harvard Business School, Boston, MA, WPa1-784-078.
Nunnally, J.C., 1978. Psychometric Theory. McGraw-Hill, New York, NY.
Olhager, J., 1993. Manufacturing flexibility and profitability. Int. J. Prod. Econ. 30–31, 67–78.
Sethi, A., Sethi, S., 1990. Flexibility in manufacturing, a survey. Int. J. Flexible Manuf. Syst 2, 289–328.
Swamidass, P.M., 1988. Manufacturing Flexibility, Monograph No. 2. Operations Management Association, Waco, TX. Upton, D., 1994. The management of manufacturing flexibility.
Ž .
Upton, D., 1995. What really makes factories flexible? Harv. Bus.
Ž .
Rev. 73 4 , 74–84.
Warnecke, H.J., Steinhilper, J., 1982. Flexible manufacturing systems, EDP-support planning: Application examples. In: Proceedings of the 1st International Conference on Flexible Manufacturing Systems. IFS Publications, Kempston, Bedford, UK, pp. 345–356.
Watts, C., Hahn, C., Sohn, B., 1993. Manufacturing flexibility:
Ž .
concept and measurement. Oper. Manage. Rev. 9 4 , 33–44. Wheelwright, S.C., 1984. Manufacturing strategy: defining the
Ž .