Full Terms & Conditions of access and use can be found at
http://www.tandfonline.com/action/journalInformation?journalCode=vjeb20
Download by: [Universitas Maritim Raja Ali Haji] Date: 11 January 2016, At: 18:56
Journal of Education for Business
ISSN: 0883-2323 (Print) 1940-3356 (Online) Journal homepage: http://www.tandfonline.com/loi/vjeb20
Self-graded homework: Some empirical tests of
efficacy
Mark Simkin & Debra Stiver
To cite this article: Mark Simkin & Debra Stiver (2016) Self-graded homework: Some empirical tests of efficacy, Journal of Education for Business, 91:1, 52-58, DOI: 10.1080/08832323.2015.1110554
To link to this article: http://dx.doi.org/10.1080/08832323.2015.1110554
Published online: 01 Dec 2015.
Submit your article to this journal
Article views: 16
View related articles
Self-graded homework: Some empirical tests of ef
fi
cacy
Mark Simkin and Debra Stiver
University of Nevada, Reno, Nevada, USA
ABSTRACT
Allowing students to grade their own homework promises many advantages. But can students perform such grading tasks honestly and accurately? Also, do such assessments vary by gender? To answer these questions, the authors analyzed the homework scores of 266 students in seven introductory programming classes. The statistical results were favorable to the hypothesis that students graded themselves fairly. Gender differences were slight, and more likely attributable to factors not connected with grading equity.
KEYWORDS collaborative learning; grading equity; self-assessment; self-grading
In collaborative learning (CL), students assume responsi-bility for some of the educational activities of their courses. Researchers suggest that CL positively influences student commitment to courses, positively influences attendance, and improves student performance (Kop-penhaver, 2006; Vander Schee, 2011). They also claim that CL can increase student engagement and the amount of learning (Dungan & Mundhenk,2006; Tere-zini, Cabrera, Colbeck, Parente, & Bjorklund,2001).
One interesting dimension of CL is a system that allows students to grade their own homework. This approach would seem to challenge instructors in courses requiring integrative analyses, theory syntheses, or inter-pretive skills. But, empirically, this system appears to be more viable in business courses when students receive grading rubrics and guidance in deducting points for common errors (Boud, 1989; Panadero & Jonsson,
2013). Similarly, such procedures may be more feasible where homework problems have unambiguous right answers (e.g., in accounting or the science, technology, engineering, and math disciplines).
Self-grading promises benefits to both students and instructors. One benefit to students is the potential to enhance interest and commitment to the learning goals of a course (Dungan & Mundhenk, 2006; Sadler & Good,
2006). If grading takes place on the day it is due, self-grad-ing also offers immediate feedback—a factor believed to positively influence learning and retention (Edwards,
2007). Student self-grading can also reinforce and deepen comprehension by helping students understand why one answer is wrong or another answer is better (Sadler &
Good, 2006). Empirical evidence also suggests that self-grading improves class attendance, makes the classroom experience a friendlier, more productive cooperative envi-ronment, and provides a shared sense of ownership for the learning process (Strong, Davis, & Hawks, 2004). Yet another benefit is the finding that self-grading can enhance student self-esteem and confidence, and there-fore increases positive attitudes about the efficacy of a course (McVarish & Solloway,2002). Finally, studies sug-gest that student self-assessment has the potential to transform a student’s view of education from a passive, external experience to an internalized value of lifelong self-learning (Dungan & Mundhenk,2006).
Self-grading also offers several potential advantages for instructors (Foyle, 1988).For example, Sadler and Good (2006) note that self-grading saves instructional grading time. Similarly, self-graded homework may increase the ability to assign more homework (a significant benefit in large classes) and assign homework that instructors might otherwise not require—a policy that Chickering and Gamson (1987) list as one of seven best practices in undergraduate education (see also Geide-Stevenson,
2009). Another potential advantage is that it may increase student engagement and transform students from passive listeners to active evaluators and motivated learners (Mahlberg, 2015; Stefani, 1992). In the lead author’s experience, in-class grading also potentially allows for novel solutions that online software might grade as incor-rect. Finally, self-graded homework has potential in online education, where the lack of grading resources limits what can be done by a single instructor (Ohland
CONTACT Mark Simkin [email protected] University of Nevada, Department of Information Systems, College of Business/026, Reno, NV 89557, USA.
Color versions of one or morefigures in this article are available online www.tandfonline.com/vjeb.
© 2016 Taylor and Francis Group, LLC
2016, VOL. 91, NO. 1, 52–58
http://dx.doi.org/10.1080/08832323.2015.1110554
et al., 2012). For example, Udacity is a major massive online open course provider that includes self-grading among its standard assessments (Boyde,2013).
Just because instructors can allow students to grade their own homework does not mean that instructors should adopt the policy. Again, not all university classes lend themselves to self-grading. Some students balk at such tasks, and some instructors feel that in-class tests adequately motivate students to do whatever work is nec-essary to master course materials. An additional concern is the amount of expertise required in the grading process itself. Several authors believe that students lack such capabilities (Andrade & Du, 2007; Kirby & Downs,
2007), but a growing body of empirical evidence suggests the opposite. Both Falchikov and Boud (1989) and Ste-fani (1992) report that most student marks agreed with those of their teachers. Similarly, Leach (2012) found no statistical difference between the mean student (self-assessed) grade and the mean teacher grade in her classes. Another concern is honesty. If instructors include homework when computingfinal course grades, there is incentive for students to be generous, or worse, to cheat (Andrade & Du, 2007; Kirby & Downs, 2007). Some experts believe that this explains why self-assessments are not more widely used in higher education (Kirby & Downs,2007; Thompson, Pilgrim, & Oliver, 2005). Sev-eral empirical investigations confirm this concern. Sadler and Good (2006) compared student homework evalua-tions with teacher grades for the same work in four of their general-science classes and found that lower per-forming students tended to inflate their own low scores. A study by Leach (2012) of 472 students made these same observations for lower achieving students, but also found that higher achieving students tended to underrate them-selves. A third study by Strong et al. (2004) of 480 students in their history classes also found statistical evidence of grade inflation: 57% of self-assessments resulted in A grades, compared to 31% of A grades when only teachers assigned grades. Finally, an anonymous survey by Edwards (2007) found that up to 20% of the students in a social statistics class reported they had actually seen other people cheating, even though up to 95% of these same stu-dents claimed that they, themselves, had never cheated.
There are several aspects of CL that have yet to be inves-tigated. One pertains to venue. Empirical studies of student self-assessment have mostly been conducted in the social sciences, while similar studies in engineering, computer science, or business are notable for their absence.
It is also currently not known whether the effective-ness or trustworthieffective-ness of self-assessments vary by gen-der. Past studies of student performance suggest that they do. For example, earlier research indicates that women tend to act more ethically than men (Keith,
Perrealt, Chin, & Keith, 2009; Kuo, Lin, & Hsu, 2007; Ones & Viswesvaran, 1998; Pierce, 2014; Wang & Cal-vano,2015). This difference in behavior could also apply when male and female students grade their own home-work—a question best answered empirically.
A new study
To examine these matters empirically, the lead author allowed the students in a set of introductory information systems (IS) classes in a public, western land-grant uni-versity business college to grade their own homework. The assignment due each day required students to create as many as five small programming applications in Visual Basic (Microsoft Corporation, Redmond, WA) from the end-of-chapter exercises in Schneider (2011,
2014). The number of homework sets varied each semes-ter, but was never less than 20. The experiment ran for seven consecutive semesters. At the start of each semes-ter, the instructor told students they were on the honor system, and also noted he would not challenge their self-assigned grades.
Each class began with students viewing a suggested solution to each problem and a table of maximum points to award for each exercise. Students could award them-selves partial credit for work if they wished, and some did so in as little as tenths of a point. The instructor also stressed the importance of completing the homework because learning how to use a procedural programming language was a primary learning objective of the class. For this reason, and to encourage students to do it, the unchallenged, self-graded homework counted for either 20% or 25% of a student’sfinal grade in each semester. We comment on this policy further in the Observations section.
Table 1provides statistics for the seven sample classes. Of 266 total students, 80 were women and 186 were men. The average total number of points for all homework points per class was slightly more than 255 points. Prob-lem point totals ranged from one to eight points. Most homework assignments included problems from end-of-chapter exercises and harder, bonus problems created by the instructor. Final homework scores were computed as total homework points (including bonus points) divided by total nonbonus points. Thus, if a student in Class 1 earned a total of 200 points, his or her homework score would be 200/192D104%.Table 1 displays the highest
potential homework scores for each class in row 7.
Some statistical tests
One way to examine the concern for overly-generous homework marks is to look at minimum scores. If
SELF-GRADED HOMEWORK: TESTS OF EFFICACY 53
students are charitable in their homework grading, then one might expect to see high minimum scores. Table 2
provides minimum homework scores for each of the seven classes in this study. The table suggests that, despite the ease with which students could achieve good homework scores, some participants still found ways to perform poorly on the homework. Men and women shared the lowest rankings, with men claiming this dubi-ous honor for four classes and women having the lowest scores for the remaining three classes. Again, these are statistics for those students who completed the entire course (see againTable 1).
Given how easy it was to earn 100% or more on the homework, it is also interesting to ask what proportion of students earned at least this grade. Across the entire sample, 97 students (37%) reached this amount, while 169 students (63%) had homework scores of less than 100%. In the opinion of the authors, it is difficult to describe the homework grading as generous in view of these statistics.
Table 2 focuses on the poorest performers in each class. What about homework performance for the rest of each class?Table 3provides homework averages for each of the seven classes, classified by gender. For all 266 stu-dents in the study, the overall class average for home-work was about 87%—again, a value that many would describe as noninflated given students could earn more or inflate what they had earned.
Across the entire sample of seven classes, men (aver-age homework score of 88.1%) performed better than women (average score of 84.5%). The difference was sta-tistically significant (p < .01). However, this superior
performance by men was not uniform across all clas-ses—in classes 1, 2, and 5, female students outperformed male students. Table 3 also suggests that, if students
inflated their homework scores, they were careful about it: both men and women averaged less than 100% in six of the seven classes.
Finally, it is useful to examine the range of homework scores in the sample data. If students contrived the values in their homework assessments, we would expect values to cluster around 100%. Alternately, if homework scores are legitimate, we would anticipate broader ranges. One way to examine this matter is to observe the sample data values falling in the interquartile range (IQR) or 25th to 75th percentile. Such an approach allows researchers to ignore outliers in the data sets and examine the middle values, which may be more representative of typical stu-dent performance.
Table 4 presents the lowest values in Quartile 2 and the highest value in Quartile 3. Thus, the 25th percentile value across classes ranged from a low of 43.98% to a high of 90.05%, while the 75th percentile value ranged from a low of 76.92% to a high of 120.31%. The differen-ces in these pairs of numbers are the range values reported in the last row ofTable 4. If students were inac-curate graders, the authors expected narrow ranges because weaker students tend to inflate their scores while stronger students tend to overpenalize themselves (Leach,2012; Sadler & Good,2006).
Table 4reports broad ranges that we felt were unchar-acteristic of dishonest behavior, but we also wanted to compare these results with a benchmark class in which the homework was graded by a professor. The authors used a prerequisite statistics class for the experimental classes discussed here as a comparative benchmark. Accordingly, the authors examined the aggregate home-work scores from three such statistics classes.
To perform the comparison, we scaled the student homework scores for each of the seven IS classes to
Table 2.Minimum homework scores for male and female stu-dents in each class.
Class 1 2 3 4 5 6 7 Entire sample
Men 10.4% 27.5% 29.6% 38.7% 27.2% 52.4% 56.1% 10.4% Women 84.9% 71.0% 8.7% 52.9% 64.0% 23.7% 13.2% 8.7% Entire class 10.4% 27.5% 8.7% 38.7% 27.2% 23.7% 13.2% 8.7%
Table 1.Selected class statistics.
Class 1 Class 2 Class 3 Class 4 Class 5 Class 6 Class 7
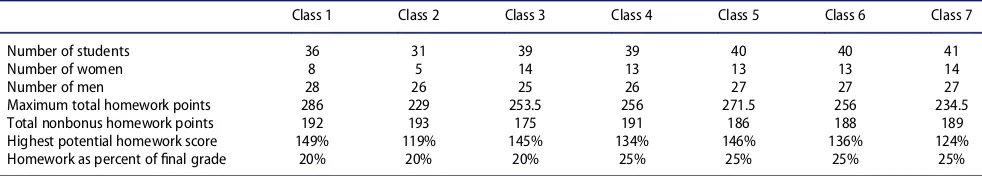
Number of students 36 31 39 39 40 40 41
Number of women 8 5 14 13 13 13 14
Number of men 28 26 25 26 27 27 27
Maximum total homework points 286 229 253.5 256 271.5 256 234.5
Total nonbonus homework points 192 193 175 191 186 188 189
Highest potential homework score 149% 119% 145% 134% 146% 136% 124%
Homework as percent offinal grade 20% 20% 20% 25% 25% 25% 25%
Table 3.Average homework scores for male and female students in each class.
Class 1 2 3 4 5 6 7 Entire sample
Men 101.3% 77.5% 69.9% 89.3% 84.3% 97.1% 94.9% 88.1% Women 113.4% 94.8% 53.1% 88.7% 94.0% 84.9% 82.8% 84.5% Entire class 104.0% 80.3% 63.9% 89.1% 87.5% 93.2% 90.8% 87.0%
100%, and then computed the comparative statistics shown in Table 5. The range for the IS classes were smaller inTable 5 than inTable 4because the scores in the latter table were scaled to 100% for comparative purposes.
As might be predicted, the means, medians, and modes differed between these two classes. By any mea-sure, the homework scores in the IS classes were more dispersed than those of the benchmark statistics classes. In the IS classes, the minimum score was lower, the sam-ple standard deviation waslarger, and the coefficient of variation of 29.2% was almost three times larger than the statistics class value of 10.3%.
As noted previously, the key statistic of interest to the authors was the interquartile range for the two classes. Again, the authors believe that evidence of generous stu-dent self-grading would include narrow ranges, while honest self-grading would result in the opposite. The computed IQR of 33.58% for the unscaled sample values and 25.2% for the scaled values suggest that there is sig-nificant dispersion in the homework scores. The statistics inTable 5confirm this belief: the IQR for the benchmark statistics classes was 13.5%—nearly half that of the experimental classes
We note that our choice of benchmark statistics classes here is an imperfect control group for the task at hand. Indeed, any alternate class taught by a different professor and on a different subject is easily challenged. On the other hand, almost all of the students taking the prerequi-site statistics classes also took the prerequiprerequi-site IS classes used in this study. Because of the independent grading, we also expected tofind greater dispersion in homework
distribution of these alternate classes and were surprised to find the opposite. Again, we infer that most students graded themselves fairly in the experimental classes.
A linear regression analysis
The final examinations in the IS classes were 50-ques-tion, multiple-choice tests that varied little from one class to another (the instructor collected test booklets at the end of each final exam).Table 6provides average-score statistics for these tests, summarized by gender.
If students had accurately and honestly graded them-selves, we would expect to see a significant relationship between homework performance andfinal exam perfor-mance. To test the relationship, the Pearson correlation coefficient was computed. For the sample data, this value was rD .326. The analysis confirmed a positive, signifi
-cant linear relationship with a t value of 5.61 (pD.0000).
In order to include gender as an explanatory variable, the authors estimated the regression coefficients of a lin-ear regression model that used final exam grade as the dependent variable and gender and total homework score as independent variables (for similar methodology, see Geide-Stevenson,2009; Grove & Wasserman,2006). The estimated coefficients for the linear regression (all significant atpD.000) were:
Final examD.057 ¡ .073 * Gender + .191 * Homework (tD17.01) (tD3.63) (tD5.51)
AdjustedR2D.142,FD23.02.
The homework coefficient showed a statistically sig-nificant positive, relationship with final exam scores. If students cheated on their homework grading, one might expect this relationship to be less significant and have less predictive capability. The estimated gender coeffi -cient of ¡.073 means, on average, women scored about
7% lower on theirfinal examinations than did men. This result contrasts with Picou (2011) who also tested gender
Table 4.Homework ranges for the second and third quartiles.
Class: 1 2 3 4 5 6 7 Entire sample
Quartile 2 (low) 90.05% 60.36% 43.98% 71.20% 71.51% 80.32% 74.07% 71.20%
Quartile 3 (high) 120.31% 106.74% 76.92% 104.19% 102.15% 105.32% 110.58% 104.78%
Range 30.26% 46.37% 32.94% 32.98% 30.65% 25.00% 36.51% 33.58%
Table 5.Comparative homework statistics for the students taking the study is classes versus a prerequisite statistics class.
IS STAT
Count (n) 266 103
Mean 67.1% 86.8%
Sample variance 381.2% 78.3%
Sample standard deviation 19.5% 8.9%
Coefficient of variation 29.2% 10.3%
Minimum 7.0% 64.8%
Table 6.Average final examination scores for male and female students in each class.
Class 1 2 3 4 5 6 7 Entire sample
Men 73.4% 77.4% 77.4% 76.6% 75.6% 71.9% 72.6% 75.0% Women 72.8% 70.8% 63.7% 67.1% 66.2% 59.2% 73.6% 67.6% Entire class 73.3% 76.4% 72.5% 73.4% 72.5% 67.8% 72.9% 72.7%
SELF-GRADED HOMEWORK: TESTS OF EFFICACY 55
as a possible predictor of test performance but found no statistical significance for this variable.
The adjustedR2value of .142 indicates that our inde-pendent variables collectively explained less than 15% of the variance of the dependent variable. While such results are commonly observed in similar behavioral models, its low magnitude suggests that much of what explains student achievement on thefinal examinations in this class is probably attributable to other factors not included in our model (e.g., prior programming experi-ence or native intelligexperi-ence). We speculate that using a surrogate variable for intelligence such as grade point average, even if self-reported, might have increased this value (Bacon & Bean, 2006). Additional variables that might also affect test performance include commitment to or interest in the class, work ethic, study skill abilities, or test anxiety.
We note that some of the questions on thefinal exam-ination required students to apply what they should have learned—for example, by identifying an error in unfamil-iar code segments or selecting the correct code sequence for a task from a set of possibilities. These questions were probably harder than those requiring simple explanations of terminology, and are likely to especially affect those students who mostly rely on rote memoriza-tion when preparing for tests. None of these variables were included in the study but are potential criteria for future research.
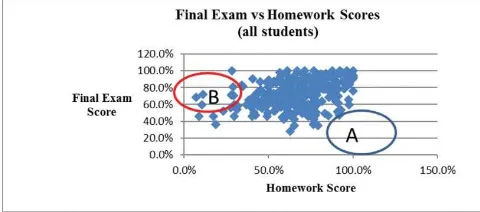
Finally, we looked for potential outliers, which we expected tofind in the lower, right portion of Figure 1
marked A—representing students with high homework scores and low exam scores. We didfind outliers, but not where expected. Most were in area B—an area character-ized by low homework scores but highfinal-exam scores. How could this be? Examining them individually, the instructor identified area-B students as capable students who simply were not inclined to do much homework. For example, some of them were computer science majors taking this (business) course as a casual elective. In total, there werefive such students, whose individual priorities were not completely known to the authors.
Observations and additional comments
Four matters worthy of further comment are (a) the questionable policy of counting self-graded homework as a sizable percentage of a student’sfinal grade, (b) the sta-tistical viability of data that have the potential to fall within narrow ranges, (c) the appropriateness of student self-grading in programming classes, and (d) the mechanics of in-class grading.
The lead author’s experience was that counting self-graded homework in thefinal course grade was not as risky as he originally feared. The practice began when students complained that the homework was a lot of work and wanted credit for it. The disbursed homework scores and perhaps student realization that large disconnects between homework and in-class exam scores were likely to attract further inquiry made this policy less of a concern. We also note that the median age for students at this university was 26, suggesting a more mature student body.
With regard to the narrow-range problem, a potential concern in statistical analyses is a possible lack of vari-ability in the data for independent variables in linear regression work. This is a problem because low variabil-ity in the sample data makes it difficult to estimate regression parameters with any statistical degree of preci-sion. As noted earlier, and at least for the sample used here, this fear was (surprisingly) unrealized. In class 1, for example, aggregate homework scores ranged from a low of 10.4% to a high of 149.0%. Each of the other clas-ses displayed similarly wide ranges. The scatter diagram inFigure 1suggests that low variability was not an issue.
In the subject domain of the present study, there are usually several methods for achieving a given program-ming objective, and perhaps the most common question from students during the grading portion of a given class period was the appropriateness of alternate solutions. In many cases, we found that students used novel, and often creative, approaches to solve homework problems. In our opinion, the ensuing class discussions about the viability of such alternate tactics were one of the most educational portions of the course—especially for the instructor!
Finally, we make several brief qualitative observations about the mechanics of the self-grading process itself. First, we note that in-class grading takes valuable class time—an opportunity cost that some instructors may not wish to incur. Second, we confirm what others have already noted about the psychological impact of self-grading. Comments on end-of-semester class evaluations from students sug-gested that most liked the process, appreciated the vote of confidence in their integrity, and believed they were honest graders. We also note that, when the grading happens at the beginning of class, the process encourages students to come to class prepared and on time.
Figure 1.A scatter diagram of the sample data.
Caveats and directions for future research
There was little evidence for student fudging on home-work grading in the sample data of the present study. Nonetheless, the absence of statistical evidence for grade misrepresentation does not necessarily mean that none occurred. One caveat, therefore, is the possibility that generous self-grading occurred but that our statistical analyses failed tofind it.
We also recognize that, for the study classes at hand, students could obtain help from such outside sources as parents, students from prior classes, or each other. In addition, we observed that the principal debugging tech-nique of some students was trial and error, resulting in little understanding but (after a sufficient number of attempts) successful programs. The end result was com-pleted homework deserving of high grades for achieve-ment, but perhaps with little comprehension. This is an important concern for future research, inasmuch as most prior studies of student assessments have used achieve-ment as a surrogate for comprehension. This may also explain why our own regression analysis did not yield better results. For this reason, future researchers may prefer to use independent tests of student comprehen-sion, rather than parallel grading by teachers, when mea-suring the effectiveness of self-grading processes.
We also note that, in the present study, students used a grading rubric and sometimes, also asked the instructor about points to deduct for partially-right answers. We realize that not every class easily accommodates such practices or that every instructor might feel that class time is best used for such tasks. Either way, student self-grading becomes more problematic without such items.
Finally, we note that the data for this study came from the classes of one instructor and at one university. While we feel that the students in our sample were typical of those at alternate institutions, we recognize that this fac-tor affects the generalizability of our results. Future research would be useful not only to replicate this experi-ment, but also tofind superior methods of implementing self-grading processes.
Summary and conclusions
One dimension of collaborative learning is a policy that allows students to grade their own homework. The pres-ent study used the aggregate homework andfinal exami-nation scores from 266 students taking seven entry-level programming classes to examine the efficacy of this pol-icy. Despite the opportunity for extra credit, we found many examples of low homework scores, imperfect homework averages, and wide homework ranges in each class. Similarly, a comparison of the homework scores of
the students in the experimental IS classes with those of a prerequisite statistics class found that the self-graded scores were more dispersed, and thus less likely to be contrived scores.
Using a linear regression model, we found a positive, statistically significant relationship between homework and the student’s final examination, suggesting that, if students misrepresented their homework scores in any substantive way, it was not statistically identifiable. If stu-dents had been generous with their home grading, we expected to find students with high homework scores but low exam scores. Instead, we found the opposite.
Gender did not emerge as a distinguishing factor in our analyses. In our linear regression, this variable was statistically significant, but of small effect. Our overall conclusion is that, within the confines of our study, both male and female students can and do grade their home-work honestly.
References
Andrade, H., & Du, Y. (2007). Student responses to criteria-referenced self-assessment. Assessment & Evaluation in Higher Education, 32,159–181.
Bacon, D. R., & Bean, B. (2006). GPA in research studies: An invaluable but neglected opportunity.Journal of Marketing Education, 28,35–42.
Boud, D. (1989). The role of self-assessment in student grading.
Assessment and Evaluation in Higher Education, 14,20–30. Boyde, E. (2013, March 11). Massive open online courses:
Time and a little money are a worthy investment.Financial Times. Retrieved from http://www.ft.com/cms/s/2/c101d4cc-800f-11e2-96ba-00144feabdc0.html#axzz2Y6TGqKVE. Chickering, A. W., & Gamson, Z. F. (1987). Seven principles
for good practice in undergraduate education.AAHE Bulle-tin, 39(7), 3–7.
Dungan, A. T., & Mundhenk, L. G. (2006). Student self-assess-ment: a tool for engaging management students in their learning.Teaching and Learning, 3,54–73.
Edwards, N. M. (2007). Student self-grading in social statistics.
College Teaching, 55,72–76.
Falchikov, N., & Boud, D. (1989). Student self-assessment in higher education: a meta-analysis. Review of Educational Research, 59,395–430.
Foyle, H. C. (1988, January).Homework: Suggestions for educa-tors. Paper presented at the meeting of the Hutchinson Chapter of Phi Delta Kappa, McPherson, KS. Retrieved from http://eric.ed.gov/?id=ED294504
Geide-Stevenson, D. (2009). Does collecting and grading homework assignments impact student achievement in an introductory economics course? Journal of Economics and Economic Education Research, 10(3), 3–14.
Grove, W. A., & Wasserman, T. (2006). Incentives and student learning: A natural experiment with economics problem sets.American Economic Review, 96,447–452.
Keith, N. K., Perrealt, H. R., Chin, M., & Keith, M. (2009). The effect of gender on the importance of business ethics and managerial decisions: A student perspective.Delta Pi Epsi-lon Journal, 51,125–136.
SELF-GRADED HOMEWORK: TESTS OF EFFICACY 57
Kirby, N., & Downs, C. (2007). Self-assessment and the disadvan-taged student: Potential for encouraging self-regulated learning.
Assessment & Evaluation in Higher Education, 32,475–494. Koppenhaver, G. D. (2006). Absent and accounted for:
Absen-teeism and cooperative learningDecision Sciences Journal of Innovative Education, 4,29–49.
Kuo, F., Lin, C., & Hsu, M. (2007). Assessing gender differen-ces in computer professionals’self-regulatory efficacy con-cerning information privacy practices.Journal of Business Ethics, 73,145–160.
Leach, L. (2012). Optional self-assessment: Some tensions and dilemmas. Assessment & Evaluation in Higher Education, 37,137–147.
Mahlberg, J. (2015). Formative self-assessment college classes improves self-regulation and retention infirst/second year community college students.Community College Journal of Research and Practice, 39,772–783.
McVarish, J., & Solloway, S. (2002). Self-evaluation: Creating a classroom without unhealthy competitiveness.Educational Forum, 66,253–260.
Ohland, M. W., Loughry, M. L., Woehr, D. J., Bullard, L. G., Felder, R. M., Finelli, C. J.,…Schmucker, D. G. (2012). The comprehensive assessment of team member effectiveness: Development of a behaviorally anchored rating scale for self-and peer evaluation.Academy of Management Learning & Education, 11,609–630.
Ones, D. S., & Viswesvaran, C. (1998). Gender, age, and race differences on overt integrity tests: Results across four large-state job data sets. Journal of Applied Psychology, 83,
35–42.
Panadero, E., & Jonsson, A. (2013). The use of scoring rubrics for formative assessment purposes revisited: A review. Edu-cational Research Review, 9,129–144.
Picou, A. (2011). Does gender, GPA or age influence test performance in the introductory finance class? A study
using linked questions. Review of Business Research, 11
(4). Retrieved from http://www.freepatentsonline.com/ article/Review-Business-Research/272616380.html Pierce, J. R. (2014). Sex & gender in ethical decision making: A
critical review and recommendations for future research.
Academy of Management Annual Meeting Proceedings, 2014,977–982.
Sadler, P. M., & Good, E. (2006). The impact of self-and peer-grading on student learning. Educational Assessment, 11,
1–31.
Schneider, D. I. (2011).An introduction of programming using visual basic 2010. Boston, MA: Prentice Hall.
Schneider, D. I. (2014).An introduction of programming using visual basic 2012. Boston, MA: Prentice Hall.
Stefani, L. A. (1992). Comparison of collaborative self, peer and tutor assessment in a biochemistry practical. Biochemical Education, 20,148–151.
Strong, B., Davis, M., & Hawks, V. (2004). Self-grading in large general education classes. College Teaching, 52,
52–57.
Terezini, P. T., Cabrera, A. F., Colbeck, C. L., Parente, J. M., & Bjorklund, S. A. (2001). Collaborative learning vs. lecture/ discussion: Students’ reported learning gains. Journal of Engineering Education, 90,123–130.
Thompson, G., Pilgrim, A., & Oliver, K. (2005). Self-assess-ment and reflective learning for first-year geography stu-dents: A simple guide or simply misguided? Journal of Geography in Higher Education, 29,403–420.
Vander Schee, B. A. (2011). Let them decide: student perfor-mance and self-selection of weights distribution.Journal of Education for Business, 86,352–356.
Wang, L., & Calvano, L. (2015). Is business ethics education effective? An analysis of gender, personal ethical perspec-tives, and moral judgment.Journal of Business Ethics, 126,
591–602.