Todd L. Ely is assistant professor in the School of Public Affairs at the University of Colorado Denver, where he teaches courses on governmental budgeting and account-ing, public fi nance, and local government management. His research addresses the fi nancing of state and local public services, education fi nance and policy, and public and nonprofi t fi nancial management.
E-mail: [email protected]
Benoy Jacob is assistant professor in the School of Public Affairs at the University of Colorado Denver and director of the Center for Local Government Research and Training in the Buechner Institute for Governance. His research addresses issues in local politi-cal economy.
E-mail: [email protected]
Public Administration Review, Vol. 73, Iss. 1, pp. 38–48. © 2012 by The American Society for Public Administration. DOI: 10.111/j.1540-6210.2012.02594.x.
Todd L. Ely Benoy Jacob
University of Colorado Denver
Th is article explores public sector responsiveness to voter-led initiatives, specifi cally, the degree to which public managers attempt to lock in resources before they are
constrained by a particular initiative. Th e authors posit
that such behavior, which they term “beating the clock,” is a function of the potential impact of the proposed initiative, the degree to which managers can react to the initiative’s central issues, and the perceived likelihood of passage. Although scholars have explored diff erent responses to voter-led initiatives, this particular form of strategic behavior has yet to be studied. Using longitu-dinal data on public debt issuance, hypotheses are tested in the context of a reform proposed through the initia-tive process in Colorado in 2010. Results show that the number of debt issues increased by roughly 150 percent in advance of a potentially binding election, indicating the ability to preempt formal initiative eff orts in certain policy areas.
I
n this article, we consider the strategic response of state and local governments to citizen-led initiatives. Th e extant literature has focused on two such responses: direct and indirect. Th ese responses are distinguished by the observed tim-ing of public sector behavior.Direct responses occur after an initiative has been passed. In such instances, public offi cials have been found to either “work around” the imposed constraints (see, e.g., Levine, Rubin, and Wolohojian 1981; Matsusaka 1995; Mullins 2004) or simply ignore them
(Gerber et al. 2001). In contrast, indirect responses occur before any particular initiative has been placed on the ballot. Political actors, then, respond to the
threat of initiatives (see, e.g., Gerber 1996, 1998;
Lupia and Matsusaka 2004). In this article, we extend the scholarship on these indirect eff ects. More precisely, we consider the strategic behavior of public offi cials after an initiative is placed on the ballot but before it has been voted on. Th us, we
propose an additional form of indirect response in which public managers may take actions to lock in policy outcomes before voters have time to (dis) approve the initiative.
Th e proposed managerial response is driven by three key factors: (1) the potential negative impact of the initiative on the government’s capacity; (2) the ability of the government to respond, given the nature of the proposed initiative; and (3) the perceived likelihood of the initiative being passed (i.e., the credibility of the threat). We test the likelihood of this response in the context of a recent reform proposed through the initiative process in Colorado.
In November 2010, Colorado voters were presented with two amendments to their state constitution— Amendments 60 and 61—that would have severely curtailed the ability of state and local governments to raise revenue and issue debt, respectively. Combined with the fee-reducing Proposition 101, these ballot items were labeled the “Bad Th ree” by their vocal opponents. In the early stages of the campaign, there was a perception that the initiatives might pass, yet
all three ultimately failed at the ballot box. Th is case provides a unique setting in which to test our claim that public manag-ers will respond to the mere possibility of a specifi c initiative being passed. Using longitu-dinal data on public debt issu-ance, both in Colorado and in neighboring states, we estimate the responsiveness of public managers during the initiatives’ active campaign. Our fi ndings support the expectation of a managerial response to the threat of policy change, specifi cally, a signifi cant and large spike in debt issuance in the months preceding the election.
Our article off ers two key contributions: First, since 1904, almost 60 percent of the initiatives proposed in the United States have failed.1 Scholars have paid little
Beating the Clock: Strategic Management under the Th
reat
of Direct Democracy
Th
is case provides a unique
setting in which to test our
claim that public managers will
respond to the mere
possibil-ity of a specifi c initiative being
key resources (Denhardt 1985; Dodge and Eadie 1982; Eadie 1983). Clearly, diff erences in the availability of such resources will lead to variation in the quality and effi ciency of public service provi-sion (Jacob et al. 2008; Ziblatt 2008). Th us, it stands to reason that initiatives posing a greater threat to available resources will lead to greater actions to protect existing resources or garner new ones.
Second, we argue that the likelihood of a public manager pursu-ing resources in advance of the election will depend on the degree to which public managers can react quickly to the issues central to a proposed initiative. Th is, of course, is a function of the characteristics of the particular initiative, as a manager’s discre-tionary authority will vary across issues (Brown and Potoski 2006; Whorton and Worthley 1981). In our particular analysis, for example, we focus on the strategic behavior around Amendment 61 because, unlike the resources targeted in Amendment 60 (property taxes) and Proposition 101 (fees), public managers do exercise some discretion over the issuance of debt and can issue certain types of debt relatively quickly (i.e., over the campaign period).
Finally, the beat-the-clock response will be predicated largely on the perceived likelihood of a proposed initiative passing, as managers must sense that the threat of new constraints is real.4 It is quite
pos-sible that an initiative has enough support to get on the ballot but not enough for it to pass. In this case, there is less reason to react. Th us, we anticipate a strong eff ort to secure resources in advance of an election primarily if the initiative is thought to have wide support or if there is signifi cant uncertainty regarding the level of support. Th at said, the magnitude of the response may also depend on the degree to which diff erent public managers are risk averse and unwilling to accept even low levels of risk associated with a ballot item’s passage. Managers may also use a low-probability ballot threat as an excuse for engaging in an already desired policy response. In short, government responses may still be observed even if the ballot initiative is not particularly credible.
Our argument leads to the following hypothesis: If a proposed initiative is deemed credible and is likely to constrain resources over which public managers have discretion, then public managers may try to secure these resources prior to the election. Implicit in this hypothesis is that managerial behavior (i.e., eff orts to secure resources) will vary during the campaign period as support for an initiative waxes and wanes. We test the hypothesis in the context of a recently proposed citizen initiative in Colorado.
Colorado’s Amendment 61
On the November 2010 ballot, Colorado voters were presented with Amendments 60 and 61 and Proposition 101. Th ese initiatives aimed to constrain local property taxes, limit the issuance of debt, and constrain state and local fees, respectively. Th us, their passage would have severely curtailed the ability of state and local governments to raise rev-enue and issue debt. Our analysis is focused on the public sector’s response to Amendment 61. We begin by briefl y elaborating some of the nuances of public debt issuance, particularly in the state of Colorado.
heed to the impacts of failed initiatives on the behavior of manag-ers and policy makmanag-ers. Our work demonstrates that the anticipated outcomes of an initiative can have important impacts on the subse-quent operations of public organizations, in particular, by locking in resources that are not immediately required. Second, to date, scholars of public management have largely ignored the political process; most management models do not explicitly account for the way in which public managers deal with political pressures (Bryson, Berry, and Yang 2010). In contrast, we consider managerial behavior within an explicitly political process.2
We proceed by fi rst situating our argument within the broader lit-erature on strategic management and direct democracy. Second, we describe the Colorado ballot item that defi nes the empirical context for this study. Th ird, we outline our empirical strategy and provide an analysis of government debt issuance in the period leading up to the vote. We conclude with a discussion of the implications of our study.
Managerial Responsiveness to Direct Democracy
Strategic management arrived in the United States in the mid-1980s. Since then, a large proportion of American local govern-ments have voluntarily adopted strategic planning or management practices (Poister and Streib 1994). Fundamental to such practice is the eff ective management of the external environment. Direct democracy, in the form of citizen-led initiatives, represents an important challenge to this objective.3
Because initiatives are instituted by a petition from a suffi cient number of citizens, greater scope exists for previously unrecognized stakeholders to abruptly exert political infl uence (Budge 1971) outside the normal policy-making process. Consider the following scenario: A citizenled initiative is put on the ballot that will signifi -cantly constrain the resources available for the provision of public goods and services, which must still be provided after the constraints are imposed. Not having anticipated such proposed constraints, legislators failed to adopt similar, though less restrictive, legisla-tion ex ante. Public managers can wait to see whether the ballot is passed and, if it is, they can either (1) do their best to provide public services within the new constraints or (2) fi nd a way around the imposed constraints. We argue that there is a third, yet unexplored, option, which we term “beating the clock.”
Assuming that public managers prefer more resources to less, it seems unlikely that they will wait to see whether an initiative passes before taking action, particularly if they have
some control over those resources. We argue that public offi cials will respond proactively to secure resources before new restrictions are actually voted on—that is, they will try to beat the clock. We propose that three factors drive such a response: (1) the potential impact of the initiative, (2) the government’s ability to respond, and (3) the credibility of the threat.
First, the likelihood that the organization preempts the initiative will be related to its potential impact. Fundamental to a manager’s ability to provide public services is the ability to secure and manage
We argue that public offi
cials
will respond proactively to
secure resources before new
restrictions are actually voted
on—that is, they will try to beat
Th us, the early eff orts at information dissemination were largely oriented around “defi ning” the impacts of the initiatives. More precisely, between December 2009 and approximately the end of March 2010, it was made clear that the initiatives would have a det-rimental impact on the public fi nances if passed. At that time, the issue for public managers would have been, what is the likelihood that the initiatives will pass, come election time? Th is information, in the form of public opinion polls, would not start to emerge until the more public phase of the campaigns in late summer and early autumn of 2010.
Press coverage of the ballot items in the state’s major newspaper, the
Denver Post, illustrates that public visibility peaked in September
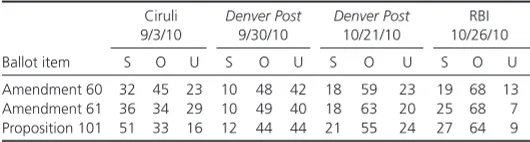
and October, the two months preceding the election (see fi gure 1). In early September, it was reported that Amendment 61 had the highest support of the three ballot items, at 57 percent positive, based on internal polling by opponents (Gardner-Smith 2010). Four publicly released polls soon followed to gauge public sentiment on each of the proposed ballot items. Th e results of those polls are summarized in table 1, which presents the percentage of respond-ents who supported (S), opposed (O), and were undecided (U) on the initiatives. In early September, one poll suggested that the outcome hinged on undecided voters, but by the end of the month,
the Denver Post poll suggested that there was very little support for
the measures. By mid- to late October, strong popular opposition to the ballot items had materialized.7
Public managers have discretion in (1) refunding outstanding debt, (2) issuing non–general obligation debt with dedicated revenue sources, (3) determining the timing of issuing previ-ously voter-approved general obligation debt, and (4) schedul-ing referenda to pursue voter approval of new general obligation debt.5 While revenue bonds may avoid voter approval, they still
typically require approval from elected offi cials and the comple-tion of a feasibility study in order to secure a bond rating (Vogt 2004, 186). Th e time needed to issue debt varies dramatically by the particulars of the borrowing, including the complexity of the issue, current market conditions, market familiarity of the issuer, and existing relationships with fi nancial intermediaries. Despite such hurdles, the credit rating process averages three or four weeks, with some additional time for fi rst-time issuers (Vogt 2004, 226); thus, it is feasible that public agencies could com-fortably issue debt between the certifi cation of Amendment 61 and the election. Of course, the fact that they can act does not suggest that they will act. Two other factors, which are central to our argument, provide further insight into when we expect public offi cials to act.
A second factor in our argument is the degree to which an initia-tive is seen as signifi cantly constraining the available resources. Amendment 61 was aimed at limiting the issuance of debt. It would have banned the state of Colorado from issuing any form of debt, and it would have required all local government debt to be approved through November elections, in addition to impos-ing new constraints on the maximum amount to be borrowed. Th e potential impact was not inconsequential. For example, the borrow-ing potential of Arapahoe County, the state’s third-largest county (located adjacent to the city and county of Denver), would have been reduced from $1.9 billion to $780 million (Bell Policy Center 2010). Th us, we suspect that the impacts of this initiative would be seen unfavorably and would have provided an incentive to public managers to proactively secure resources.
Th e fi nal factor in our argument is the credibility of the threat. By “credibility,” we are referring to the perceived likelihood that the proposed initiative will pass when it is put before the electorate. For our analysis, we need to clearly articulate whether and when, during the campaign period, public offi cials perceived that the ballot item was credible. A brief summary of the campaign timeline will shed some light on this issue.
First, the ballot items received Statements of Suffi ciency from the Colorado Secretary of State’s offi ce in early December 2009. Almost immediately, the detrimental impacts of the proposed items were identifi ed. For example, a local research and advocacy group issued a preliminary analysis of the ballot items, while in mid-February 2010, a law fi rm that serves as bond counsel to many Colorado governments issued a client advisory highlighting “some of the practical steps that governments may choose to take between now and November 2010 to be prepared if one or more of the initiatives is approved” (Sherman & Howard LLC 2010). A few months later, another law fi rm produced a memorandum analyzing the potential impacts of the ballot items, noting that, if passed, their interpreta-tion “is likely to play out in the courts for years and, while it does, could severely limit the ability of Colorado governments to fi nance public projects in the capital markets” (Kutak Rock LLP 2010).6
0
Note: News coverage was determined with multiple searches of the Denver Post using LexisNexis Academic and the search terms “Amendment* and 61 and 60 and 101” between November 1, 2009, and October 31, 2010.
Figure 1 Monthly Instances of Ballot Item Coverage in the Denver Post
Table 1 Polling Support Percentages by Poll, Date Reported
Ballot item
Note: “S” represents a response supporting the ballot item, “O” opposes, and “U” is undecided. Although the exact wording of the surveys varies, these categories track the general sentiment across surveys.
the particular state and t is the month of issuance. Th e independ-ent variable of interest, Th reats,t, is a dichotomous indicator of the threat period. Following the timeline developed earlier, it is operationalized in a number of ways. Our preferred specifi cation narrowly defi nes the threat period as the two months (September and October 2010) that began with the fi rst public polling for the amendment and ended when the threat, as refl ected in the polls and the ballot box, dissipated (the election on November 2, 2010). Alternative specifi cations use the three-month period preced-ing the election (August, September, and October 2010) and the four-month period surrounding the election (September through December 2010).
Th e demand for debt depends on both the characteristics of the issuer and the current debt market. Th e model includes state fi xed eff ects, υs, to control for time-invariant state characteristics that are expected to either promote or inhibit debt issuance. For example, neighboring sample states have relatively stable but vastly diff erent numbers of governments, ranging from 599 in Utah to 3,931 in Kansas (U.S. Census Bureau 2008). A state with a large number of governments will have a larger number of debt issues, all else being equal.
Th e state fi xed eff ects implicitly capture whether a state is a high- or low-debt state, although they do not capture changes in debt outstanding over the study period. Past debt issuance by a state and its local governments is expected to reduce future issuances in two ways. First, high per capita debt outstanding refl ects past bor-rowing and investment in long-lived assets. Th e persistent nature of capital means that fewer investments and related borrowing will be necessary in the near future. Second, a relatively high debt burden may be expected to increase the cost of capital as the risk associated with the underlying tax base grows, leading decision makers to shy away from further raising debt levels (Robbins and Simonsen 2012).
To control for debt market conditions, we use the aggregated monthly number of municipal bonds issued or the dollar value of bonds issued nationally, excluding the sample states in both cases. Th is control, BondMarkett, is especially important for the tumultu-ous years since the credit crisis began. Th e national market activ-ity measure is a proxy for variables that infl uence the number and volume of debt issuances, such as interest rates and expectations regarding future interest rates. It refl ects broad economic trends, as well as investor sentiment and appetite for municipal bonds. Th is market activity variable also controls for nationwide trends driven by external policy changes during the period, such as the introduc-tion of the federal Build America Bonds tax credit bond program (see Maguire 2010).
Data
Based on our empirical approach, we employ data on municipal bonds issued within Colorado and seven neighboring states over a 44-month period delineated by the start of the credit crisis, running from October 2007 through May 2011, by querying Th omson Reuters SDC Platinum database (U.S. Municipal New Issues). Since October 2007, there were 7,778 bond issues in these states (excluding issues with less than a year to maturity). Th e data set was then reduced to include only long-term municipal Despite the fact that passage of Amendment 61 appeared
unlikely, resource-conscious public managers may err on the side of caution and secure resources before the election.8 Th e possible
presence of an indirect eff ect even when an initiative is not partic-ularly credible suggests the phenomenon might represent behav-ior beyond simply responding to likely constraints. Th at said, the lead time involved in issuing debt means that managers would have started to respond to the threat by initiating the issuance process prior to polls indicating decreased support. Th e actual issuance of debt is a lagged indicator of the unobserved decision of public managers to issue debt before the election. Nevertheless, we expect this response to diminish as public support waned in the polls closer to the election, as managers can delay or cancel the sale of bonds.
In sum, the Colorado case provides a setting in which our three conditions for employing a beat-the-clock strategy are present to varying degrees. Th e potential impact of the threat was high, the credibility of passage was present early in the campaign period (by at least September 2010), and government managers had the ability to respond. Th us, it is an ideal environment in which to test the hypothesis that resource-conscious managers will act to preempt an initiative’s proposed constraints on future resources. Th is should be refl ected in an increase in debt issues when managers were faced with the threat of policy change.
Empirical Strategy
Given the nature of Amendment 61, our primary interest is the possible increase in debt issuance activity by the state of Colorado and its local governments. We consider two types of issuance: new money and refunding of existing debt. New money issues represent incremental obligations of the government to raise resources for projects, while the refunding of outstanding debt by a govern-ment is akin to a homeowner refi nancing a mortgage. Not only can it be used to secure lower interest rates for the debt, but also it can extend the fi nal maturity date of the debt. Both types of issuance represent a potential strategic response to the proposed Amendment 61.
Th e measurement of a management response to the amendment requires identifying a counterfactual, or cases that represent the likely behavior of the state and its local governments in the absence of the proposed ballot item. Because governments in neighboring states frequently issue debt for similar purposes as Colorado, we use their borrowing activity in the absence of the ballot initiative for comparison.9 More precisely, we expect to see a spike in debt
issuances in Colorado over the threat period but no such response in adjacent states.
Empirical Model and Methods
Th e core of our analysis is a parsimonious model of debt issuance. We use multiple regression analysis to estimate the eff ect of the proposed ballot item on state and local government behavior in Colorado:10
BondsIssueds,t= β0 + β1Th reats,t + β2BondMarkett + υs + εs,t
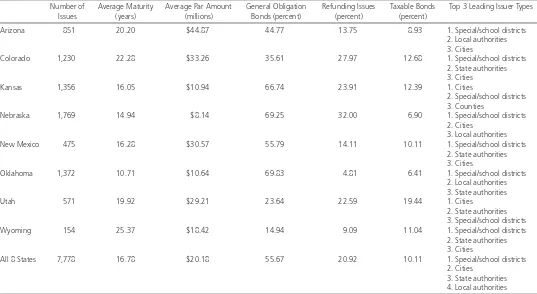
common, followed by state authorities and cities. Although it is not an outlier in any of the bond issue characteristics, Colorado ranks highly among the comparison states in average years to fi nal maturity, average par amounts, use of non–general obliga-tion bonds, porobliga-tion of refunding issues, and porobliga-tion of taxable bonds.
Th e number and volume of municipal bonds issued nationally is taken from Th e Bond Buyer’s Market Statistics Archive. Table 3 presents additional information about Colorado and the adjacent states that are used as our comparison group. State information on fi nances and government organization is gathered from the U.S. Census Bureau’s Annual Finance Survey and 2007 Governments Integrated Directory, respectively. Most notably, Colorado is the second largest of the comparison group states with regard to popula-tion, and it has the highest amount of debt outstanding as of 2008, both in absolute and per capita terms.
bonds because we are not interested in the routine short-term borrowing behavior typically used to smooth government cash fl ows. We eliminated the majority of short-term notes by exclud-ing bond issues with fi nal maturity dates less than three years away.11 Th e remaining individual bond issues were aggregated by
state and month to create both a count of issues in a state during each month as well as the combined face value of the bond issues (i.e., the par amounts).12 We have 352 observations for the eight
states over this postcrisis period. Limiting our analysis to this time period is preferable because bond activity was altered after the cri-sis. As a precaution, we also applied our models to a longer panel beginning before the crisis, which resulted in 520 state-month observations.
As seen in table 2, Colorado is similar to the comparison states with respect to the number of bonds issued and the leading types of issuers, with districts, both special and school, being the most
Table 2 Descriptive Statistics of Long-Term Bonds Issued by Sample States, January 2006–May 2011
Number of Issues
Average Maturity (years)
Average Par Amount (millions)
General Obligation Bonds (percent)
Refunding Issues (percent)
Taxable Bonds (percent)
Top 3 Leading Issuer Types
Arizona 851 20.20 $44.87 44.77 13.75 8.93 1. Special/school districts
2. Local authorities 3. Cities
Colorado 1,230 22.28 $33.26 35.61 27.97 12.68 1. Special/school districts
2. State authorities 3. Cities
Kansas 1,356 16.05 $10.94 66.74 23.91 12.39 1. Cities
2. Special/school districts 3. Counties
Nebraska 1,769 14.94 $8.14 69.25 32.00 6.90 1. Special/school districts
2. Cities 3. Local authorities
New Mexico 475 16.28 $30.57 55.79 14.11 10.11 1. Special/school districts
2. State authorities 3. Cities
Oklahoma 1,372 10.71 $10.64 69.83 4.81 6.41 1. Special/school districts
2. Local authorities 3. State authorities
Utah 571 19.92 $29.21 23.64 22.59 19.44 1. Cities
2. State authorities 3. Special/school districts
Wyoming 154 25.37 $18.42 14.94 9.09 11.04 1. Special/school districts
2. State authorities 3. Cities
All 8 States 7,778 16.78 $20.18 55.67 20.92 10.11 1. Special/school districts
2. Cities 3. State authorities 4. Local authorities
Note: These descriptive statistics are based on the data used in our preferred model specifi cation. This includes all bonds issues (new money and refunding) with more than three years to maturity.
Table 3 Descriptive Statistics of Sample States’ Population, Area, Outstanding Debt, and Number of Governments
Population (2008) Area (square miles)
Population Density (2008)
Long-Term Debt Outstanding (thousands, 2008)
Debt Per Capita (2008)
Number of Governments (2007)
Residents per Government (2008)
Arizona 6,499,377 113,998 57.0 $43,473,897 $6,689 645 10,077
Colorado 4,935,213 104,094 47.4 $49,425,722 $10,015 2,416 2,043
Kansas 2,797,375 82,277 34.0 $20,714,690 $7,405 3,931 712
Nebraska 1,781,949 77,354 23.0 $13,852,408 $7,774 2,659 670
New Mexico 1,986,763 121,589 16.3 $13,132,242 $6,610 863 2,302
Oklahoma 3,644,025 69,898 52.1 $16,928,380 $4,646 1,880 1,938
Utah 2,727,343 84,899 32.1 $16,313,800 $5,982 599 4,553
Wyoming 532,981 97,814 5.5 $2,340,951 $4,392 726 734
and the threat of Amendment 61. Th e results of the primary regres-sion analysis are presented in column A of table 4, which uses the total number of monthly bond issues in a state as the dependent variable. Th e number of bond issues in Colorado increased signifi -cantly relative to neighboring states as the threat of Amendment 61 loomed. Th e ballot threat resulted in an increase of roughly 24 bond issues per month in Colorado, nearly 150 percent above average. In an eff ort to judge the robustness of the results, we performed a number of falsifi cation exercises.
Several alternative specifi cations were estimated: (1) without state fi xed eff ects; (2) with only new money issues; (3) over a longer period of time, including the pre–credit crisis months; (4) with the two alternative threat periods discussed earlier; (5) with the depend-ent variable standardized across sample states as the fraction of the state’s average monthly bond issuance over the study period; and (6) using negative binomial regression to account for the nature of the count data dependent variable (see table 4). Th e direction and signifi cance of the eff ect is consistent across specifi cations. Th e coeffi cient for the threat period is smaller when the panel is not restricted to post–credit crisis because of generally higher precrisis debt activity and when only new money issues are included (because they represent only about two-thirds of Colorado issues during the study). Th e longer panel (not restricted to the postcrisis period) validates the fi nding that the response of governments is not simply an artifact of the credit crisis. Th e use of the standardized dependent variable affi rms the previous fi ndings and, taking into account the count nature of the issuance dependent variable, the negative bino-mial regression results reinforce that the number of monthly debt issues increased by at least 100 percent during the threat period.
Th e magnitude of our results is noteworthy, but it likely understates the behavioral response to the threat of the ballot items. A por-tion of the reacpor-tion by managers may manifest itself in forms other than debt issuance. For example, it was reported that referenda were being held to increase taxes so as to avoid the limitations of the proposed Amendment 60 (Illescas 2010). More important for considering the specifi c response to Amendment 61, governments that waited to see whether the preelection support ultimately waned or the amendment passed may have decided not to go to market despite having already completed the extensive planning process for issuing debt. As Denver-based attorney Dee Wisor stated, “I have some clients who are queuing up to do these deals after the election but before the end of the year. But if the ballot issues don’t pass, they probably won’t do the deals this year” (Williamson 2010).
In addition to the observed change in the number of debt issues in Colorado in response to the threat of Amendment 61, we might also expect to observe diff erent levels of reaction by government type. Th is is especially true if the impacts of the amendment are not evenly distributed across diff erent levels of government, which was the case, with state government likely being the most constrained. Table 5 displays the percentage of total bond issues by the diff erent types of government in Colorado during a number of time periods. During the threat period, cities are overrepresented, with more than 30 percent of issues, relative to historical patterns of issuance in Colorado. Cities are more heavily dependent on sales tax revenue in Colorado than counties and the state government. Heightened fi scal stress in response to the dramatic downturn in economic activity
Results
We have argued that public managers will take action to lock in resources before voters have time to (dis)approve a resource-con-straining initiative. Th is managerial response is driven by three key factors: (1) the potential impact of the initiative, (2) the govern-ment’s ability to respond, and (3) the credibility of the threat. Th us, given Amendment 61, we expect to see a spike in debt issuance during the two months preceding the ballot item vote (September and October 2010), when the strategic management responses to the threat would manifest.
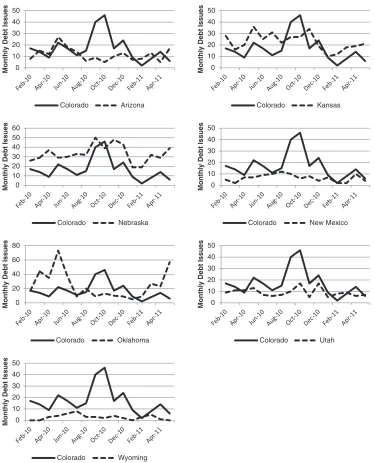
We fi rst present visual evidence of the relationship (fi gure 2). As expected, the number of monthly bond issues in Colorado did indeed spike in the two months preceding the election and then declined. Figure 3 presents the percentage deviation from the aver-age monthly number of municipal bond issues in Colorado and nationally (excluding Colorado) over the study period. Th e jump in Colorado issuance, between 150 percent and 200 percent above average, in September and October 2010 is clearly visible. Th e Colorado bond issues do not simply match patterns of national debt activity. Moreover, as seen in fi gure 4, the spike seen in Colorado is not replicated in any of the comparison states.
Using the debt issuance in neighboring states, as well as issuance activity in Colorado before and after the threat period, we employ regression analysis to judge the statistical signifi cance and magnitude of the visible relationship between the bond issuance in Colorado
-100
Oct-07 Jan-08 Apr-08 Jul-08 Oct-08 Jan-09 Apr-09 Jul-09 Oct-09 Jan-10 Apr-10 Jul-10 Oct-10 Jan-11 Apr-11
Deviation (%) from Avg. Monthly
Bond Issuance
Colorado Nation
Figure 3 Percentage Deviation from Average Monthly Bond Issuance (number of issues), Colorado and Nation, October 2007–May 2011
Oct-07 Jan-08 Apr-08 Jul-08 Oct-08 Jan-09 Apr-09 Jul-09 Oct-09 Jan-10 Apr-10 Jul-10 Oct-10 Jan-11 Apr-11
Monthly Bond Issues
Note: Bond issue counts include long-term debt issued during the period as reported in Thomson Reuters SDC Platinum.
the increased debt activity simply represents the shifting of future debt issuance into the preelection period rather than a net long-term increase in government borrowing. An additional specifi cation of the model estimates the relative debt issuance, by number of issues, in the months following the election that are available in our data set. Th is postelection dummy variable has a negative and statistically signifi cant coeffi cient (see column I in table 4), suggesting that the number of issuances was reduced by nearly fi ve issues per month for the seven months following the election. Th is represents nearly 60 percent of the increased issuance observed during the threat period and provides some evidence that, at least to date, 40 percent of the increased issuance came from new activity spurred on by the threat of the amendment.
Th e number of issues is our primary indicator of increased activ-ity because it is a representation of an individual government’s over this period may have made cities more responsive to the
per-ceived threat of future constraints.
If governments are trying to circumvent the will of voters, then we might also expect the use of high-discretion bond types, such as rev-enue and refunding bonds, to increase during the period, as opposed to general obligation debt, which requires public approval. Revenue bonds already make up a majority of the issues in Colorado (nearly 67 percent) during the study period. Th is proportion increased by a few percentage points during the two months when govern-ments were expected to most actively respond to Amendment 61. Similarly, the proportion of debt issues that were purely refunding versus new money saw a modest increase during the threat period.
Having established that there was an increase in bond issuance in the months prior to the election, it makes sense to consider whether
Note: Bond issue counts include long-term debt issued during the period as reported in Thomson Reuters SDC Platinum.
Figure 4 Monthly Bond Issuance (number of issues), Colorado and Comparison Group States, February 2010–May 2011
0 10 20 30 40 50
Monthly Debt Issues
Colorado Arizona
0 10 20 30 40 50
Monthly Debt Issues
Colorado Kansas
0 10 20 30 40 50 60
Monthly Debt Issues
Colorado Nebraska
0 10 20 30 40 50
Monthly Debt Issues
Colorado New Mexico
0 20 40 60 80
Monthly Debt Issues
Colorado Oklahoma
0 10 20 30 40 50
Monthly Debt Issues
Colorado Utah
0 10 20 30 40 50
Monthly Debt Issues
dollar amount or par value of bond issues in a state as the depend-ent variable (table 6). Th e results are consistent with our previous fi ndings in direction, although the magnitude is less pronounced. decision to borrow, but it can be argued that the dollar amount
of debt issued is also relevant. Th e reported specifi cations are estimated using the natural logarithm of the aggregated monthly
Table 5 Composition of Colorado Bond Issuance by Issuer and Issue Type (percentage of issues)
Time Period State County City Higher Education Special/ School Districts
State Authority Local Authority Tribe Revenue Bonds
Refunding Issues
Five-year (1/2006–5/2011) 0.98 5.37 18.78 3.74 41.38 21.71 7.89 0.16 64.39 27.97
Postcrisis (10/2007–5/2011) 1.42 5.39 21.84 4.82 39.86 18.87 7.66 0.14 67.09 28.37
Threat period (9/2010–10/2010) — 5.81 31.40 6.98 38.37 10.47 6.98 — 70.93 30.23
Note: These descriptive statistics are based on the data used in our preferred model specifi cation. This includes all bonds issues (new money and refunding) with more than three years to maturity.
Table 4 State Monthly Number of Bond Issues Regression Model Results
(A) (B) (C) (D) (E) (F) (G) (H) (I)
Primary– Issue Count
Primary–No State F.E.
New Money
Long Panel Alternate Threat Period (Aug.–Oct. 2010)
Alternate Threat Period (Sept.–Dec. 2010)
Relative Issuance
Negative Bino-mial Regression
Post-Threat Issuance
Ballot threat (0,1) 24.056*** 24.219*** 16.551*** 20.950*** 14.973** 13.122** 1.48*** 0.779*** —
(1.660) (1.721) (1.040) (1.652) (7.554) (5.913) (0.101) (0.276)
Postelection (0,1) — — — — — — — — –3.56**
(1.505)
National issuance 0.013*** 0.013*** 0.009*** 0.013*** 0.013*** 0.013*** 0.001*** 0.001*** 0.013***
(0.002) (0.003) (0.002) (0.002) (0.002) (0.002) (0.000) (0.000) (0.002)
Constant 3.853** 0.733 3.850*** 3.490** 3.711** 3.876** 0.262*** 1.677*** 2.938*
(1.521) (2.438) (1.352) (1.464) (1.530) (1.540) (0.100) (0.132) (1.650)
Observations 352 352 352 520 352 352 352 352 352
R2 0.598 0.078 0.471 0.530 0.588 0.588 0.152 0.163 0.574
Adjusted R2 0.588 0.073 0.457 0.521 0.577 0.577 0.130 — 0.564
Robust standard errors in parentheses. *** p < .01; ** p < .05; * p < .10.
Note: The dependent variable in all columns, except C and G, is the number of monthly bond issues in a state (including both long-term new money and refunding activity). Column C excludes issues that were only for refunding purposes. Column G uses the fraction of the average monthly number of bond issues for the given state issued in the current month as the dependent variable (current month number of issues in state/average monthly number of issues in state). The independent variable of interest, ballot threat, is a dichotomous variable set to 1 in September and October 2010, the two months preceding the November 2 election, when public awareness of the ballot items peaked, and to 0 otherwise. This operationalization is used in all specifi cations, except for columns E and F, which use expanded threat periods, including August and September through December 2010, respectively. National issuance is the total number of municipal bonds issued nationally in each month, less the issuance from the comparison group states. All specifi cations, except column B, include state fi xed effects. Pseudo R2 is reported for the negative
bi-nomial regression. Column I excludes the ballot threat indicator as an independent variable and includes a dichotomous variable set to 1 beginning in November 2010 following the election for Colorado.
Table 6 State Monthly Volume of Bond Issuance Regression Model Results
(A) (B) (C) (D) (E) (F) (G) (H)
Primary–Issuance Amount
Primary–No State F.E.
New Money Long Panel
Threat Period (Aug.–Oct. 2010)
Threat Period (Sept.–Dec. 2010)
Relative Issuance Post-Threat Issuance
Ballot threat (0,1) 0.581* 1.727*** 0.555 0.448 0.572** 0.579** 0.491 —
(0.327) (0.313) (0.388) (0.299) (0.248) (0.233) (0.337)
Postelection (0,1) — — — — — — — –0.430
(0.651)
National issuance 1.039*** 1.025*** 1.003*** 0.972*** 1.040*** 1.029*** 0.534*** 1.023***
(0.263) (0.377) (0.274) (0.239) (0.263) (0.265) (0.129) (0.262)
Constant –5.830** –5.693 –5.877** –5.108** –5.841** –5.730** –4.476*** –5.649**
(2.716) (3.890) (2.821) (2.462) (2.712) (2.730) (1.320) (2.705)
Observations 352 352 352 520 352 352 352 352
R2 0.488 0.028 0.453 0.466 0.488 0.488 0.033 0.488
Adjusted R2 0.474 0.022 0.439 0.456 0.474 0.475 0.008 0.475
Robust standard errors in parentheses. *** p < .01; ** p < .05; * p < .10.
Th e coeffi cients on the threat period variables in our primary specifi cation, operationalized in multiple ways, consistently fi nd that the volume of debt issuance in Colorado increased as the ballot election neared by more than 75 percent relative to average monthly issuance of $576.5 million.
Removing state fi xed eff ects from the model, reported in column B of table 6, increases the magnitude and statistical signifi cance, which refl ects the typically higher debt activity of Colorado relative to the average comparison group state. Th e positive relationship between the preelection threat period and monthly par value is not statisti-cally signifi cant at conventional levels over the longer pre–credit crisis time period, when issuance volumes were higher to begin with, when only new money is considered, or using the relative issuance volume as the dependent variable. Contrary to the issue count results, the monthly dollar volume of Colorado debt issues was not signifi cantly diff erent following the election (see column H in table 6).
Th ese results support the overall fi ndings while refl ecting the main weakness in using debt volume as a measure, namely, that debt issuance is lumpy and highly irregular so a small number of outliers can dramatically skew the par amounts issued in a given month. For example, while the median bond issue for the eight states is $4.4 million during the period, the mean is more than $20 million, and the largest 10 percent of issues range from $48 million to more than $1 billion. Removing just the largest one-tenth of 1 percent of the 7,778 individual bond issues from the sample, which is only six bond observations, results in a statistically signifi cant threat period coeffi cient in the relative issuance model. Because of the nature of the research question, we retain outliers and present the more conservative results, but we reiterate that the issue counts are the preferred measure of activity.
Conclusions
In this article, we explored the strategic response of governments to citizen-led initiatives. We argued that public managers will proactively secure resources that will be constrained by a proposed initiative before that initiative is formally voted on—that is, they will attempt to “beat the clock.” Th is suggests that such a response would be dependent on three factors: the potential impact of the threat, the ability of the government to respond, and the credibility of passage. Considering our argument in the context of a recently proposed ballot item in the state of Colorado, we hypothesized that resource-conscious managers will preempt the possible constraints imposed by the amendment on their capacity to issue future long-term debt. Th is should be refl ected in an increase in debt issues and, potentially, the volume of total issuance during the period when managers became actively aware of the threat. Our analysis supports the hypothesized behavior. Our fi ndings have implications for direct democracy and strategic management.
First, the irony of the eff ect on debt issu-ance resulting from the ballot items is that the initiators essentially hastened the very governmental activity that they desired to limit. Whether this is a persistent concern for initiators will depend on the nature of the bal-lot item and managerial response. In this case,
the increased debt issuance appears to refl ect a combination of the shifting of future debt to current periods along with an increased overall use of debt.
Second, if governments are proactive in the way that we suggest, then some individuals may be concerned that the democratic process is being circumvented. Such eff orts by state legislators to undo citizen initiatives afterpassage have not gone unnoticed. For example, Smith (2001) looks at so-called countermajoritarian bills in Colorado, where the state legislature has challenged the outcome of previous ballot initiatives. While such contrary actions by elected offi cials appear troubling at the aggregate level of the legislature, they are not uncommon and seem to be less of a concern when examined at the level of the individual legislator. Th e fact “that legislators will vote against the statewide electorate if it is consistent with their own districts’ wishes” (Smith 2001, 58) provides a paral-lel to our study. If public managers believe that the will of their constituents diff ers from that of the state as a whole, then preempt-ing such initiatives may remain in accordance with democratic principles.
Th ird, a more nefarious perspective is that external experts use the threat of policy change to infl uence managerial behavior. Principal– agent problems are a constant concern in public fi nance, where gov-ernments often depend on external lawyers, fi nancial advisors, and bond underwriters for expertise and where personal relationships reign supreme (Simonsen and Hill 1998, 85). Th e public fi nance industry had an incentive to overstate the likelihood of Amendment 61’s passage because more debt issuance means more business. Relatedly, public managers and offi cials may have actively used the idle threat to promote and advance debt-supported projects. Th e local press in Colorado raised this issue, more broadly, when report-ing the impression of some citizens that special districts were “takreport-ing advantage of Amendment 61—despite its garnering little support from likely voters . . . by scaring residents into believing the sky will fall if it passes” (Illescas 2010).
Finally, several scholars have noted that local governments struggle to eff ectively implement strategic management (Backoff , Wechsler, and Crew 1993; Poister and Streib 2005; Streib 1992; Swanstrom 1987). A key diffi culty is their ability to manage shifting external environments, particularly with respect to creating and managing resources. Our research demonstrates that on some issues, local public managers can indeed eff ectively secure resources despite an unpredictable political environment. Given that the analysis focuses on a single initiative in Colorado, we ask whether the fi ndings are generalizable to other policy settings. For such behavior, it is paramount that public managers have the discretion, or ability, to respond to the perceived constraint. Th e discrete nature of debt issuance lends itself to this behavior because the borrowed funds
are essentially locked in place regardless of any ultimate policy change resulting from an election. An additional setting in which beat-the-clock behavior may be observed is at the local level, where so-called ballot box zoning takes place (Staley 2001). Government offi cials, possibly in partnership with private developers, may proceed or accelerate projects to avoid the threat of new constraints. Th at
Th
e irony of the eff ect on debt
issuance resulting from the
bal-lot items is that the initiators
essentially hastened the very
governmental activity that they
said, this behavior will likely be limited in policy initiatives that are focused on altering citizen behaviors, such as abortion, drug use, or gun regulations, rather than government behaviors, such as the issu-ance of debt. Future research should explore such behavior in alter-native policy settings and where there is variation in the potential impact of the initiative, the ability to respond, and the credibility of the threat.
Acknowledgments
Th is article benefi ted greatly from the constructive and insightful comments of three anonymous reviewers, as well as participants at the 7th Transatlantic Dialogue on Strategic Management of Public and Non-Profi t Organizations at Rutgers University–Newark.
Notes
1. From the USC Initiative and Referendum Institute, IRI Report on Initiative Use, 1904–2009, September 2010, http://www.iandrinstitute.org/IRI%20 Initiative%20Use%20(2010-1).pdf (accessed October 8, 2012).
2. Th is article focuses on public managers, but we acknowledge that management is a joint endeavor of appointed managers and elected offi cials in state and local governments, so the fi ndings may be generalized to the broader group of deci-sion makers across institutional settings.
3. For more comprehensive literature reviews on (1) direct democracy and initia-tives and 2) strategic management, see Lupia and Matsusaka (2004) and Poister, Pitts, and Edwards (2010), respectively.
4. Th ere is a lengthy literature describing responses (or lack thereof ) to threats—or “cheap talk”—that are not deemed credible (see, e.g., Farrell and Rabin 1996; Gibbons 1992).
5. Restrictions on issuing debt in Colorado may be further complicated by the existence of home rule charters for many local governments and by the presence of a Taxpayer Bill of Rights (TABOR), both of which may impose additional restrictions.
6. Combined, these two fi rms served as bond counsel for more than three-quarters of all Colorado long-term municipal bonds issued during the study period. 7. Another way to conceptualize the “perceived threat” is by the pattern of fi nancial
support to the issue committee that led the opposition eff ort against the ballot items. Th e number of campaign contributions to Coloradans for Responsible Reform peaked in September 2010 as the election neared. Th e dollar amount of contributions peaked a couple of months earlier, in July, and more than 80 percent of all funds were received prior to the end of August. Th is is likely the time period when public managers were deciding whether to take the necessary steps to issue debt prior to the November election.
8. Another possible source of perceived credibility is the history of the initiative process in Colorado, where there is an established record of not only using direct democracy, but also using it to enact limits on the fi scal discretion of government (see Elofson et al. 2007). Moreover, voters previously adopted TABOR, one of the most stringent state tax and expenditure limits (Martell and Teske 2007).
9. Neighboring states are operationalized as those that are geographically adjacent with Colorado: Arizona, Kansas, Nebraska, New Mexico, Oklahoma, Utah, and Wyoming.
10. Our primary dependent variable of interest, the number of monthly bond issues in a state, is a count variable. In addition to reporting ordinary least squares (OLS) results, which are favored for ease of interpretation and familiarity to readers, we also report the results using negative binomial regression. Th e count data method results are consistent with the direction and signifi cance of our reported OLS estimates. A fi rst-diff erenced model, to account for the time-series nature of the data, is also estimated using the specifi cation reported in table 4, column A, with similar results.
11. Th e analytical results are consistent when using diff erent defi nitions of long-term debt.
12. Par amount refers to the face value of an issued bond. For example, a municipal bond with a $1 million par amount, a coupon rate of 5 percent, and 10 years to maturity will pay annual interest of $50,000 for a period of 10 years and then return $1 million to the investor at maturity.
References
Backoff , Robert, Barton Wechsler, and Robert E. Crew, Jr. 1993. Th e Challenge of Strategic Management in Local Government. Public Administration Quarterly
17(2): 127–45.
Bell Policy Center. 2010. Policy Brief: Preliminary Analysis of Amendment 61. November 17. http://bellpolicy.org/node/3501 [accessed October 8, 2012]. Brown, Trevor, and Matt Potoski. 2006. Contracting for Management: Assessing
Management Capacity under Alternative Service Delivery Arrangements. Journal of Policy Analysis and Management 25(2): 323–46.
Bryson, John M., Frances S. Berry, and Kaifeng Yang. 2010. The State of Public Strategic Management Research: A Selective Literature Review and Set of Future Directions. American Review of Public Administration 40(5): 495–521.
Budge, Ian. 1971. Correspondence: Agreement and the Stability of Democracy.
Political Studies 19(3): 381–82.
Denhardt, Robert B. 1985. Strategic Planning in State and Local Government. State and Local Government Review 17(1): 174–79.
Dodge, William R., and Douglas C. Eadie. 1982. Strategic Planning: An Approach to Launching New Initiatives in an Era of Retrenchment. MIS Report 14(9): 1–13.
Eadie, Douglas C. 1983. Putting a Powerful Tool to Practical Use: Th e Application of Strategic Planning in the Public Sector. Public Administration Review 43(5): 447–52.
Elofson, Stan, Daniel A. Smith, Jennifer Berg, and Joey Lubinski. 2007. A Listing of Statewide Initiated and Referred Ballot Proposals in Colorado, 1912–2006. Issue Brief no. 07-07, Colorado Legislative Council Staff .
Farrell, Joseph, and Matthew Rabin. 1996. Cheap Talk. Journal of Economic Perspectives 10(3): 103–18.
Gardner-Smith, Brent. 2010. Amendments 60 and 61 Popular with Voters. Aspen Daily News, September 10.
Gerber, Elisabeth R. 1996. Legislative Response to the Th reat of Popular Initiatives.
American Journal of Political Science 40(1): 99–128.
———. 1998. Pressuring Legislatures through the Use of Initiatives. In Citizens as Legislators: Direct Democracy in the United States, edited by Shaun Bowler, Todd Donovan, and Caroline J. Tolbert, 191–208. Columbus: Ohio State University Press.
Gerber, Elisabeth R., Arthur Lupia, Mathew D. McCubbins, and D. Roderick Kiewiet. 2001. Stealing the Initiative: How State Government Responds to Direct Democracy. New York: Prentice Hall.
Gibbons, Robert S. 1992. Game Th eory for Applied Economists. Princeton, NJ: Princeton University Press.
Illescas, Carlos. 2010. Amendment 61 Has Special Districts Pre-emptively Seeking Loans. Denver Post, October 10.
Jacob, Benoy, Becky Lipton, Victoria Hagens, and Bill Reimer. 2008. Rethinking Local Autonomy: Perspectives from Four Rural Communities. Canadian Public Administration 51(3): 407–27.
Kutak Rock LLP. 2010. Colorado Debt and Tax Initiatives Analyzed Based on Existing TABOR Case Law. http://www.kutakrock.com/publications/publicfi -nance/ca051910.pdf [accessed October 8, 2012].
Lupia, Arthur, and John G. Matsusaka. 2004. Direct Democracy: New Approaches to Old Questions. Annual Review of Political Science 7: 463–82.
Maguire, Steven. 2010. Tax Credit Bonds: Overview and Analysis. Report no. R40523. Washington, DC: Congressional Research Service.
Martell, Christine R., and Paul Teske. 2007. Fiscal Management Implications of Colorado’s TABOR Bind. Public Administration Review 67(4): 673–87. Matsusaka, John G. 1995. Fiscal Eff ects of the Voter Initiative: Evidence from the
Last 30 Years. Journal of Political Economy 103(3): 587–62.
Mullins, Daniel R. 2004. Tax and Expenditure Limitations and the Fiscal Response of Local Government: Asymmetric Intra-Local Fiscal Eff ects. Public Budgeting and Finance 24(4): 111–47.
Poister, Th eodore H., and GregoryStreib.1994. Municipal Management Tools from 1976 to 1993: An Overview and Update. Public Productivity and Management Review 18(2): 115–25.
———. 2005. Elements of Strategic Planning and Management in Municipal Government: Status after Two Decades. Public Administration Review 65(1): 45–56.
Poister, Th eodore H., David W. Pitts, and Lauren Hamilton Edwards. 2010. Strategic Management Research in the Public Sector: A Review, Synthesis, and Future Directions. American Review of Public Administration 40(5): 522–45. Robbins, Mark D., and Bill Simonsen. 2012. Do Debt Levels Infl uence State
Borrowing Costs? Public Administration Review 72(4): 498–505.
Sherman & Howard LLC. 2010. Proposition 101 and Amendments 60 and 61— What to Do in 2010? http://www.shermanhoward.com/NewsAndEvents/
View/D31CE0DA-5056-9125-630AA5F9B17C7CF0/ [accessed October 8, 2012].
Simonsen, Bill, and Larry Hill. 1998. Municipal Bond Issuance: Is Th ere Evidence of a Principal–Agent Problem? Public Budgeting and Finance 18(4): 71–100. Smith, Daniel A. 2001. Homeward Bound? Micro-Level Legislative Responsiveness
to Ballot Initiatives. State Politics and Policy Quarterly 1(1): 50–61.
Staley, Samuel R. 2001. Ballot Box Zoning, Transaction Costs, and Urban Growth.
Journal of American Planning Association 67(1): 25–36.
Streib, Gregory. 1992. Applying Strategic Decision Making in Local Government.
Public Productivity and Management Review 15(3): 341–55.
Swanstrom, Todd. 1987. Th e Limits of Strategic Planning for Cities. Journal of Urban Aff airs 9(2): 139–57.
U.S. Census Bureau. 2008. 2007 Governments Integrated Directory (GID). http:// harvester.census.gov/gid/gid_07/options.html [accessed October 8, 2012]. Vogt, A. John. 2004. Capital Budgeting and Finance: A Guide for Local Governments.
Washington, DC: International City/County Management Association. Whorton, Joseph W., and John A. Worthley. 1981. A Perspective on the Challenge
of Public Management: Environmental Paradox and Organizational Culture.
Academy of Management Review 6(3): 357–61.
Williamson, Richard. 2010. Colorado Faces Debt, Tax Revolt: Issuers Rush Deals Before Election. Th e Bond Buyer, September 7, 1.