ECOSYSTEM APPROACH TO REEF FISHERIES MANAGEMENT
IN WEH ISLAND, NANGROE ACEH DARUSSALAM
Irfan Yulianto, Budy Wiryawan, and Am Azbas Taurusman Lecturer in Faculty of Fisheries and Marine Science, Bogor Agricultural University, Bogor Received November 30-2009; Received in revised form October 15-2010; Accepted March 1-2011
ABSTRACT
Fisheries management has been traditionally governed to maximize economic benefit with little concern on its ecological impacts. Food and Agriculture Organization with its Code of Conduct for Responsible Fisheries has played an important role to a fundamental change in the new paradigm of fisheries management, which include ecosystem aspect. The Food and Agriculture Organization has mandated that every country in the world should use this approach. Weh Island is located in Aceh Province that has good coral reef condition and rich in reef fishes, therefore reef fishery is prominent. The objectives of this study are (1) to study the ecological status of reef fish, and (2) to formulate the priority areas as candidates of marine protected areas in Weh Island. Fish catch survey, underwater visual census, and focus group discussion were conducted to collect data. Data analysis used fish biomass, financial analysis, linear goal programming, and marxan analysis. Results of this study successfully identified eight fishing gears operated in Weh Island in artisanal reef fisheries. These fishing gears are gillnet, bottom gillnet, handline, muroami, trolline, speargun, longline, and purse seine. There were 84 species identified as high economic value species and were modelled in this study. Gillnet and bottom gillnet were identified as optimum fishing gears. I.e. Meulee, Anoi Itam, Iboih, Jaboi, and Klah Island were identified as priority areas.
KEYWORDS: fisheries management, ecosystem approach to fisheries management, maximum sustainability yield, fishing gear
INTRODUCTION
Fisheries management approach has been using the conventional approach since the 1940s where more sectoral approaches were used disregard the rules of ecology. Since the Food and Agricultural Organization published a Code of Conduct for Responsible Fisheries in 1995, then paradigms shift of approach to fisheries management. In addition, with the publication of the Declaration of Reykjavik in 2001 that explicitly gave the task to Food and Agricultural Organization to create a guidance document that provides ecosystem considerations in fisheries management, the Food and Agricultural Organization technical guidelines for fisheries management issue which is the mandate of the Code of Conduct for Responsible Fisheries concerning the ecosystem approach in fisheries management. Ecosystem appoach to fisheries is defined by Ward et al. (2002) as an extension of conventional fisheries management recognizing more explicitly the interdependence between human well being and ecosystem health and the need to maintain ecosystems productivity for present and future generations, e.g. conserving critical habitats, reducing pollution, and degradation, minimizing waste, protecting endangered species (Food and Agricultural Organization, 2003).
Weh Island, located at the northwestern tip of Sumatera Island, the Province of Nanggroe Aceh
Darussalam. Sixteen of eightteen villages in Pulau Weh, located in coastal areas, thus dependency on coastal resources is very high, especially coral reefs, and reef fish. Traditionally, Pulau Weh is currently divided into ten Lhok, which is an area that is managed by customary institutions led by one commander (Panglima Laot).
Currently, the ecosystem approach in fisheries management has been implemented in several regions of the world such as fisheries management in the Benguela region (Petersen et al., 2007), Mediterranean Sea (General Fisheries Commission for the Mediterranean, 2005) and so forth. But until now this approach has not been formally implemented in Indonesia. Food and Agricultural Organization (2005) mentions that although the ecosystem approach is not a new thing in fisheries management, but still not a lot of learning in this approach, for it was felt necessary to conduct research in the ecosystem approach to fisheries management both conceptually and technically.
Objectives of this study are:
1. Assessing the ecological status of reef fisheries resources on the island of Weh.
MATERIAL AND METHODS
The research was conducted on the island of Weh, Sabang, Nanggroe Aceh Darussalam. The research was conducted from October 2008 to August 2009.
Collecting Data Methods
Data collected in this research is the catch of fishermen, the type, number and size of reef fish, the economic value of fishing gear, the coral reef ecosystem spatial data and institutional information.
Fish Catch Survey
Fish catch surveys conducted at five locations that represent the north, west, south, and east of Pulau Weh. The locations include Lhok Ie Meulee, Lhok Anoi Itam, Lhok Sandy, Lhok Men Laot, Lhok Kenekai, and Lhok Paya. Data collection technique was using photograph method (Cinner et al., 2005) to fish cacth of fishermen who landed the fish in the five regions for 14 days on the west and east monsoon.
Underwater Visual Census
Underwater visual census is a method to identify and count of fish observed in a particular area. Underwater visual census methods recorded size of all reef fish to species level, except for gobies (Gobiidae), blennies (Bleniidae), and triplefins (Tripterygidae) along six 50 m transects at reef crest and reef slope at each site. Transect surveyed were 2 m wide for fish that less than 10 cm and 5 m wide for fish that greater than 10 cm (Wildlife Conservation Society, 2008). Fish biomass was calculated from total length (cm) of fish and converted into weight (kg) using length and weight relationships from Fish Base 2000 data base (Froese & Pauly, 2000).
Spatial Data
Spatial data was used secondary data from the Wildlife Conservation Society that already published in Herdiana et al. (2008). Spatial data was data conservation features in the form of shape files.
Data Analysis
The method used in data analysis is the calculation of maximum sustainable yield (Garcia et al., 1989), linear goal programming (Ravindran, 2008), economic analysis of fishing gear (Fauzi & Anna, 2005), and Marxan analysis (Huggins, 2006).
Maximum Sustainable Yield
Maximum sustainable yield calculation is based on the following equation (Garcia et al., 1989):
F
B = the biomass on average M = natural mortality F = fishing mortality
Value of natural mortality of fish of each species obtained from existing data on fish online base (Froese & Pauly, 2000). Fishing mortality (F) obtained from the exploitation rate equation E=F/(F+M), where E is the level of exploitation. Some references mentioned Fmsy value occurs when the value of E at 0.5 (Samoilys, 1997).
Linear Goal Programing
Linear goal programming was used to determine the optimum amount of fishing gear based on maximum sustainable yield condition of each species. linear goal programming formulation presented following equation (Ravindran, 2008).
Objective:
∑
Pk = priority = 1 (no priority) dBi = slack variable
dAi = surplus variable aij = coefficient Xj = decision variable Z = objective function
Decision variables used in the constraint function is maximum sustainable yield of reef fish resources and the average catch of each fishing gear in one year.
Economic Analysis of Fishinge Gear
∑
TV = total income per year KBi = net income per trip N = total trip per year KBi = net income per trip Y = gross Income per trip Bo = operation cost per trip Bp = maintenance cost per trip Bt = fix cost per trip
Marxan Analysis
Marxan is an ecosystem spatial modeling with geographic information system database that is used to determine the priority areas. The steps in the analysis are determining conservation targets, making the area of interest (the limitations of spatial models), determining the cost model of conservation, create scenarios, and simulate scenarios so that the appropriate scenarios selected locations. The cost is calculated by the following equations (Huggins, 2006):
TB=BSP+BKK+BLC
BKK=10 P+4 DPI+2 K+1 MS ………..…. (4
where:
TB = total cost
BSP = planning unit cost BLC = boundary length cost BKK = species penalties
P = port
DPI = fishing ground K = village
MS = river
RESULTS AND DISCUSSION
Reef Fish
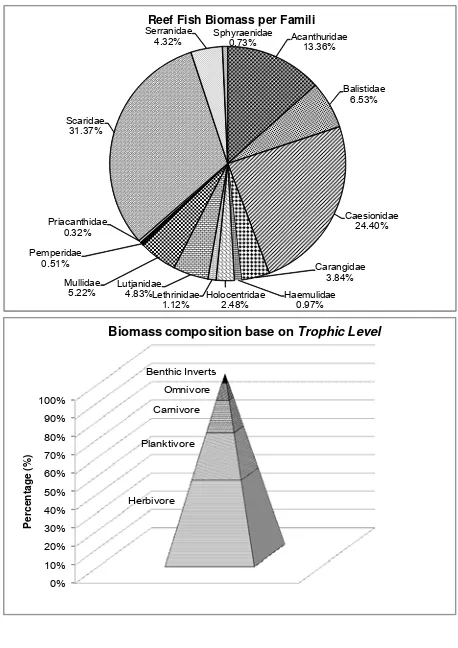
From underwater visual census, we identified 84 fish species from 14 families that were targeted in reef fisheries. The targeted species defined from interview with fishermen and fish cacth data.
Pseudobalistes fuscus from Balistidae had the lowest
biomass of 0.01 kg/ha. Chlorurus strongylocephalus
of Scaridae was species with the highest biomass value of 97.8 kg/ha. Family Scaridae had the highest biomass of 274.4 kg/ha which was then followed by Caesionidae and Acanthuridae, 213.5 and 116.8 kg/ ha respectively. Based on the food pyramid (Allen et al., 2005) herbivorous fish had the highest biomass
followed by planktivore, carnivores, omnivores, and benthic invertivore. This showed the composition of fish species that utilized or captured in good ecological condition, because it showed the structure of the natural food chain. The composition of reef fish is presented in Figure 1.
Reef Fish Biomass per Famili
Biomass composition base on Trophic Level
Figure 1. The composition of reef fish in Weh Island.
y = 0.6084x + 0.1412 R² = 0.9057
-10 20 30 40 50 60 70 80
0 20 40 60 80 100 120
M
SY (
k
g
h
a
-1)
Biomass (kg ha-1)
Comparison MSY and Biomass
Figure 2. Distribution of maximum sustainable yield-biomass of reef fishes.
Linear regression on the comparison showed that maximum sustainable yield could be predicted by the equation MSY=0.608 B+0.141. This coeficient (á=0.608) showed a significant value (p=0.000, confidence interval = 95%). It concluds that number of reef fish that can be exploited about 60% of biomass average. The linear regression also revealed that determination coefficient (R2) is 0.905, which mean that the equation is able to explain 90.5% of the comparative data of biomass and maximum sustainable yield. This is consistent with research Katsukawa (2004); Mace (2001) which states that the utilization rate of fish will be sustainable if carried out at 60% of the existing biomass.
Reef fishing gear on the island of Weh consists of eight types, namely, fixed gill nets, fishing line,
encircling gillnet, muroami (japanese seine), purse seine, trolline, speargun, and longline. Handline was common and most widely use in Weh Island. Fixed gillnets was operated on coral reefs without a boat. Longline was the most rarely used. Purse seine and tonda designed to catch pelagic fish, but by fishermen in Pulau Weh operated in around coral reefs, so that both types of fishing gears also catch reef fish.
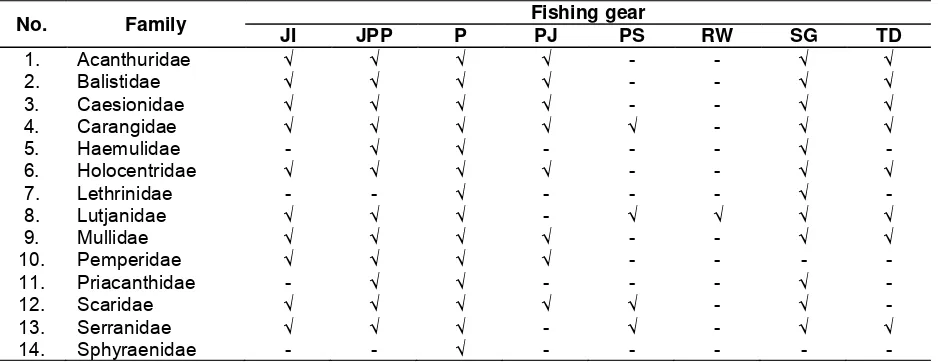
Handline was fishing gear that can capture the entire family of reef fish. The next gear with a predominantly catch reef fish were gill nets, encircling gillnet, and speargun which was followed muroami and trolline. Longline catch only Lutjanidae or snapper, that was an associate reef fish. The catch of each fishing gear is presented in Table 1.
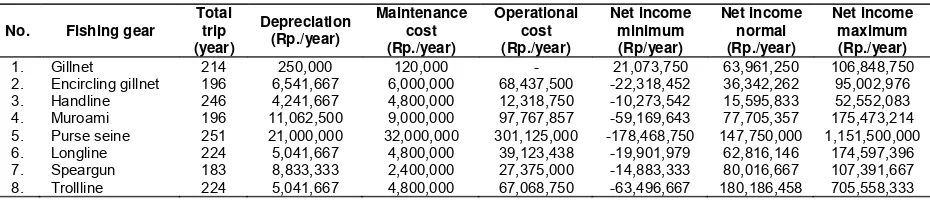
Economic analysis showed purse seine and trolline give the highest benefit, but these fishing gears caught mainly pelagic fish. Fishing gears that only caught reef fish and also give high benefit were speargun, muroami, fixed gill nets, and longlines. Economic value of each fishing gear showed in Table 2.
Analysis of linear goal programming to determine the optimal amount of fishing gear carried out in two groups of constraint function. The first group contains species with ratio between biomass and catch is more than 10, resulted in 75 species. Seventy five species are used as a 75 constraint functions. The second group contains species with ratio of biomass and catch more than 100, resulted in 45 species. Linear goal programming analysis results of each group are presented in Table 3. List of species for optimation model presented in Appendix 1.
Table 1. Fish catch (family) per fishing gear
No. Family Fishing gear
JI JPP P PJ PS RW SG TD
1. Acanthuridae √ √ √ √ - - √ √
2. Balistidae √ √ √ √ - - √ √
3. Caesionidae √ √ √ √ - - √ √
4. Carangidae √ √ √ √ √ - √ √
5. Haemulidae - √ √ - - - √ -
6. Holocentridae √ √ √ √ - - √ √
7. Lethrinidae - - √ - - - √ -
8. Lutjanidae √ √ √ - √ √ √ √
9. Mullidae √ √ √ √ - - √ √
10. Pemperidae √ √ √ √ - - - -
11. Priacanthidae - √ √ - - - √ -
12. Scaridae √ √ √ √ √ - √ -
13. Serranidae √ √ √ - √ - √ √
14. Sphyraenidae - - √ - - - - -
Table 2. Economic value of each fishing gear
No. Fishing gear Total
trip (year)
Depreciation (Rp./year)
Maintenance cost (Rp./year)
Operational cost (Rp./year)
Net income minimum (Rp/year)
Net income normal (Rp./year)
Net income maximum (Rp./year)
1. Gillnet 214 250,000 120,000 - 21,073,750 63,961,250 106,848,750
2. Encircling gillnet 196 6,541,667 6,000,000 68,437,500 -22,318,452 36,342,262 95,002,976
3. Handline 246 4,241,667 4,800,000 12,318,750 -10,273,542 15,595,833 52,552,083
4. Muroami 196 11,062,500 9,000,000 97,767,857 -59,169,643 77,705,357 175,473,214
5. Purse seine 251 21,000,000 32,000,000 301,125,000 -178,468,750 147,750,000 1,151,500,000
6. Longline 224 5,041,667 4,800,000 39,123,438 -19,901,979 62,816,146 174,597,396
7. Speargun 183 8,833,333 2,400,000 27,375,000 -14,883,333 80,016,667 107,391,667
8. Trollline 224 5,041,667 4,800,000 67,068,750 -63,496,667 180,186,458 705,558,333
No. Fishing gear
Scenario Group 1 (75 species)
Group 2 (45 species)
1. Gillnet 144 155
2. Encircling gillnet 35 193
3. Handline 30 406
4. Muroami 19 0
5. Purse seine 1,055 0
6. Longline 0 0
7. Speargun 10 1,392
8. Trolline 283 255
Table 3. Number of optimum fishing gear
This results recommended to develop gillnet. Gillnet was targeting Carangidae and Scaridae that biomass is still high. Gillnet is a productive fishing gear with relatively low cost and feasible to be developed. Another alternative fishing gear was encircling gillnet. Encircling gillnet caught Caesionidae and Acanthuridae where biomass were also still high.
Handline, consider by Weh Island community as an environmental friendly fishing gear. However, it needs to be regulated regarding to the main targets, that are snappers and groupers, whose already declining. Moreover, the number of handline operated was currently higher than recommended. Meanwhile, speargun, longline, and muroami were fishing gears
that also should be limited. Speargun and muroami can also lead to social conflict and should be strictly regulated.
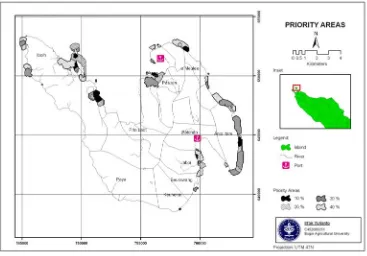
Determination of Priority Areas
Based on the analysis Marxan, the areas that need first priority with 10% of conservation targets are Anoi Itam, Ie Meulee, Pasiran, Iboih, Jaboi, and Keunekai. The second priority with 20% of conservation targets are Anoi Itam, Ie Meulee, Pasiran, Iboih, and Jaboi. The third priority with 30% of conservation targets are Anoi Itam, Ie Meulee, Pasiran, Iboih, Jaboi, and Beurawang. Fourth priority with 40% of conservation targets are Anoi Itam, Ie Meulee, Pasiran, Iboih, Jaboi, Beurawang, and Keunekai (Figure 3).
Figure 3. Priority map based on Marxan analysis.
Percent age of Conservat ion Target ( % )
P
e
rc
e
n
ta
g
e
H
a
b
it
a
t
(%
)
40 30 20
15 10
40
30
20
10
0
S 3.01785
R-Sq 94.0% R-Sq(adj ) 91.0% Regression
95% CI Priority Area ( Percentage Habitat)
Y = - 31.91 + 37.32 logten(X)
Percent age of Conservat ion Target ( % )
H
a
b
it
a
t
(H
a
)
40 30 20
15 10
400
300
200
100
0
S 27.2841
R- Sq 94.0% R- Sq(adj ) 91.0% Regr ession
95% CI Priority Area ( Habitat)
Y = - 288.5 + 337.5 logten(X)
Figure 4. Target conservation versus conservation area (above; percentage habitat and below; habitat).
CONCLUSION
1. Targeted fish were dominated by the family Scaridae, Caesionidae, and Acanthuridae. Composition of species caught showed that the food pyramid is still good. The average maximum sustainable yield is 60% of the biomass of reef fish. In the utilization of reef fish, there are some species that need to be protected and regulated. Gillnets is still the recommended fishing gear to catch reef fish, both ecologically, and economically. The recommended alternative fishing gear was encircling gillnet.
2. The priority areas in the management of reef fish that can be used as a conservation area consisted of several priority areas. The first priority area are Anoi Itam, Ie Meulee, Klah Island (Pasiran), Iboih, and Jaboi. The second priority areas are Keunekai and Beurawang.
ACKNOWLEDGEMENTS
This paper is part of Irfan Yulianto’s master thesis. Part of the study was supprted by the Wildlife Conservastion Society Indonesia Program.
REFERENCE
Amin, S. M. N., M. A. Rahman, G. C. Haldar, M. A. Mazid, & D. Milton. 2002. Population dynamics and stock assessment of Hilsa Shad, Tenualosa Ilisha in Bangladesh. Asian Fisheries Science. 15: 123-128.
Allen, G., R. Steene, P. Humann, & N. Deloach. 2005.
Reef Fish Identification: Tropical Pacific. New
World Publications Inc. Florida. USA. 479 pp.
Ault, J. S., S. G. Smith, J. Luo, M. E. Monaco, & R. S. Appeldoorn. 2008. Length based assessment of sustainability benchmark for coral reef fishes in Puerto Rico. Environmental Conservation. 35: 221-231.
Beck, M. W. 2003. The sea around: Conservation planning in marine region. In Groves, C. R., editor.
Drafting a Conservation Blueprint: A Practitioner’s
Guide to planning for Biodiversity. Washington
Island Press.
Cinner, J. E., M. J. Marnane, & T. R. McClanahan. 2005. Conservation and community benefits from traditional coral reef management at Athus Island, Papua New Guniea. Conservation Biology. 19: 1,714-1,723.
Froese, R. & D. Pauly. 2000. Fishbase.
www.fishbase.org [25 September 2008].
Food and Agriculture Organization. 2003. Fisheries Management 2: The Ecosystem Approach to
Fisheries. Food and Agriculture Organization of
the United Nations. Rome. 112 pp.
____. 2005. Putting Into Practice the Ecosystem
Approach to Fisheries. Rome. Food and
Agriculture Organization of the United Nations.
Fauzi, A. & S. Anna. 2005. Studi Evaluasi Ekonomi
Perencanaan Kawasan Konservasi Selat Lembeh,
Sulawesi Utara. Jakarta. USAID, Departemen
Kelautan dan Perikanan, dan Mitra Pesisir.
Garcia, S. M., P. Sparre, & J. Csirke. 1989. Estimating surplus production and maximum sustainable yield from biomass data when catch and effort time series are not available. Fisheries Research. 8:13-23.
General Fisheries Commission for the Mediterranean.
2005. SCMEE Transversal Workshop on
Ecosystem Approach to Fisheries. Tunisia. Institut
National des Sciences et Technologies de la Mer.
Huggins, A. E. 2006. Marxan Conservation Planning
for GIS Beginners. The Nature Conservancy.
Herdiana, Y., S. J. Campbell, & A. Baird. 2008. Systematic marine conservation planning towards a representative areas network in Aceh, Indonesia.
Proceedings of the 11th International Coral Reef
Symposium. Ft. Lauderdale. Florida.
Katsukawa, T. 2004. Numerical investigation of the optimal control rule for decision making in fisheries management. Fisheries Science. 70: 123-131.
Mace, P. M. 2001. A new role for maximum sustainable yield in single species and ecosystem approach to fisheries stock assessment and management.
Fish and Fisheries. 2: 2-32.
Petersen, S., D. Nel, & A. Omardien. 2007. Toward an Ecosystem Approach to Fisheries in the Benguela: An Assessment of Impact on Seabird,
Sea Turtle and Shark. Africa. World Wide Fund
for Nature.
Quinn II, T. J. & J. S. Collie. 2005. Sustainability in single species Population Model. Philosophy
Transaction. 360: 147-162.
Ravindran, A. R. (ed). 2008. Operations Research and
Management Science Handbook. C. R. C. Press.
Boca Raton.
Samoilys, M. 1997. Manual for Assessing Fish Stock
on Pacific Coral Reef. Department of Primary
Industry. Queensland. 78 pp.
Ward, T., D. Tarte, E. Hegerl, & K. Short. 2002.
Ecosystem Based Management of Marine Capture
Fisheries. World Wide Fund for Nature. Australia.
80 pp.
Wildlife Conservation Society. 2008. Pelatihan
Monitong Ekosistem Terumbu Karang. Wildlife
Appendix 1. List of species for optimation model
75 species 45 species
1. Acanthurus lineatus
2. Acanthurus mata
3. Naso sp.
4. Balistapus undulatus
5. Balistoides conspicillum
6. Balistoides viridescens
7. Melichthys indicus
8. Melichthys niger
9. Odonus niger
10. Rhinecanthus rectangulus
11. Sufflamen bursa
12. Sufflamen chrysopterus
13. Sufflamen fraenatus
14. Caesio caerulaurea
15. Caesio lunaris
16. Caesio teres
17. Caesio xanthonota
18. Pterocaesio digramma
19. Pterocaesio tile
20. Carangoides ferdau
21. Carangoides orthogrammus
22. Caranx melampygus
23. Diagramma pictum
24. Plectorhinchus
25. Myripristis sp.
26. Neoniphon sammara
27. Sargocentron sp.
28. Lethrinus harak
29. Monotaxis grandoculis
30. Aphareus furca
31. Lutjanus carponotatus
32. Lutjanus decussatus
33. Lutjanus ehrenbergii
34. Lutjanus fulviflamma
35. Lutjanus fulvus
36. Lutjanus Kasmira
37. Macolor niger
38. Pinjalo pinjalo
39. Mulloidichthys
40. Parupeneus sp.
41. Upeneus vittatus
42. Pempheris adusta
43. Pempheris vanicolensis
44. Priacanthus hamrur
45. Chlorurus bleekeri
46. Chlorurus sordidus
47. Chlorurus strongylocephalus
48. Chlorurus troschelii
49. Scarus altipinnis
50. Scarus forsteni
51. Scarus frenatus
52. Scarus ghobban
53. Scarus globiceps
54. Scarus niger
1. Acanthurus lineatus
2. Balistapus undulatus
3. Balistoides conspicillum
4. Odonus niger
5. Rhinecanthus rectangulus
6. Sufflamen bursa
7. Sufflamen chrysopterus
8. Caesio lunaris
9. Caesio xanthonota
10. Pterocaesio digramma
11. Carangoides ferdau
12. Caranx melampygus
13. Diagramma pictum
14. Neoniphon sammara
15. Sargocentron sp.
16. Lethrinus harak
17. Monotaxis grandoculis
18. Lutjanus carponotatus
19. Lutjanus decussatus
20. Lutjanus ehrenbergii
21. Lutjanus fulviflamma
22. Lutjanus fulvus
23. Pinjalo pinjalo
24. Mulloidichthys
25. Parupeneus sp.
26. Upeneus vittatus
27. Chlorurus bleekeri
28. Chlorurus sordidus
29. Chlorurus strongylocephalus
30. Scarus forsteni
31. Scarus frenatus
32. Scarus globiceps
33. Scarus niger
34. Scarus oviceps
35. Scarus quoyi
36. Scarus rivulatus
37. Scarus schlegeli
38. Scarus sp.
39. Scarus tricolor
40. Cephalopholis leopardus
41. Cephalopholis sexmaculata
42. Cephalopholis urodeta
43. Epinephelus merra
44. Epinephelus quoyanus
55. Scarus oviceps
56. Scarus quoyi
57. Scarus rivulatus
58. Scarus rubroviolaceus
59. Scarus schlegeli
60. Scarus sp.
61. Scarus tricolor
62. Aethaloperca rogaa
63. Cephalopholis argus
64. Cephalopholis leopardus
65. Cephalopholis sexmaculata
66. Cephalopholis sonnerati
67. Cephalopholis spiloparaea
68. Cephalopholis urodeta
69. Epinephelus fasciatus
70. Epinephelus macrospilos
71. Epinephelus merra
72. Epinephelus ongus
73. Epinephelus quoyanus
74. Epinephelus tauvina