DOI 10.1007/s10640-009-9305-5
Carbon Sequestration with Reforestations
and Biodiversity-scenic Values
Alejandro Caparrós · Emilio Cerdá ·Paola Ovando · Pablo Campos
Accepted: 18 June 2009 / Published online: 4 July 2009 © Springer Science+Business Media B.V. 2009
Abstract This paper presents an optimal control model to analyze reforestations with two different species, including commercial values, carbon sequestration and biodiversity or sce-nic values. We discuss the implications of partial or total internalization of environmental values, showing that internalizing only carbon sequestration may have negative impacts on biodiversity-scenic values. To evaluate the practical relevance, we compare reforestations in the South-west of Spain with cork-oaks (a slow-growing native species) and with eucalyp-tus (a fast-growing alien species). We do the analysis with two different carbon crediting methods: the Carbon Flow Method and the Ton Year Accounting Method. With the first method, the forest surface increases more, but using mainly eucalyptus. With the second, additional reforestations are done mainly using cork-oaks. We value the impact on visitors of these reforestations using stated preferences methods showing that, when these values are internalized, cork-oaks are favored.
Keywords Optimal control·Forests·Carbon sequestration·Biodiversity·Scenic·
Stated preferences·Carbon accounting
JEL Classification Q23·Q26·Q51·Q57
A. Caparrós (
B
)·P. Ovando·P. CamposSpanish National Research Council (CSIC), Institute for Public Goods and Policies (IPP), Albasanz 26, 28037 Madrid, Spain
e-mail: [email protected] P. Ovando
e-mail: [email protected] P. Campos
e-mail: [email protected] E. Cerdá
50 A. Caparrós et al.
1 Introduction
Countries which have ratified the Kyoto Protocol, a development of the United Nations Framework Convention on Climate Change, will need to reduce their greenhouse gas emis-sions, on average, to 5% below 1990 levels by 2012. One of the alternatives included in the Kyoto Protocol to achieve this goal is to plant trees, since trees sequester carbon from the atmosphere by growing and reduce therefore carbon dioxide concentrations. This is know as ‘afforestation and reforestation’ in the terminology used in the Kyoto Protocol and the Marrakech Accords (an agreement that completes the Protocol). The US have decided not to ratify the Kyoto Protocol but forest alternatives, especially reforestations, will continue to be a fundamental part of their climate change policy (Lubowski et al. 2006;Richards et al. 2006).
It is usually accepted that biodiversity increases when degraded agricultural lands are converted into forests (IPCC 2000). However, this is probably only true in regard to indige-nous forests and might not be the case when the ‘reforestation’ is actually the setting-up of rapidly-growing alien species plantations (Hunt 2008). It is also not true where pre-existing land uses have high biodiversity values (IPCC 2000).Matthews et al.(2002) have quantified bird biodiversity associated with reforestations in the United States and have found further evidence of the potential negative impacts of reforestation regimes. Therefore, the ‘affores-tation and refores‘affores-tation’ alternative may potentially conflict with the goal of the Convention on Biodiversity, since incentives to increase carbon sequestration may favor the use of fast-growing alien species, which can potentially be negative for biodiversity, as indicated by
Caparrós and Jacquemont(2003). These authors also show that neither the convention on climate change (UNFCCC) nor the convention on biodiversity (CBD) have adequate mecha-nisms to avoid this possibility, especially in the case of the ‘afforestations and reforestation’ alternative since most of the limits established for carbon sequestration alternatives do not affect this option. Although it has received less attention, a similar argument can be elabo-rated linking carbon sequestration and scenic values, since fast-growing plantations tend to have less scenic beauty. In this article, we will treat these values indistinctly, as values that are currently not internalized by markets and that will probably remain outside the markets in the near future (while carbon sequestration values are about to be internalized).
According to the Marrakech Accords, Parties can issue credits through ‘afforestation and reforestation’ (henceforth we will use exclusively the term reforestations) by means of art. 3.3 of the Kyoto Protocol if the land is located in an Annex I country1that ratifies the Pro-tocol (or eventually via art. 6 and Joint Implementation), and by means of art. 12 (Clean Development Mechanism) if the land is located in any Non-Annex I Party. In the first case, each country can decide how to incentivate carbon sequestration in its own land. What is going to matter at the international level is the total carbon budget of the country, since the Kyoto targets are based on net emissions. Therefore, a reasonable incentive mechanism to be set up by Annex-I governments is what is known as the ‘Carbon Flow Method’ (CFM). This method was proposed in the early literature on the impact of carbon sequestration on optimal rotations (Englin and Callaway 1993;Van Kooten et al. 1995) and essentially implies that the forest owner gets paid by the government (a subsidy) when carbon sequestration takes place and has to pay (a tax) when carbon is released (Feng et al.(2002) describe a similar system calling it the ‘pay-as-you-go’ method). The value of this carbon subsidy-tax is set equal to the carbon price associated with CO2emissions.Richards et al.(2006) also present this method as one of the best alternatives to be used in the US. An alternative method, or set of methods,
1 Essentially the OECD countries and the economies in transition.
is well represented by what is known as the ‘Ton Year Accounting Method’ (TYAM), see
Moura-Costa and Wilson(2000). This method implies paying2a given amount to the forest
owner each year as long as the carbon stays in the forest. The price to be paid is based on the carbon emission price and an equivalence factor (ε) that captures the benefit associated with sequestering one ton of CO2in the forest biomass for one year (this equivalence factor is estimated based on the cumulative radiative forcing of an emission of CO2over a 100-year time horizon). An essentially similar method is the carbon ‘rental fee’ used inSohngen and Mendelsohn(2003), where the forest owner gets paid a fee for each ton of carbon stored for one year. Although the method used to calculate this fee in Sonhngen and Mendelsohn’s paper is different, based on the expected increase in carbon emission prices, what matters for our purposes is that the owner gets paid for the total number of tons of carbon sequestered (not for the increase in carbon) and that the amount paid is substantially lower than the carbon price. The ‘variable-length-contract’ method described inFeng et al.(2002) is also similar to the TYAM, as the authors recognize. Thus, by analyzing the outcome with the CFM and the TYAM, we cover most of the methods proposed so far in the literature, at least those targeting directly carbon.3
For credits earned by CDM projects, two methods have finally been accepted within the Kyoto-Marrakech framework: the t-CERs and the l-CERs (Olschewski and Benitez 2005). The t-CER method can be seen as a variation of the TYAM ‘type’ of methods (paying for the standing forest, not for growth), with the particularity that the price is paid every 5 years and that the contract has a maximum time limit. Nevertheless, although our model could be applied to the CDM framework, we focus on Annex-I countries (Spain in the application) and discuss the two methods described in the previous paragraph.
Van Kooten(2000) proposed an optimal control model to evaluate carbon sequestration via ‘afforestation and reforestation’ with one single species, without taking into account biodiversity or scenic values. Applying this model to Canada, the author makes a strong argument in favor of large-scale plantations using fast-growing species. The model that we are going to present here extends this model in two ways: (1) we include a second tree spe-cies, which implies having a second state variable and a second control variable and (2) we include biodiversity-scenic values in the analysis. We first discuss the general model and then apply it to data for the South-west of Spain, discussing the outcomes with the two carbon accounting methods described above.
Moons et al.(2008) andMuys et al.(2003) also deal, using a GIS-based model in the first case and an integrated assessment model in the second case, with the establishment of new forests for carbon sequestration purposes, including recreation and other values in the analysis. These models are solved numerically and highlight the empirical importance of taking into account recreational values. InCaparrós et al.(2003), recreational values and carbon sequestration values are optimized jointly while determining the optimal rotation, but this model does not deal with reforestations. The remaining literature on reforestations set up for carbon sequestration purposes does not include neither biodiversity nor recreational or scenic values in the analysis (for a review, seeRichards and Stokes 2004). For cobenefits of soil carbon sequestration practices seeFeng and Kling(2005).
In the applied section of this paper, we compare reforestations in the South-west of Spain with two different species: cork-oak, a native slow-growing species, and eucalyptus, an alien
2 For both methods (CFM and TYAM), the money could actually come from a well-defined emission trading
scheme.
3Lubowski et al.(2006) analyze the impact of a constant per hectare payment for land use changes into
52 A. Caparrós et al.
fast-growing species that has been used in this area in the past. The first species yields an eco-system with high levels of biodiversity and is one of the main tree species in Mediterranean forests, one of the hot-spots for biodiversity in the world (Huntsinger and Bartolome 1992). The second species is assumed to have a negative impact in terms of biodiversity, at least in the area under consideration.4Nevertheless, since biodiversity is not easy to monetarize, we have estimated the impact on visitors’ welfare of a reforestation with these species using stated preference methods. We do not claim to be able to separate biodiversity values from scenic values, since visitors are probably considering both when valuing reforestations.5
Thus, we will refer to biodiversity-scenic values in the application. The results show that vis-itors perceive reforestations with cork-oaks as having a positive impact on their welfare while they perceive reforestations with eucalyptus as having a negative impact on their welfare. To put a dollar value on these welfare changes, we have conducted a choice experiment to value the contribution of cork-oak reforestations to the welfare of the visitors. We have also mea-sured the impact of reforestations with eucalyptus (and with cork-oaks) using the contingent valuation method. To integrate these values into our model, we have assumed that a share of these welfare changes could be internalized through additional subsidies for cork-oaks or through compensations to refrain from using eucalyptus.
Turning to the results of our applied model, we first show that, with current market values, reforestations with cork-oaks would not take place even if carbon sequestration values were internalized. Nevertheless, with the current system of subsidies for cork-oak reforestations, the new incentives for carbon sequestration would significantly increase the optimal amount of cork-oaks in a scenario without competition from eucalyptus. Allowing for competition from eucalyptus, we show that both incentive mechanisms to foster carbon sequestration (CFM and TYAM) imply an increase in the surface devoted to forest, although this increase is higher with the CFM method (yielding a steady-state where non-forest land almost disap-pears for high carbon prices). However, we also show that the CFM method implies decreasing the proportion of cork-oak to eucalyptus, while the TYAM method yields the opposite result, increasing the proportion of cork-oak to eucalyptus (compared with the equilibrium with no carbon sequestration incentives). In fact, with the TYAM method, most of the increase in surface takes place using cork-oaks. Furthermore, if biodiversity-scenic values were inter-nalized, the amount of surface devoted to eucalyptus would be significantly smaller than the amount devoted to cork-oaks, even after internalizing carbon using either one of the accounting methods discussed in this paper (except for the CFM under high carbon prices). The rest of the article is organized as follows. Section2presents the model, Sect.3shows the materials and methods used in the application in the South-west of Spain, Sect.4contains the results of this application and, finally, Sect.5concludes.
2 The Model
We assume that the agent (forest owner) can choose between two types of forest, and that type 1 has greater biodiversity-scenic values while type 2 has greater carbon sequestration
4 In a review of the patterns and determinants of plant species diversity in Mediterranean-climate regions, Cowling et al.(1996) state that the highest diversity is found in heavily grazed shrublands and woodlands of the Mediterranean basin while the lowest is found in dense woodlands (here they use eucalyptus as an example). That is, a reforestation with eucalyptus may reduce species diversity compared to the previous situation in the Mediterranean basin. It is however fair to acknowledge that this does not hold in all regions and that this issue is not free of controversy (Carnus et al. 2006).
5 Nevertheless, we assume that visitors do not value the climate change mitigation impact of the reforestations.
potential. A typical example of this situation is when reforestation with a natural indige-nous species alternative (forest type 1) is compared with a fast-growing alien species (forest type 2). In the case study presented below, we compare reforestations with cork-oaks (type 1) and with eucalyptus (type 2) in the South-west of Spain.
Notations:L= total land available for reforestation; f0(t)= non-forest land at timet (‘pasture’ from now on); f1(t)= reforested land of forest type 1; f2(t)= reforested land of forest type 2. To simplify, we can eliminate f0(t)from the model by setting f0(t) = L− f1(t)− f2(t)and leavef1andf2as state variables. Obviously, ficannot have negative values. Nevertheless, for simplicity, we analyze the problem without explicitly incorporating this restriction and check afterwards our results for non-negativity.
Further notations:r= discount rate,ui(t)= total area reforested at timetof forest type i(i = 1,2)(control variables), andKi(ui)= reforestation cost for forest typei(i = 1,2), a function of the amount of land reforested in a given year. The control variableui(t)refers to the amount of new land devoted to forest (althoughucould imply a deforestation for some initial conditions, we will focus on situations where it implies reforestations, see below). We assumeKi′(ui) > 0 and Ki′′(ui) ≥0 (e.g., as specialized labor becomes scarce, salaries increase).
Finally, we defineFi(fi)(i = 0,1,2)as space-related functions showing the annual net return values for pasture (i = 0) or for each type of foresti(i = 1,2). We assume6Fi′ > 0 andFi′′≤0. These functions are supposed to have three terms:Fi(fi) = Wi(fi)+Ci(fi)+
Bi(fi). Where:Wi,CiandBirepresent annual net returns associated with current incentives (timber, cork, fire-wood, grazing resources rent, subsidies etc.), carbon sequestration and biodiversity-scenic values, respectively (we will discuss below the internalization of the lat-ter values). Current incentives (benefits obtained by the landowner) are further differentiated into market values (M) and subsidies (S). That isWi(fi) = Mi(fi) + Si(fi). We assume that the private land owner initially only considers current incentives, so that the relevant function isFiP0(fi) = Wi(fi), and that after carbon is internalized the private land owner will considerWandC(i.e.,FiP1(fi) = Wi(fi)+Ci(fi)). The social planner considers all three values but excludes subsidiesFiS(fi) = (Wi(fi) − Si(fi))+ Ci(fi) + Bi(fi) =
Mi(fi) +Ci(fi)+ Bi(fi)(although, as we will discuss below, current subsidies could be seen as an indirect indicator of environmental values).
Forest-related data are strongly time-dependent but, for modeling reasons, it is interest-ing to annualize them, makinterest-ing sure that investment incentives are not changed (Van Kooten 2000). That is, following Van Kooten we assume that, once a piece of land is converted, it stays in the new status, so that we can find an annualized value that is equivalent to the future stream of benefits associated with this type of land use.7This is the same assumption made inVan’t Veld and Plantinga(2005) and essentially the same as the assumption made in
Feng et al.(2002). Since we start in a situation where f1(0) = f2(0) = 0, this assumption is reasonable in empirical terms, since the high costs associated with a reforestation ensure that the conversion to a particular forest type is only worthwhile if the forests stays for a sufficiently long period of time.
Once a portion of land is devoted to forest, the owner chooses the rotation optimally, tak-ing into account the existtak-ing incentives (benefits). That is, he or she will follow Faustmann’s
6 This assumption implies that each species or type of use has different optimal growth areas, which is a
rea-sonable assumption in most cases. For large-scale reforestations, price effects can also explain this functional form.
7 Letz(t)be the real flow of net benefits associated with any of the values described above (z(t)could also
be broken down into quantity times price), the present value of the investment is:P Vz = 0∞z(t)e−r tdt.
54 A. Caparrós et al.
formula if only commercial values are considered; and the appropriate extension of this formula if carbon sequestration (Englin and Callaway 1993;Van Kooten et al. 1995), biodi-versity-scenic values (Hartman 1976) or carbon sequestration and biodiversity-scenic values are internalyzed (Caparrós et al. 2003). The model can thus be seen as having two stages: first, the optimal amount of land devoted to a given species is decided and then the optimal rotation. Solving this implies starting at the second stage (optimal rotation) and then moving on to the first stage. We will do this two-stage process in the application but, since the differ-ent variations to be done to Faustmann’s formula are already well understood (see Sect.3), we will assume here that the functionFi(fi)already describes optimal rotation values for each species. model itself, applying the model to the ‘afforestation and reforestation’ alternative within the Kyoto Protocol, we have to assume that f1(0) = f2(0) = 0,since only areas not covered by forests in 1990 are eligible.
Using the current-value Hamiltonian and dropping time notation, the Pontryagin maxi-mum principle conditions are:
Eqs.1and2and the transversality condition lim
t→∞e
−r tλ
i(t) = 0,i = 1,2.
is a concave function, since it is the sum of concave functions and convex functions (with a negative sign). In addition, the equations of motion for the state variables are linear in the control variables. Thus, the Mangasarian sufficient conditions will hold.
From Eq.3we can deduce:
λ1 = K1′(u1) (6)
λ2 = K2′(u2) (7)
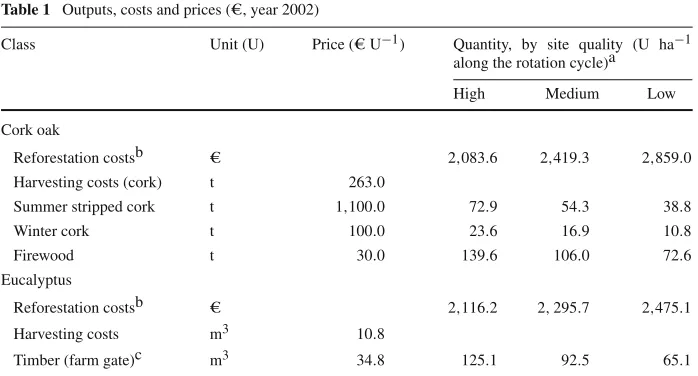
Table 1 Outputs, costs and prices (e, year 2002)
Class Unit (U) Price (eU−1) Quantity, by site quality (U ha−1 along the rotation cycle)a
High Medium Low
Cork oak
Reforestation costsb e 2,083.6 2,419.3 2,859.0 Harvesting costs (cork) t 263.0
Summer stripped cork t 1,100.0 72.9 54.3 38.8
Winter cork t 100.0 23.6 16.9 10.8
Firewood t 30.0 139.6 106.0 72.6
Eucalyptus
Reforestation costsb e 2,116.2 2,295.7 2,475.1
Harvesting costs m3 10.8
Timber (farm gate)c m3 34.8 125.1 92.5 65.1
Sour ceCampos et al.(2009) and own elaboration
a For cork oak regeneration felling starts after 144 years. If carbon sequestration is not taken into account the rotation length for eucalyptus is 10 years
b Reforestation costs vary with slope
c Timber volume is shown assuming no carbon payments
where:
F0′(L − f1 − f2) = −
∂F0(L − f1 − f2) ∂f1
= −∂F0(L − f1 − f2)
∂f2
Taking Eqs.8and9together we have:
F1′(f1)
r − K
′
1(0) = F2′(f2)
r − K
′
2(0) =
F0′(L − f1 − f2)
r (10)
The interpretation of Eq.10follows conventional lines. In the steady-state equilibrium, the stream of net revenues associated with the reforestation of one additional hectare of forest type 1 has to be equal to the revenues associated with one additional hectare reforested with forest type 2, and to the revenues associated with the use of that hectare as pasture. In the Sect.6we show that the rest point determined by these two FOC is a saddle point.
5
6
A
.
C
ap
ar
ró
s
et
al
.
Table 2 Parameters of the growth functions for different site qualities
Sites of quality Eucalyptus (timber) R2 Cork oak (carbon sequestration)a R2
Parameters Parameters
k a b k a b
High 2.5062 (0.3996) 2.0757 (0.0857) 0.0835 (0.0048) 0.995 0.9623 (0.3600) 1.0467 (0.0967) 0.0060 (0.0007) 0.651
Medium 1.8528 (0.2955) 2.0757 (0.0857) 0.0835 (0.0048) 0.995 0.8157 (0.2800) 1.0241 (0.0891) 0.0060 (0.0007) 0.667 Low 1.3047 (0.2081) 2.0757 (0.0857) 0.0835 (0.0048) 0.995 1.0223 (0.3558) 0.8106 (0.0897) 0.0032 (0.0006) 0.679
Standard errors are shown in brackets a Aβof 0.2 is assumed
have:
Fi = ai0 +ai1fi + (1/2)ai2fi2, (i = 0,1,2) Fi′ = ai1 +ai2fi > 0, ∀fi≥0⇒ai1 > 0 Fi′′ = ai2≤0 ⇒ ai2 ≤0
Fi ≥ 0, ∀fi ≥0 ⇒ ai0≥0
For reforestation costs we setki1 > 0,ki0≥0 andki2 ≥0(i = 1,2), sinceKi′(ui) > 0 andKi′′(ui)≥0:
Ki = ki0 + ki1ui +(1/2)ki2u2i (i = 1,2)
We further assume that for each speciesai1 − r ki1 > 0(i = 1,2), that is, that the marginal benefit for the first unit planted is higher than the opportunity cost of the refores-tation cost (otherwise this particular species is irrelevant for the area). In addition, we have (assuming that net subsidies per hectare are constant):
Fi = Wi + Ci + Bi = (Mi + Si)+ Ci + Bi
Wi = wi0 +wi1fi +(1/2)wi2fi2 Mi = mi0 + mi1fi + (1/2)mi2fi2
Si = si1fi
Ci = ci0 +ci1fi + (1/2)ci2fi2 Bi = bi0 + bi1fi + (1/2)bi2fi2
Thus,ai j = wi j + ci j +bi j. The FOC are now:
a11 + a12f1 −r k11 = a01 +a02(L − f1 − f2) (11) a21 + a22f2 −r k21 = a01 +a02(L − f1 − f2) (12)
Solving for f1and f2and rearranging:
f1∗ = a02[(a11 −r k11)− (a21 − r k21)] + a22[(a11 −r k11) − (a01 + a02L)] −a12a22 − a12a02 − a02a22
(13)
f2∗ = a02[(a21 −r k21)− (a11 − r k11)] + a12[(a21 −r k21) − (a01 + a02L)] −a12a22 − a12a02 − a02a22
(14)
Sinceai2 ≤ 0, the denominator is negative (to ensure that the denominator is not null, we assume that at least two of the elementsai2 = 0, (i = 0,1,2)). In the numerator all the terms in brackets are positive. The second square bracket in each expression should be positive, since it is the difference between the net marginal benefit for the first unit of land (the best) with one of the forest species and the marginal benefit for pasture for the last unit of land (L). If this difference is not positive, no reforestation will occur at all for this particular species. The first square bracket will be positive for one species and negative for the other. Let us suppose that(a11− r k11) > (a21 −r k21), i.e., that the net marginal benefit for the first unit of land is higher with species 1 than with species 2. In this case, the first square bracket will be positive for f1and negative for f2. This will ensure a positive value for f1. For a positive value of f2we would need:
58 A. Caparrós et al.
That is, the difference between the marginal benefit of the first unit of land with species 2 and the marginal benefit with pasture for the last unit (multiplied by the term indicating the variation in the marginal value of species 1) must be larger than the difference between the first unit of land with each one of the two forest species (multiplied by the term indicating the variation in the marginal value for pasture).
Assuming that current incentives (benefits obtained by the landowner) are relatively sim-ilar between species 1 and 2 (F1P0(f1) ≃ F2P0(f2)), that species 1 has higher marginal values for biodiversity and species 2 has higher marginal values for carbon sequestration, it is easy to show that we might have a situation where future market forces (timber plus carbon, i.e.,FiP1(fi)) favor species 2 while present market forces equalize the amounts of both species, and social benefits (timber, carbon sequestration and biodiversity-scenic values, i.e.,FiS(fi)) would favor species 1 (Caparrós et al. 2007). In addition, biodiversity-scenic values (especially scenic values) are local by their nature while carbon sequestration benefits are global. Thus, implementing an incentive for carbon sequestration might, in this particular case, imply a stress on local social benefits. However, this discussion does not allow us to say if this situation is relevant in the real world. Thus, in the next sections we will apply the model just described to a multiple-use forest in Spain.
3 Application: Materials and Methods
We will now apply the model to the Alcornocales Natural Park (ANP), which is located in the South-west of Spain. This Natural Park has an extension of about 170,000 hectares and is partially covered by cork-oaks, which have suffered a deplation and degradation process in the last decades. Forests (mainly cork-oaks) cover currently about 53% of the total surface of the area and eucalyptus have also been used in the past in this area for reforestations.8Since we are analyzing the ‘afforestation and reforestations’ alternative within the Kyoto Protocol, we have to focus on areas that were not covered by trees in 1990. This leaves us with about 80,000 hectare.
We are going to compare reforestations with cork-oaks and with eucalyptus on pasture-land. The first species is an extremely slow-growing species which yields a highly diverse ecosystem when mature (up to 135 plant species per 1,000 m2), and which is a key element of the Mediterranean forest, one of the hot-spots for biodiversity in the world (Huntsinger and Bartolome 1992). Eucalyptus, on the other hand, is a fast-growing species (with rotations of about 10 years) and yields more a plantation than a true forest. In addition, with current economic incentives, both species are more or less as attractive to the forest owner, so that it is a good example for studying the changes in existing incentives brought forward by the internalization of carbon sequestration. In most of the discussion below we use a discount rate of 5%, although we analyze the sensitivity of our results to the discount rate.
3.1 Growth and Yield Functions
The empirical illustration focuses on cork oak (Quercus suberL.) and eucalyptus (Eucalyptus globulusLabill.) plantations in the Alcornocales Natural Park (South-west of Spain). We use
8 Right now new plantations with eucalyptus are not allowed in this area (ANP) due to environmental
restric-tions. Within our model this implies that, taking into account the values forWandB, the government has decided to preclude the use of eucalyptus, but not using market incentives. We are thus studying the impact of relaxing this environmental constraint. Alternatively, our results can be seen as applying to areas where this environmental contraint is not in place.
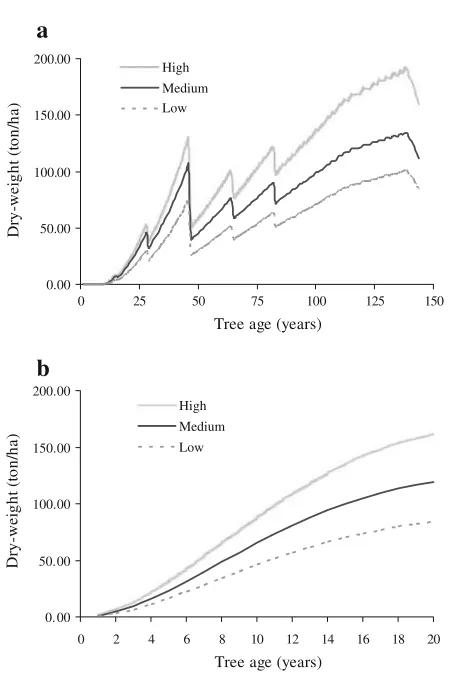
0.00
Fig. 1 Biomass growth functions for cork-oaks (a) and eucalyptus (b) for three site-qualities (including
above-ground and root biomass)
growth functions for three site qualities (high, medium and low). For analytical convenience we assume that cork-oak and/or eucalyptus afforestation projects lead to permanent forest. Thus, we analyze an infinite sequence of rotations.
3.1.1 Cork-Oak
Cork oak growth functions are taken fromMontero et al.(2009), see Fig.1a. The rotation length and the thinning treatments for cork-oaks are exogenously given. The reason is that cork (bark) is its main output (extraction does not imply tree felling) and the stripping rota-tion corresponds to the time required for reaching natural cork stopper thickness (Montero et al. 2009).9Commercial revenues and costs, including reforestation costs, are taken from
Caparrós et al.(2007) andCampos et al.(2009) and are based on local market prices and in-depth interviews to forestry enterprises in the region. Table1shows the main prices and costs used (the thinning and stripping program assumed is very complex and Table1only
60 A. Caparrós et al.
shows some summary indicators, seeCampos et al. 2009for details). This allows us to esti-mate three points for commercial values, one for each site-quality. Since we do not know the precise surface covered by each of these site-qualities, we have assumed that one-third of the area is of each quality.10We use this information to estimate a quadratic function for com-mercial values [functionM1(f1)in Table3], which depends on land surface. In addition, we define functionSas covering current net subsidies (subsidies minus taxes). Since subsidies are larger than taxes11the function is essentially determined by the per-hectare subsidy for reforestations [i.e.,S1(f1) = si1f1]. Reforestations costs have also been taken fromCampos
et al.(2009) and the functionK(i)has also been estimated using three point estimates, one for each site-quality. However, our value forki2 is not very reliable since for reforestation costs the variability with the area covered does not really depend upon site-quality but on terrain slope (see Table1).
For carbon, the specific site carbon sequestration function is estimated considering Mon-tero et al.(2006) functions that relate cork oak diameter at breast height to different biomass fractions’ dry weight (trunk, branches, leaves and roots), the carbon content in cork oak bio-mass (φ=0.472) and the number of standing cork trees along the cork oak rotation cycle. We have estimated directly a per hectare carbon sequestration function, with the formci(t) = k taci e−bcit(subscriptc stands for cork-oak andiindexes the quality of the site). The values of the parameters for each site-quality can be found in Table2. As before, we obtained the quadratic functions related to the land area covered using the three point estimates obtained for the different site-qualities (equationsCin Table3). Although we will use higher carbon prices in some points of our discussion, we will focus on the impact of carbon prices ranging between 0eand 70et/C (about 20et/CO2). This covers the price range that has been historically observed in the different emerging carbon trading schemes. Future prices might be significantly higher according to simulation models, so that the range analyzed can be seen as conservative.
3.1.2 Eucalyptus
Eucalyptus growth functions are our own estimations based on data provided by SILVASUR12 for permanent inventory plots in the Sierra of Huelva (also in the South-west of Spain). We used the estimations of timber volume by age produced by SILVASUR using Chapman-Rich-ards’ model as adapted byGarcía(1983). Since we wanted to use a simple growth function for optimization purposes, we adjusted these results to the following functional form:vi(t) = k taei e−beit,wherev
i is the timber volume per hectare measured in m3, subscriptestands for eucalyptus andiindexes the quality of the site (i =high, medium, low). The values of the parameters for each site-quality can be found in Table2and Fig.1b plots this informa-tion. The rotation (T) is optimized using the standard Faustmann formula, i.e., maximizing P VE = PFv(T)e−r T/(1−e−r T). Commercial data and reforestations costs were provided by IBERSILVA (see Table1).
Carbon sequestration at any moment in time is given byαv′(t), whereαis the carbon content in eucalyptus biomass (α = efφ),ef an expansion factor from timber biomass to total biomass (including roots) andφthe tons of carbon per m3of timber biomass. We use a carbon content factor (φ) of 0.20 for eucalyptus and an expansion factor of 1.5.
10 We also assume that all areas not covered by forests meet the Kyoto requirements, i.e., not being forests
in 1990.
11 Taxes vary with production and therefore with site-quality, but the differences were too small to estimate
quadratic functions.
Sequestration
w
ith
Reforestations
and
B
iodi
v
ersity-scenic
V
alues
61
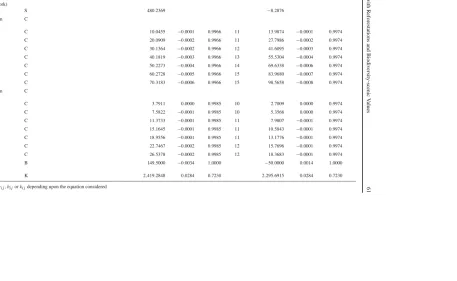
Table 3 Parameters estimated for the quadratic functions (euros/ha)
Description Function Pasture Quercus Eucalyptus
x01a x02 R2 x11 x12 R2 T (years) x21 x22 R2
Current incentives W 140.0000 −0.0011 250.1451 −0.0014 10 258.2849 −0.0022
Commercial (Timber, firewood and/or cork)
M 140.0000 −0.0011 1.0000 −230.0918 −0.0014 0.9568 266.5725 −0.0022 0.9974
Net subsidies S 480.2369 −8.2876
Carbon sequestration (CFM)
C
Price 10e/tC C 10.0455 −0.0001 0.9966 11 13.9874 −0.0001 0.9974
Price 20e/tC C 20.0909 −0.0002 0.9966 11 27.7986 −0.0002 0.9974
Price 30e/tC C 30.1364 −0.0002 0.9966 12 41.6095 −0.0003 0.9974
Price 40e/tC C 40.1819 −0.0003 0.9966 13 55.5304 −0.0004 0.9974
Price 50e/tC C 50.2273 −0.0004 0.9966 14 69.6338 −0.0006 0.9974
Price 60e/tC C 60.2728 −0.0005 0.9966 15 83.9680 −0.0007 0.9974
Price 70e/tC C 70.3183 −0.0006 0.9966 15 98.5658 −0.0008 0.9974
Carbon sequestration (TYAM)
C
Price 10e/tC C 3.7911 0.0000 0.9985 10 2.7009 0.0000 0.9974
Price 20e/tC C 7.5822 −0.0001 0.9985 10 5.3568 0.0000 0.9974
Price 30e/tC C 11.3733 −0.0001 0.9985 11 7.9807 −0.0001 0.9974
Price 40e/tC C 15.1645 −0.0001 0.9985 11 10.5843 −0.0001 0.9974
Price 50e/tC C 18.9556 −0.0001 0.9985 11 13.1776 −0.0001 0.9974
Price 60e/tC C 22.7467 −0.0002 0.9985 12 15.7696 −0.0001 0.9974
Price 70e/tC C 26.5378 −0.0002 0.9985 12 18.3683 −0.0001 0.9974
Biodiversity-scenic values
B 149.5000 −0.0034 1.0000 −50.0000 0.0014 1.0000
Reforestation costs K 2,419.2848 0.0284 0.7230 2,295.6915 0.0284 0.7230
ax
ij=wij,mij,sij,ci j,bi jorki jdepending upon the equation considered
62 A. Caparrós et al.
As before, this information allows us to obtain three points (one for each site-quality) for commercial values, reforestation costs and carbon sequestration (net subsidies are again constant for the three site-qualities). As for cork-oak, we fit quadratic functions using these three point estimates to obtain the equations shown in Table3.
3.2 Carbon Accounting Methods
Carbon sequestration revenues are estimated considering two alternative carbon accounting methods: carbon flow and ton year accounting (we will note the carbon accounting method used in the superscript, e.g., FiP1(C F M)(fi)). In both cases, we assume that the rotation for eucalyptus is optimized taking into account the carbon incentives while the rotation for cork-oaks stays constant.
3.2.1 Carbon Flow Method
As mentioned above, the CFM assumes that landowners get paid as carbon is sequestered by biomass growth and pay when carbon is released through harvesting. The amount of carbon released by harvesting depends on the final use of timber.Van Kooten et al.(1995) suggest introducing a parameter (β) that represents the fraction of timber that is harvested but goes into long-term carbon storage structures and landfills (this is the main difference withEnglin and Callaway(1993), who assume a decay function). We use a central value forβof 0.2.
The present discounted value (PV) of the net benefits from carbon sequestration and timber over all future rotations of eucalyptus at fixedT intervals is (Van Kooten et al. 1995):
P VC F M =
PFv(T)e−r T − Pcα (1 − β) v(T)e−r T + Pcα T
0
v′(t)e−r tdt
(1 − e−r T)
the first term refers to the value of timber, the second to the price paid for carbon released and the third to the carbon benefits that forest owners get from carbon that is removed from the atmosphere.PFis the net price of timber per cubic meter,PCrepresents the value of the credit/tax per carbon ton that is removed from, or released into, the atmosphere. The FOC for the problem focused on the optimization of the rotation length for eucalyptus is:
(PF + Pcαβ)v′(T) = r (1 −e−r T)
×
(PF + Pcαβ)v(T) +r Pcα
T
0
v(t)e−r tdt
−r Pcαv(T).
For cork oak, we estimated year-to-year carbon uptake and release based on the equation ci(t)described above, assuming that a fractionβof extracted biomass goes into long-term carbon storage structures.
3.2.2 Ton Year Accounting Method
For the TYAM, we assume that the government (or a third party via an emission trading system) diverts to growers carbon credits adjusted on the basis of the equivalence factor (ε) from sequestering 1 CO2ton in the forest biomass for one year. This equivalence factor is estimated based on the cumulative radiative forcing of an emission of CO2over a 100-year
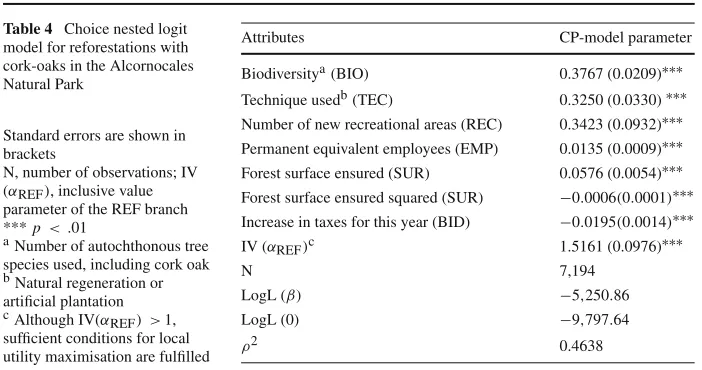
Table 4 Choice nested logit
Biodiversitya(BIO) 0.3767 (0.0209)∗∗∗ Technique usedb(TEC) 0.3250 (0.0330)∗∗∗ Number of new recreational areas (REC) 0.3423 (0.0932)∗∗∗ Permanent equivalent employees (EMP) 0.0135 (0.0009)∗∗∗ Forest surface ensured (SUR) 0.0576 (0.0054)∗∗∗ Forest surface ensured squared (SUR) −0.0006(0.0001)∗∗∗
time horizon.Moura-Costa and Wilson(2000) estimateεto be 0.0182tCO2. We get the following expression for the present value:
P VT Y AM =
where the second term of the RHS represents the carbon benefits that forest owners get for having carbon sequestered in their forest (the TYAM does not imply any reimbursement of carbon credits upon harvest). In fact, this method yields a similar result toHartman(1976) formula since the standing forest has a value. The FOC used to determine the optimal rotation for the eucalyptus is now (Cunha-e-Sá and Rosa 2006):
PFv′(T) + Pcαεv(T) =
For estimating carbon benefits in the case of cork oak, we used again the functionci(t) described above, and the equivalence factorε.
3.3 Stated Preferences Survey
64 A. Caparrós et al.
Table4shows the model (CP-cork-oak model) estimated based on a choice experiment13 done to value reforestations with cork-oaks14(seeCaparrós et al. 2008for details). The data
are analyzed using a nested logit model, since the IIA hypothesis was violated (McFadden 1981). We use the CP-cork-oak model to estimate the median willingness to pay for a refor-estation using cork-oaks (usingKrinsky and Robb’s(1986) bootstrapping technique); setting all the attributes but the surface constant. We then estimate the total revenues that could be obtained if the relevant population (visitors) pays the additional tax. That is, we are assuming that the tax would be set at the limit accepted by 50% of the population but that all the population (visitors) would pay the tax (a one-time payment). The quadratic functions (Bi in Table3) are easy to estimate since the surface reforested enters explicitly in the function estimated using the nested logit model, although an appropriate change of scale is required given the wording [we assume one autochthonous species (cork-oak), artificial reforestation, no recreational areas and no additional employment].
Following the choice experiment, half15of the interviewees were asked, using an open-ended contingent valuation, about their willingness to pay (WTP) to avoid a reforestation with eucalyptus (CV-eucalyptus model). We made two different questions: one to reforest the equivalent of 20% of current forest surface16and one to reforest 40% of current surface.17 For the first question we obtained a median of 15e, a mean of 24.21eand a standard deviation of 61.73 and for the second question we obtained a median of 20e, a mean of 29.68eand a standard deviation of 88.65 (the total number of valid answers was 408 in both cases). We estimate the quadratic function (Table3) based on the two points estimates for the median given by the subsequent questions (assuming, in addition, that the function passes through the origin).
These values for eucalyptus are arguably the less reliable values obtained with the differ-ent valuation techniques used since: (1) they were made after the choice experimdiffer-ent, (2) each respondent faced two different CV questions for two different amounts of land, and (3) we had to use a relatively ‘strange’ wording: WTP to avoid a reforestation with eucalyptus. The reason for the first two caveats was that the choice experiment was actually the main part of the study and we did not want to further complicate the design of our survey instrument (asking only a subsample about each amount of land reforested). The main reason for the wording was that we wanted an estimation of the money that could be made available to compensate forest owners for not using their (hypothetical) right to plant eucalyptus (the percentage of visitors opposing a reforestation with eucalyptus shown above for the main survey was already observed in the pretest). In addition, our focus group and our pre-test had shown that a WTA question for reforestations with eucalyptus was not well understood or not taken seriously. Although the CV-eucalyptus model has several caveats, the results are probably conservative since: (1) open-ended questions tend to yield lower values, (2) presenting the question after the choice experiment probably yielded lower values due to a
13 450 questionnaires were done as a choice experiment and 450 as a ranking experiment. The latter were
then recoded as a choice since we found no differences between the two samples (Caparrós et al. 2008). Table2
shows the estimations for the pooled model.
14 We did not include eucalyptus in the choice experiment because according to our pre-test interviewees
saw reforestations with eucalyptus as negative, so that a willingness to pay question made no sense.
15 The other half were asked about their WTP for a reforestation with cork-oaks using a CV format. 16 This was described as needed to counteract current deforestation trends (as in the choice experiment). 17 The wording used was: “What would be the maximum amount that you would be ready to pay more
this year as taxes to avoid a reforestation with eucalyptus that would increase the forest area in 20%? (please assume that only eucalyptus are used, that artificial plantation is used, that no recreational areas are created and that employment remains constant)”.
‘giving fatigue’ and (3) the WTP to avoid-the-reforestation question is more conservative than the corresponding WTA question.
4 Results
4.1 Adding Carbon Sequestration to Current Incentives
We will start by focusing on the current economic incentives for reforestation and on those that will probably be implemented in the near future to take into account carbon sequestra-tion. Currently, the forest owner focuses on commercial values and on net subsidies (subsidies minus taxes) from the government. Subsidies are actually very important in the area under consideration since the Spanish government, within the framework of the EU Common Agri-cultural Policy reforms, has established a strong incentive for afforestations (applicable to cork-oaks but not to eucalyptus). These are considered environmentally-friendly subsidies and are not likely to disappear in the near future.18If these subsidies were set optimally, they should already incorporate the carbon and biodiversity-scenic values discussed above.19
Nev-ertheless, this perfect internalization is probably not a realistic assumption. Hence, we will discuss our results taking out these subsidies (to avoid any double counting) but also keeping the current subsidies. The latter is probably the most relevant scenario, since it is unlikely that the current subsidies for cork-oaks would be eliminated if a general scheme to internalize carbon would be established.
The first relevant message that comes out from our application is that, without the current subsidies, no reforestation with cork-oaks would take place, even if carbon sequestration is integrated. With the CFM, a carbon price of more than 400et/C (about 110et/CO2) would be necessary to see some reforestation with cork-oaks; with the TYAM, the carbon price would need to be even higher. That is, for reasonable carbon prices(a11−r k11) > (a01 +a02L) does not hold, and this was a necessary assumption made in the previous section to show that f1∗ > 0. Thus, current subsidies are necessary to make cork-oaks a meaningful alternative for landowners.
To study the impact that carbon sequestration incentives would have on eucalyptus if the current incentives for cork-oak did not exist (i.e., in a situation where cork-oaks are not a meaningful alternative) we need to set up a model with only one species. Since this is essen-tially the same model as inVan Kooten(2000), although with quadratic functions, we will not develop the analytic part here. In applied terms, this would yield an equilibrium with 61% of the surface devoted to eucalyptus with the CFM method and 44% with the TYAM, with a price of 50et/C.
For the more realistic scenario where current incentives for cork-oaks coexist with addi-tional incentives for carbon sequestration, we start by studying a situation were eucalyptus are
18 In the whereas (29) of the Council Regulation 1257/1999 (OJEC 1999) it is said that “in the coming years,
a prominent role should be given to agri-environmental instruments to support the sustainable development of rural areas and to respond to society’s increasing demand for environmental services”.
19 In the whereas (38) of the Council Regulation 1257/1999 (OJEC 1999) it is said that “the afforestation
66 A. Caparrós et al.
1 ( )
u ha
1 0
f isocline
1 0
u isocline
8816
1(ha)
f
-+
-+7715 7048
31701
44637
20000 40000 60000 80000
37120
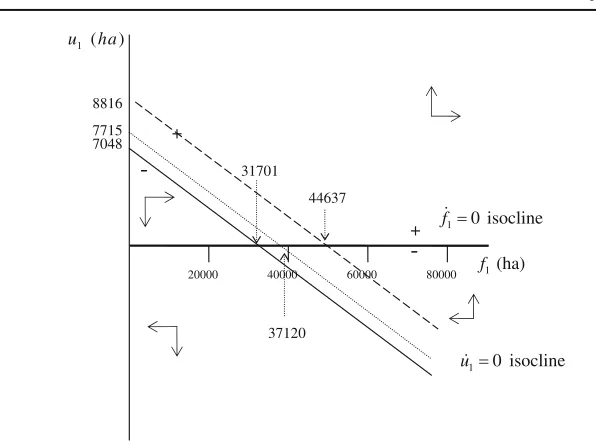
Fig. 2 Phase-diagram for reforestations with cork-oaks. For theu˙1 = 0 isocline the full line is with
com-mercial values plus subsidies; the dashed line adds carbon sequestration values internalized using the CFM method; and the dotted line adds carbon sequestration values internalized using the TYAM method. Carbon price: 50et/C
banned due to environmental regulations and then analyze the impact of allowing competition with eucalyptus.
Figure2shows the phase diagram20when only reforestations with cork-oaks are allowed, without any carbon price and with a carbon price of 50et/C internalized with the two methods considered (CFM and TYAM). As can be seen, internalizing carbon sequestration essentially implies shifting outwards theu˙ = 0 isocline, and this will increase the number of hectares reforested per year and increase the steady-state value of the surface devoted to cork-oak. That is, if we add carbon sequestration incentives to current subsidies and ban eucalyptus, the cork-oak area will increase significantly.
We now turn to our main model and allow for competition with eucalyptus. As Fig.3a shows, with the current incentives [market values plus net subsidies and a carbon price equal to zero, i.e.,FiP0(fi)], the equilibrium quantities21imply a considerable increase in the sur-face devoted to eucalyptus, although the sursur-face devoted to cork-oak is actually larger than the surface devoted to eucalyptus (28% of the surface would be covered with cork-oaks and 26% with eucalyptus). That is, if we keep the current subsidies we are actually in a situation
20 For this problem with only one species, the steps to draw the phase diagram are essentially the same
as inVan Kooten(2000). Let us just add that the f˙=0 isocline follows the f1 axis (see Caparrós et al. 2007) and that theu˙=0 isocline intersects theu1 axis at(a11−r k11k)12−a01−a02L and the f1axis at
(a11−r k11)−a01−a02L
−(a12+a02) .
21 While the equilibrium value is not affected by the value ofk
i2(the parameter describing how reforestation
costs per ha increase with surface), as shown in Eqs.13and14, the amount of land reforested each year is highly sensitive to this parameter (which is not well known in our application, as discussed above). Given this sensitivity and the imposibility of drawing phase diagrams when both species are considered (with decreasing marginal values for pasture), we have decided to focus on equilibrium values (see, however, the analysis in
Caparrós et al. 2007for the case of constant marginal values for pasture)
20 25 30 35 40 45 50 55
0 10 20 30 40 50 60 70
Carbon price (euro / t C)
P
ercenta
g
e of s
u
rface
0 5 10 15 20 25 30 35 40 45 50 55
0 10 20 30 4
Carbon price (euro / t C)
P
ercenta
g
e of s
u
rface
0 50 60 70
Cork-oak (1) - CFM Eucalyptus (2) - CFM
Cork-oak (1) - TYAM Eucalyptus (2) - TYAM
a
b
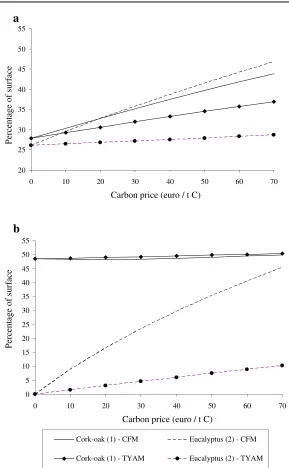
Fig. 3 Equilibrium values of surface reforested with cork-oaks and eucalyptus for different carbon prices (for
the CFM and the TYAM). Cork-oak and eucalyptus biodiversity-scenic values for visitors are not internalized inaand internalized as discussed in the text inb
that is very close to the one assumed at the end of Sect.2(i.e., that the equilibrium ratio between the two species is close to one for a carbon price equal to zero).
68 A. Caparrós et al.
assume that the silviculture for cork-oaks is not changed). Figure3a shows the equilibrium quantities devoted to cork-oak and eucalyptus for different carbon prices. As shown, with a price of 50e/t C (14e/t CO2), almost all the surface available is devoted to forest (40% cork-oaks and 41% eucalyptus).
If the incentive for carbon sequestration is set up using the TYAM method [FiP1(T Y AM)(fi)], the forest surface also increases, although less; with the price of 50e/t C considered, for-ests cover 62% of the surface (see Fig.3a). Nevertheless, the major difference is that now the increase in forest surface takes place using mainly cork-oaks (with the 50e/t C price, cork-oaks cover 35% of the surface while eucalyptus cover 28%). In addition, it has to be taken into account that these results are for the particular equivalence-factor estimated by
Moura-Costa and Wilson(2000):ε = 0.0182.This implies, in our case, that less money goes into the area due to the internalization of carbon sequestration (compared to the CFM). To have the same amount of money going into the area, the equivalence factor had to be set equal to 0.04.22In this case, for a carbon price of 50e/t C up to 41% of the area is reforested with cork-oaks (30% is covered by eucalyptus).
4.2 Adding Visitors’ Preferences
We have estimated biodiversity-scenic values, only for visitors to the ANP, using stated pref-erence techniques. Our approach arguably estimates mainly scenic values, although these values are probably difficult to separate from the biodiversity values perceived by visitors as associated with the ecosystem favored by species like cork-oaks (this is the reason why we use the term biodiversity-scenic values).
As in the last section, we acknowledge that there is a potential risk for double-counting since one of the reasons for the current subsidies for cork-oak reforestations are biodiversity-scenic values. Nevertheless, current subsidies are not at all related to the number of visitors and can be applied to any area, so that they should mainly incorporate option and passive use values and not direct active use values by recreational visitors. Thus, adding values estimated for visitors should not imply double counting.
Taking into account these biodiversity-scenic values, but taking out current subsidies, a carbon price of 260et/C (about 70et/CO2) would be needed to start seeing reforestations with cork-oaks using the CFM method [i.e., using a strict definition ofFiS(C F M)(fi)]. The carbon price must be even higher with the TYAM (FiS(T Y AM)(fi)). Thus, as before, with the carbon price-range between 0eand 70et/C (about 20et/CO2), only reforestations with eucalyptus would take place.
Figure3b shows the impact of the internalization of the biodiversity-scenic values on the results shown in Fig.3a if the current subsidies are maintained [i.e., assuming that current subsidies measure other environmental values not considered in this application and should therefore be added toFiS(C F M)(fi)andFiS(T Y AM)(fi)]. As shown, the equilibrium values for cork-oaks are much higher, even without any value for carbon sequestration. As a result, none of the mechanisms for carbon internalization (CFM or TYAM) imply much additional reforestations with cork-oaks, while the CFM would still imply a strong increase in the surface devoted to eucalyptus.
22 The precise value of the equivalence factor is highly controversial. In addition, and as stated in the
intro-duction, we are using the TYAM as an example of different accounting methods where the forest owner gets paid for the standing carbon (not for growth).
0
Fig. 4 Sensitivity of equilibrium values of surface reforested with cork-oaks and eucalyptus to discount rates
under total or partial internalization of different environmental values (carbon price: 50et/C)
0
beta-values epsilon-values
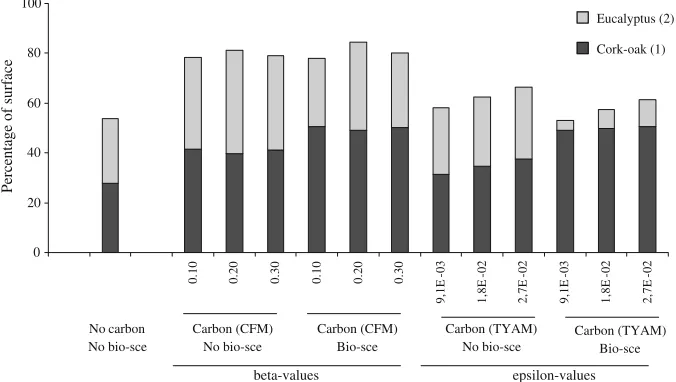
Fig. 5 Sensitivity of equilibrium values of surface reforested with cork-oaks and eucalyptus to beta (β)and
epsilon (ε)values under total or partial internalization of different environmental values (carbon price: 50et/C)
4.3 Sensitivity Analysis
To perform a sensitivity analysis, we first take out the negative value estimated for the refor-estations with eucalyptus. The general shape of Fig.3b remains unchanged, but with more eucalyptus and slightly less cork-oaks (for a zero carbon price, 45% of the surface is refor-ested with cork-oaks and 20% with eucalyptus). If we take the biodiversity-scenic value for cork-oaks out (and keep the value for eucalyptus), the shape is still very similar, but starting with 33% of cork-oaks and 15% of eucalyptus for a zero carbon price. In all three cases the most remarkable change with the carbon price is the increase in the share devoted to eucalyptus with the CFM.
70 A. Caparrós et al.
central value shown is the one used in the discussion above. Although our detailed results are obviously sensitive to the parameters considered, the main message discussed above, and summarized in the conclusions below, remains unchanged.
5 Conclusion
This paper has presented an optimal control model to analyze reforestations with two different species, including the analysis of commercial values, carbon sequestration values and bio-diversity-scenic values. We have discussed the implications of partial or total internalization of environmental values (i.e., carbon sequestration and biodiversity-scenic values), showing that internalizing only carbon sequestration may have negative impacts on biodiversity-scenic values. Nevertheless, the practical relevance of this result can only be determined through applications and we have therefore applied the model to reforestations in the South-west of Spain, comparing reforestations with cork-oaks and reforestations with eucalyptus. We have compared the equilibrium outcomes with two different carbon crediting methods: the CFM and the TYAM; showing that, with both methods, the forest surface increases, although this increase is more relevant with the CFM method. However, we have also shown that, with the CFM method, the increase in forest surface takes place essentially using eucalyptus while, with the TYAM, the increase takes place using mainly cork-oaks. Our results have also shown that visitors value reforestations with cork-oaks positively while they consider that reforestations with eucalyptus have a negative impact on their welfare. Furthermore, we have shown that, if biodiversity-scenic values (for visitors) were internalized, the equilibrium values would imply a significantly larger amount of surface devoted to cork-oaks than the amount devoted to eucalyptus (except for high carbon prices internalized using the CFM).
The implications of our results are that, if biodiversity-scenic values are properly inter-nalized, neither the CFM nor the TYAM will, by definition, yield a sub-optimal outcome. However, if biodiversity-scenic values are not fully internalized by markets, as is the case, it may be better to use a more conservative method like the TYAM, which will increase less forest surface but which will not favor fast-growing alien species such as eucalyptus in the South-west of Spain.
6 Appendix
To find the dynamic path, we derive Eqs.6and7with respect to time and substitute in Eq.4
(respectively Eq.5):
˙
u1 =
r K1′(u1) − F1′(f1) − F0′(L − f1 − f2)
K1′′(u1)
(15)
˙
u2 =
r K2′(u2) − F2′(f2)− F0′(L − f1 − f2)
K2′′(u2)
(16)
Dockner(1985) gives necessary and sufficient conditions for a system with two state vari-ables to have a saddle point (assumingr ≥0). These conditions imply (1)D < 0 and (2) 0 < |JE| ≤(D/2)2, whereDis as defined below and|JE|is the determinant of the Jacobian matrix of the system evaluated at the equilibrium point; and are necessary and sufficient for the eigenvalues of|JE|to be real, two being positive and two being negative.
Since∂f˙i
∂ui = 1,the determinant of the Jacobian matrix for the system formed by Eqs.1,2,15and16evaluated at the equilibrium point gives:
|JE| = ∂u˙1
D is defined as follows (Dockner 1985);
D=
∂f1 and this inequality is always satisfied. Thus, the system will have a saddle-point, the best kind of stability that we can expect in this type of two state-var-iable dynamic systems (Dockner 1985). A graphical analysis of this system is not possible without additional assumptions and we will not develop it here (see, however, the analysis inCaparrós et al.(2007) for the case of constant marginal values for pasture).
Acknowledgments We wish to thank Jose Luis Oviedo, Jean-Christophe Pereau, Lynn Huntsinger, Paulo
Nunes, Werner Hediger and participants to workshops in Trieste, Montreal and Thesalonika and seminars in Vienna, Berkeley, Sevilla and Castellón for useful comments. Financial support from the European Com-mission (project TRANSUST.SCAN), the Spanish CICYT (project DYNOPAGROF) and the BBVA (project APEA) is gratefully acknowledged. We also thank IBERSILVA for the data provided. Alejandro Caparrós was visiting UC Berkeley with a grant from the MEC (Spain) while finishing this research.
References
Boletin Oficial del Estado (BOE) (2001) Real Decreto 6/2001, de 12 de enero, sobre fomento de la forestación de tierras agrícolas. BOE 12(13.1.2001):1621–1630
Campos P, Daly-Hassen H, Ovando P (2007) Cork-oak forest management in Spain and Tunisia: two case studies of conflicts between sustainability and private income. Int For Rev 9(2):610–626
Campos P, Ovando P, Oviedo JL, López E, Montero G (2009) Economía privada de la forestación con alcorno-ques y la regeneración natural del alcornocal en el Parque Natural Los Alcornocales (Cádiz - Málaga). In: Zapata-Blanco S (eds) Alcornocales e industria corchera: Hoy, Ayer y Mañana. Museu del Suro de Palafrugell, Palafrugell, Spain (Forthcoming)
Cunha-e-Sá MA, Rosa R (2006) Impact of carbon accounting methods on optimal forest management: an application to the Portuguese eucalyptus forest. II AERNA Congress, Lisbon (2–3 June)
Caparrós A, Campos A, Martín D (2003) Influence of carbon dioxide abatement and recreational services on optimal forest rotation. Int J Sustain Dev 6(3):345–358
Caparrós A, Cerdá E, Ovando P, Campos P (2007) Carbon Sequestration with reforestations and biodiversity-scenic values. FEEM Working Paper 28.2007, Milan
Caparrós A, Oviedo JL, Campos P (2008) Would you choose your preferred option? Comparing choice and recoded ranking experiments. Am J Agricult Econ 90(3):843–855
Caparrós A, Jacquemont F (2003) Conflicts between biodiversity and carbon offset programs: economic and legal implications. Ecol Econ 46:143–157
Carnus J-M, Parrotta J, Brockerhoff E, Arbez M, Jactel H, Kremer A, Lamb D, O’Hara K, Walters B (2006) Planted forests and biodiversity. J For 104(2):65–77
Cowling RM, Rundel PW, Lamont BB, Arroyo MK, Arianoutsou M (1996) Plant diversity in mediterranean-climate regions. Trends Ecol Evol 11(9):362–366
Dockner E (1985) Local stability in optimal control problems with two state variables. In: Feichtinger G Opti-mal control theory and economic analysis 2. North-Holland, Amsterdam pp 89–103
72 A. Caparrós et al.
Feng H, Zhao J, Kling CL (2002) The time path and implementation of carbon sequestration. Am J Agricult Econ 84(1):134–149
Feng H, Kling CL (2005) The consequences of cobenefits for the efficient design of carbon sequestration programs. Can J Agricult Econ 53:461–476
García O (1983) A stochastic differential equation model for the height growth of forest stands. Biometrics 39:1059–1072
Hartman R (1976) The harvesting decision when a standing forest has value. Econ Inq 14:52–58
Hunt C (2008) Economics and ecology of emerging markets and credits for bio-sequestered carbon on private land in tropical Australia. Ecol Econ 66(2-3):309–318
Huntsinger L, Bartolome JW (1992) Ecological dynamics of Quercus dominated woodlands in California and southern Spain: a state-transition model. Vegetatio 99–100:299–305
Intergovernmental Panel on Climate Change (IPCC) (2000) IPCC special report: land use, land use change and forestry. WMO–UNEP, Geneva
Krinsky I, Robb AL (1986) On approximating the statistical properties of elasticities. Rev Econ Stat 68:715– 719
Lubowski RN, Plantinga AJ, Stavins RN (2006) Land-use change and carbon sinks: Econometric estimation of the carbon sequestration supply function. J Environ Econ Manag 51:135–152
Matthews S, O’Connor R, Plantinga AJ (2002) Quantifying the impacts on biodiversity of policies for carbon sequestration in forests. Ecol Econ 40(1):71–87
McFadden D (1981) Econometric models of probabilistic choice. In: Manski C, McFadden D (eds) Structural analysis of discrete data with econometric applications. MIT Press, Cambridge, pp 198–272
Montero G, López E, Campos P, Sánchez-González MO, Sánchez M, Ruiz-Peinado R, Ovando P, Caparrós A, Bachiller, A (2009) Selvicultura de los alcornocales (Quercus suber L.) del macizo del Aljibe (Cádiz— Málaga). In: Zapata-Blanco S, (eds) Alcornocales e industria corchera: Hoy, Ayer y Mañana. Museu del Suro de Palafrugell, Palafrugell, Spain (Forthcoming)
Montero G, Ruiz-Peinado R, Muñoz M (2006) Producción de biomasa y fijación de CO2por los bosques
españoles Serie Forestal 13. Monografías Instituto Nacional de Investigación y Tecnología Agraria y Alimentaria, Madrid
Moons E, Proost S, Saveyn B, Hermy M (2008) Optimal location of new forests in a suburban region. J For Econ 14(1):5–27
Moura-Costa P, Wilson C (2000) An equivalence factor between CO2avoided emissions and sequestration—
description and applications in forestry. Mitig Adapt Strateg Glob Chang 5(1): 51–60
Muys B, Garcia-Quijano J, Deckmyn G, Ceulemans R, Moons E, Proost S (2003) An integrated decision support framework for the prediction and evaluation of efficiency environmental impact and total social cost of domestic and international forestry projects for greenhouse gas mitigation: description and case studies. KU Leuven Working Paper 2003–2006.
Official Journal of the European Communities (OJEC) (1999) Council regulation (EC) no. 1257/1999 of 17 May 1999, on support for rural development from the European Agricultural Guidance and Guaran-tee Fund (EAGGF) and amending and repealing certain Regulations. OJEC, L, vol. 160, 26.6.1999, pp. 80–102
Olschewski R, Benitez PC (2005) Secondary forests as temporary carbon sinks? The economic impact of accounting methods on reforestation projects in the tropics. Ecol Econ 55:380–394
Richards KR, Sampson RN, Brown S (2006) Agricultural and forestlands: US carbon policy strategies. PEW Center, Washington
Richards KR, Stokes C (2004) A review of forest carbon sequestration cost studies: a dozen years of research. Clim Chang 63:1–48
Sohngen B, Mendelsohn R (2003) An optimal control model of forest carbon sequestration. Am J Agricult Econ 85(2):448–457
Van Kooten GC, Binkley CS, Delcourt G (1995) Effects of carbon taxes and subsidies on optimal forest rotation age and supply of carbon services. Am J Agricult Econ 77:365–374
Van Kooten GC (2000) Economic dynamics of tree planting for carbon uptake on marginal agricultural lands. Can J Agricult Econ 48:51–65
Van’t Veld K, Plantinga A (2005) Carbon sequestration or abatement? The effect of rising carbon prices on the optimal portfolio of greenhouse-gas mitigation strategies. J Environ Econ Manag 50:59–81