Volume 18, Number 1 (2018): 7-12 E -ISSN: 2252-6757
ANALYSIS OF PADDY
FARMER’S
SATISFACTION
ON INSECTICIDE USED IN PENDEM VILLAGE,
JUNREJO SUB-DISTRICT, BATU
Made Anggara Citra Retnanti
1,*and Ratya Anindita
11 Agricultural Socio-Economics Department, Faculty of Agriculture, University of Brawijaya, Indonesia
*corresponding author: [email protected]
Abstract:
Satisfaction is a condition where the demand for the received products meets consumer expectations. The purpose of this research is to analyze the paddy farmer's satisfaction on the insecticide usage. Data collection was done by interview technique using questionnaire. Importance Performance Analysis (IPA) and Customer Satisfaction Index (CSI) were used to answer this research objective. The respondents were 40 rice farmers who applied one of the insecticide brands. The IPA method showed that the conformity rate average is 91.40% indicating that the insecticide product was able to meet consumer expectations. The result of the CSI method shows a satisfaction level of 78.2% and lies in the criteria of satisfaction.Keywords: Satisfaction, insecticide, paddy farmers, Importance Performance Analysis (IPA), Customer Satisfaction Index (CSI)
INTRODUCTION
The increase of rice production is becoming one of the targets to be achieved from the agricultural sector. Rice demand estimation for 2025 will reach 78 million tons (Abdullah, 2003). In order to prevent the occurrence of food shortages in the present and future so the government should continue to increase rice production.
However, farmers need to overcome some problems including the damage of irrigation networks, land conversion which causes land area reduction, and climate change. Climate change in the future will be one of the most dominant factors affecting the success of increased production (Irsal, 2011). It can also increase pest and disease attacks.
Pest attacks can be controlled by applying pesticide (Mariyono, 2002). This indicates that the greater pests and rice diseases attack farming land, the larger demand for the use of agricultural technology and it means that the application of pesticides will increase. So farmers need to decide to apply it in their rice farming.
Various brands of pesticides on the market affect intense competition among pesticide companies. Thus, they must be able to understand which attributes that have been considered by consumers.
There is a certain insecticide product used by rice farmers in the research location. Farmers tend to choose this insecticide to face the problems and utilize benefits provided by the insecticide (Sumarwan, 2011). The type of insecticide analyzed in this research is contact insecticide and an emulsifiable in water, brownish-yellow in its color.
Paddy farmers in Pendem Village, Junrejo Sub-district, Batu City have been using the insecticide for over five years to control pests in rice crops. Farmers as consumers certainly pay attention to the function of the products used. Given the performance of the insecticides in controlling pests, the farmers seem to have high satisfaction because of repeated purchase for more than 5 years. This research plays role in empirically proving the farmer satisfaction in using the insecticide. Moreover, the objectives of this research are (1) to analyze the attributes of insecticide considered by farmers in the research location and (2) to analyze the level of rice farmers' satisfaction in using the insecticide.
RESEARCH METHODS
Pendem Village is one of the well-known rice center villages in Batu City. The study was conducted from June to July 2017.
The data used in the research are primary and secondary data. Primary data are collected from the rice farmers through personal interview and secondary data are collected from BPS (Government Statistics Agency), such as rice production data, land of rice, and productivity of rice. Furthermore, 40 farmers were selected to be research respondents.
Satisfaction Analysis
Importance Performance Analysis (IPA) and Customer Satisfaction Index (CSI) are used to measure the level of satisfaction of rice farmers in Pendem Village. Before analyzing data using IPA and CSI, testing the instruments by validity and reliability test is the first step in data analysis. The criteria of validity test should show the value of r-arithmetic ≥ r-table at a significant level of 0.05. Reliability test must have Cronbach Alpha value> 0.6 (Arikunto, 1993).
Importance Performance Analysis (IPA)
According to Tjiptono (2008), dimension of service quality is used to evaluate the quality of service including four dimensions of performance, features or any additional features, conformity to specification, and serviceability. In this study the four dimensions are made from 7 variables.
According to Yola and Budianto (2013) IPA is an analytical tool to compare the extent to which the performance can be perceived by consumers to the desired level of satisfaction. Measurement of importance and performance is calculated using Likert scale. In this study, there is a comparison between two sub variables namely the importance and performance of attributes. The level of conformity is the result of comparison between performance scores with interest scores. This level of conformity will determine the priority of increasing the factors of customer satisfaction on product attributes. Product attributes of the insecticide are 7 attributes.
Stages in the calculation of Importance Performance Analysis (IPA) based on Supranto (2001) are:
First, calculate the Conformity Level (CLi) between the level of performance and importance. CLi is calculated by the following formula:
CLi = XiYi x 100%
Where CLi is the level of conformity of rice farmers to X, this value can be obtained by dividing the score of X (Xi) performance appraisal with the score of interest rating (Yi).
Second, calculate the average performance
(𝑋̅𝑖) and interest (𝑌̅𝑖) of rice farmers. The average
performance and importance of rice farmers is calculated by the following formula:
𝑋̅ = ∑ 𝑋𝑖𝑛 𝑌̅ = ∑ 𝑌𝑖𝑛
Where n is the number of farmers using insecticide X (n = 40).
Third, the average value of the overall importance level of the item intersects the vertical axis and the average value of the overall performance level of the item intersects the horizontal axis.
Fourth, the average value of interest rate is used as the coordinate pair of the attribute point that shows the location of attributes into Cartesian diagram in Figure 1:
Figure 1. Cartesian diagram Source: Supranto (2001)
Customer Satisfaction Index
(CSI)
Analysis of Customer Satisfaction Index (CSI) is aimed to determine the level of satisfaction of rice farmers as consumers in using the insecticide. The way to calculate this index is done through four stages:
First, determine the Mean Importance Score (MIS) and Mean Satisfaction Score (MSS) with the following formula:
𝑋̅ 𝑋̅ Performance
𝑌̅
𝑌̅Importance
Quadrant I Quadrant II
𝑀𝐼𝑆 =
∑ 𝑌𝑖
𝑛𝑖=𝐼𝑛 𝑀𝑆𝑆 =
∑ 𝑋𝑖
𝑛𝑖=𝐼𝑛
The value of MIS is obtained by dividing the score of importance of each variable (Yi) with the number of samples of rice farmers (n). The value of MSS is obtained by dividing the score of performance level by the number of samples of each variable (Xi) with the number of samples of rice farmers (n).
Second, making Weight Factors (WF) this value is the result of the division of the MIS value per attribute to the total MIS of all attributes in percentage form (100%) with the following formula:
𝑊𝐹𝐼 = 𝑀𝐼𝑆
∑ 𝑀𝐼𝑆𝑖𝑝𝑖−𝐼 100%
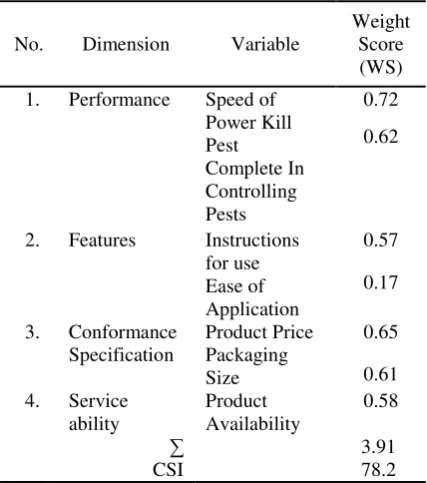
Where, p is the number of attributes (p = 7). Third, making the Weight Score (WS) this value is the multiplication of Weight Factors (WF) with the average Satisfaction Score satisfaction level (MSS) with the following formula:
WSi = WFi x MSSi
Fourth, the determination of the value of Customer Satisfaction Index (CSI) with the following formula:
𝐶𝑆𝐼 = ∑ 𝑊𝑆𝑖
𝑝 𝑖=𝐼
5 100%
Where, 5 is maximum scale.
Table 1. CSI Criteria
No CSI Value Criteria
1 81%-100% Very Satisfied 2 66%-80,99% Satisfied 3 51%-65,99% Quite Satisfied 4 35%-50,99% Less Satisfied 5 0%-34,99% Not Satisfied Source: Pratama, et al, 2011
RESULTS AND DISCUSSION Characteristics of Respondents
Pendem Village is one of the villages known as the largest rice producer in Batu City. Pendem village has flat plains area and the livelihood of the community is rice farming. The largest total wetland area in Junrejo Sub-district, Batu City is owned by Pendem Village.
Respondents in this research are rice farmers who have used the insecticide analyzed in his research for controlling the pests. Characteristics of respondents who are consumers of insecticides are dominated by male farmers, ages 21- <60 years old,
elementary-high school education, farmer income level <Rp 3,000,000 per month, and land area for cultivation of rice area ≤ 3000 m².
The labors who applied the insecticide are dominated by male farmers, 85%. This shows that the strategy of consumer satisfaction approach (farmers) is directed to the character of male farmers. The educational levels of farmers using the observed insecticide are dominated by elementary school (SD) to high school (SMU), but the highest proportion of the farmers is graduated from elementary school.
Paddy farmers are also predominantly with an age range of 51-60 years. Then, it is followed by the age of 41-50 years, which is the productive age in agriculture (Rusastra, 2005). Therefore, promotion strategies should be done in simple way, easily understood, and can be viewed directly.
The land area for rice cultivation is dominated by an area of ≤3000 m². It is known that the majority of farmers in Pendem Village have larger land area for rice plants compared to other crops. So, it can be concluded that the greater area of land used for rice crops, the demand for insecticides X will increase.
Satisfaction of Rice Farmers in Pendem Village Importance Performance Analysis (IPA)
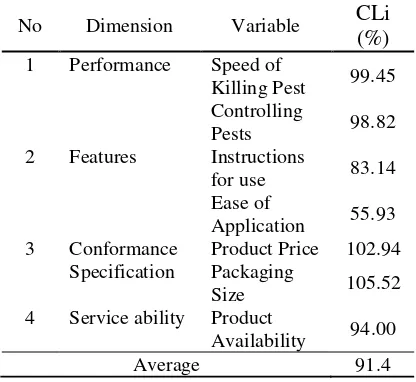
By using the analysis of importance and performance level, it can be known the conformity level between the consumers’ expected interest and the level of product performance given by the producer (Table 2). If a variable shows a high conformity level; then, the farmer's satisfaction is also high. Conversely, if the value of conformity is low, then the farmer's satisfaction will be also low variable. A high level of conformance will be achieved if the value of the performance level exceeds the importance of a variable.
Table 2. Performance Conformity and Interest
No Dimension Variable
CLi
(%)
1 Performance Speed of
Killing Pest 99.45 Controlling
Pests 98.82 2 Features Instructions
for use 83.14 Ease of
Application 55.93 3 Conformance
Specification
Product Price 102.94 Packaging
Size 105.52 4 Service ability Product
Availability 94.00
Based on the table, it can be seen that the suitability level of packaging size has the highest value. This means that this attribute belongs to a very suitable category where the farmer agrees with the size of the packaging provided by the company. The size of insecticide X packaging is available in three sizes: 100ml, 250ml, and 500ml. So, farmers can choose the size of packaging according to their needs.
Furthermore, product price attributes also have the second highest level of suitability after packaging size where the price of the product is in line with the farmers’ expectations. The company's performance is very good that is able to adjust the price of the product in accordance to the purchasing power of the farmers.
Then, the four attributes, which are the attributes of the speed of pest kill power, the purity in controlling the pest, the availability of the product, and the instruction manual, have high level for both between the interests and the corresponding performance. Attributes considered important by farmers have been given adequate performance by the company.
While the lowest level of conformity is the attribute of ease of application which means the importance level is not considered important by the farmers. The performance of these attributes is also considered low by farmers. Farmers confess that they have to adjust with the direction of the wind in the process of applying the insecticide. So, farmers feel the physical impact of the hot face when applying this product.
Some attributes have shown the relationship between the level of importance and level of performance against the use of the insecticide very well and accordingly; but there are still some attributes that are still not fit enough. According to Sudaryanto in Purnomo (2015) if the percentage of 80-100% then the suitability can be said that the performance of each variable has met the expectations of consumers but still needs to be done again. Percentage > 100% can be said the performance of these variables has exceeded consumer expectations.
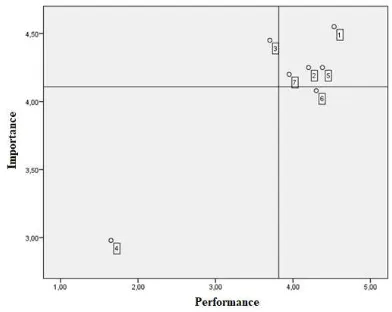
Through the method of IPA generated average performance level of 3.82 and interest level of 4.11. The value is used as the intersection point between X and Y on Cartesian diagram. To gain priority in the company's strategy the information on the result of the suitability rate is transformed into Cartesian diagram using SPSS 23 version.
Cartesian diagram is a wake divided into four parts bounded by two lines intersecting perpendicular to the points (x, y); where x is the average of the score of the performance level of all factors and y is the average of the importance
score of all factors affecting customer satisfaction (Supranto, 2001).
Figure 2. Cartesian Farmer Paddy Diagram in Pendem Village
Based on Cartesian diagram in Figure 2 can be seen variables according to the quadrant groups in the following Table.
Table 3. Variables based on quadrant
Quadrant Variable
I Instructions for use (V3)
II Speed of Power Kill Pest (V1), Complete In Controlling Pests (V2), Product Price (V5), Product Availability (V7)
III Ease of Application (V4) IV Packaging Size (V6)
Quadrant I (Main Priority)
Quadrant I or main priority is an attribute that is considered to affect consumer satisfaction and is considered important, but the company has not done well. This quadrant should be prioritized in the improvement by the company. Attribute that entered in quadrant I in this research that is instruction manual. The usage attribute is considered important by rice farmers because it is used in the process of applying insecticide products. But the performance of this attribute is still less or not in accordance with consumer expectations.
Quadrant II (Maintain Achievement)
Quadrant II or keep the achievement is a quadrant that shows the attributes that are considered important by consumers and the implementation of attributes have been in accordance to consumer expectations. Attributes that go into the quadrant II is the speed of pest kill power, mastery in controlling pests, product prices, and product availability. Attributes that enter this quadrant must be maintained because these attributes are very important and very satisfying consumers.
Quadrant III (Low Priority)
Quadrant III or low priority is a quadrant that indicates that the attributes in this quadrant are less important for the consumer and the implementation by the company is also considered normal. So, this attribute is considered less important and less satisfactory.
Attributes included in Quadrant III are attributes of ease of application. This attribute is considered less important by rice farmers because of the level of education that makes farmers less concerned. Low level of farmer knowledge makes farmers less critical in digging information on how to apply a good and correct X insecticide. The performance of this easy attribute attribute is also not very good. It can be seen that the insecticide X is a contact poison which in its application must be adjusted to the direction of the wind. So farmers important, but excessive implementation. The attribute included in this quadrant is the packing size attribute. Packaging size attributes are considered important by farmers but the
Customer Satisfaction Index consider the importance of an attribute in determining the level of attribute satisfaction that will ultimately affect the total satisfaction level of consumers in using insecticide product X. The value of CSI is directly proportional to the magnitude of the average score of interest and performance score, so that if the average score interests and performance scores are improved it will affect the increase in the value of
No. Dimension Variable
Weight
2. Features Instructions for use
Based on the above results if the CSI analysis is associated with the results of IPA analysis, it can be concluded that the CSI value of 78.2% comes from the variables that are in quadrant II. Where the variables in quadrant II have high level of performance and importance and quadrant IV has performance level exceeding low importance level. The variables in the quadrant have been able to influence the level of satisfaction of rice farmers. CSI value that has not reached 100% comes from the variables that are in quadrant I and quadrant III. Variables in quadrant I is an attribute that is considered to affect consumer satisfaction and considered important, but the company has not implemented it well. The quadrant III variable is a quadrant that shows that the attributes in this quadrant are less important for the consumer and the implementation by the company is also considered normal. Therefore it is necessary to make improvements to the variables based on the results of the IPA analysis so that later can increase the value of CSI.
CONCLUSION
obtained from the results of CSI analysis with a value of 78.2% which means consumers are in satisfied criteria.
SUGGESTION
Based on the research results and conclusion, there are several suggestions: (1) for next researchers are then expected to look for attributes other than those used in this study. So, the pesticide producers know other attributes that are considered to affect consumer satisfaction of insecticide applied by farmers; (2) for manufacturers should be able to increase consumers satisfaction by improving attributes whose performance does not meet the consumers’ expectation but that is considered important, such as instructions for use and ease of application; so the consumers will get more benefit in applying it.
REFERENCES
Abdullah, B. 2003. Status Perkembangan Pemuliaan Padi Tipe Baru. Puslitbangtan, Badan Litbang Pertanian Jakarta.
Arikunto, Suharsimi. 1993. Prosedur Penelitian: Suatu Pendekatan Praktek. Jakarta :Rineka Cipta
Aritonang, R. 2005. Kepuasan Pelanggan. Jakarta: PT. Raja Grafindo.
Diyahya, I., K. Sukiyono., dan R. Badrudin. 2016. Analisis Tingkat Kepuasan Petani Jagung Terhadap Pelayanan Lembaga Pemasaranya di Kecamatan Lubuk Pinang Kabupaten Mukomuko. Agrisep. 16 (1) : 45–58.
Irsal. (2011). Antisipasi Perubahan Iklim Dalam Mengamankan Produksi Beras Nasional. Pengembangan Inovasi Pertanian, 76-86.
Mariyono, J. (2002). Hubungan Antara Serangan Hama dan Penggunaan Pestisida: Pendekatan Analisis Ekonometrik Pada Padi dan Kedelai. Jurnal Perlindungan Tanaman Indonesia, 54-62.
Mustikarini, F., Retnaningsih, dan M. Simanjuntak. 2014. Kepuasan dan Loyalitas Petani Padi Terhadap Pestisida. Jur. Ilm. Kel. & Kons. 7 (2) : 93-102.
Pratama, T. Rahman, dan N. Rahman. 2011. Analisis Kepuasan Konsumen Food Bar Kabupaten Subang. Prosiding Seminar Nasional Penelitian dan PKM Sains, Teknologi, dan Kesehatan. 2 (1) : 311-318.
Purnomo, Wirdha. 2015. Analisa Kepuasan Pelanggan Terhadap Bengkel Dengan Metod eIpa (Importance Performance Analysis) Di Pt. Arina Parama Jaya Gresik. Surabaya: Jurnal JTM. Vol. 3, No. 3:54-63.
Rusastra IW. 2005. Analisis ekonomi ketenagakerjaan sector pertanian dan pedesaan di Indonesia. Laporan Akhir Penelitian. Bogor (ID): Pusat Penelitian dan Pengembangan Sosial Ekonomi Pertanian.
Sumarwan, U. (2011). Perilaku konsumen teori dan penerapannya dalam pemasaran. Bogor: Ghalia Indonesia.
Supranto, J. 2001. Pengukuran Tingkat Kepuasan Pelanggan. Jakarta: BinekaCipta.
Tjiptono, F. 2008. Strategi Pemasaran. Yogyakarta: Andi.
Wicaksono, B., Muhaimin, A., Koestiono, D. 2013. Analisis Sikap Dan Kepuasan Petani Dalam Menggunakan Benih Kentang Bersertifikat (Solanum Tuberosum L.). Jurnal Habitat. Vol. 24, No. 3:184-193.