Jurnal Bina Praja 9 (2) (2017): 265 - 280
Jurnal Bina Praja
e-ISSN: 2503-3360 p-ISSN: 2085-4323
http://binaprajajournal.com
Sensitivity Indicators Analysis
and Regional Sustainable Development Status
in Indonesia
Bachril Bakri
1, *, Ernan Rustiadi
2, Akhmad Fauzi
3, Soeryo Adiwibowo
41 Directorate General of Regional Autonomy,
Ministry of Home Affairs Republic of Indonesia
Jl. Medan Merdeka Utara No. 7-8, Central Jakarta 10110. Indonesia
2 Department of Soil Science and Land Resources,
Bogor Agricultural University, Bogor, Indonesia Jl. Raya Dramaga, Kampus IPB Dramaga Bogor 16680
3 Department of Resources and Environmental Economics,
Bogor Agricultural University, Bogor, Indonesia Jl. Raya Dramaga, Kampus IPB Dramaga Bogor 16680
4 Department of Communication and Community Development Science,
Bogor Agricultural University, Bogor, Indonesia Jl. Raya Dramaga, Kampus IPB Dramaga Bogor 16680
Received: 2 June 2017; Accepted: 21 October 2017; Published online: 28 November 2017
DOI: 10.21787/jbp.09.2017.265-280
Abstract
Indonesia is one of the largest archipelagic country in the world, with an area of 1,913,578.67 km2, and consists of 34 provinces, 415 regencies, and 93 cities. Since the end of centralistic governance under Soeharto's administration in 1999, Indonesia has adopted a decentralized governance system to deliver national and regional development. It has been noted that Indonesia has variations in social, economic, ecological, and institutional dimensions between a prov-ince to another provprov-ince in Indonesia. This study aims to analyze the sensitivity of indicator and hierarchy of sustainabil-ity of province in Indonesia, using a scalogram method, and analyze the status of sustainable development of the regions,
using cluster and flag analysis method. The research shows two most sensitive indicators, the ratio of paved road length
to area width and the GDP per capita. Both of these indicators are very effective in increasing the sustainability of pro-vincial development in Indonesia. Of the 33 provinces studied, 24 are at a moderate level of sustainability. Flag analysis showed that the SDG scenario is better than the NC-MEA and the BAU at Region I to III.
Keywords: Flag Analysis, Indicator, Regional Development, Scalogram, Sustainability Indicators Sustainable Development
I. Introduction
Sustainable development has become a commitment and part of development strategies and policies in several countries around the world, including Indonesia (Law of the Republic of Indonesia Number 17 of 2007, 2007; Tong, Ye, & Hou, 2006). It is also stated as one of the mission of Indonesia's National Long-Term Development Plan 2005-2025, which is to create the equitable distribution of development and justice, and a green
and sustainable Indonesia in 2025 (Law of the Republic of Indonesia Number 17 of 2007, 2007). Indonesia has a vast territory, covering an area of 1,913,578.67 km2, and consists of 34 provinces, 415 districts and 93 cities (Regulation of the Minister of Home Affairs of the Republic of Indonesia Number 56 of 2015, 2015).
indicators are indicators who react early and sensibly to changes in what they are monitoring, allowing it to be used for monitoring trends of successes or failures of policies. Rustiadi, Saefulhakim, & Panuju (2009) stated that sensitivity indicators are indicators that can rapidly and precisely indicate the important changes in environmental characteristics. Therefore, the selected indicators need to be tested for their sensitivity level, to formulate priority development programs based on the most sensitive indicators.
With the end of the Millennium Development Goals (MDGs) agenda by 2015, the sustainable development is now entering a new agenda with the declaration of Sustainable Development Goals or SDGs through UN Resolution Number A/Res/70/1. The agenda is also a challenge for all governments in the world to achieve three noble goals by 2030: ending poverty, achieving equality and addressing climate change in all countries (United Nations, 2015). In addition to the enforcement of the SDG's policy, Indonesia is also dealing with the ASEAN Economic Community (MEA) policy, which aims to ensure that each country in the ASEAN region can improve its economic stability and might be able to address various issues related to the economy in each region. This MEA policy is more conducive to economic and social development than the environment. Efforts to have a sustainable development in Indonesia are also influenced by the government's development policies. The development policy, both the policies of the past five years (2010-2014), outlined in 11 national development priority agendas (Regulation of the President of the Republic of Indonesia Number 5 of 2010, 2010), as well as current policies outlined in the 9th Strategic Priority Agenda, called NAWACITA.
In this regard, one of the challenges in regional development, especially in developing countries such as Indonesia is how to measure the success of development as mandated in Law of the Republic of Indonesia Number 23 of 2014 on Regional Government.
The law mandates that each region, both provincial and district/city, implement policies and programs using performance indicators as a means of assessing their success. However, with too many indicators set (> 700 indicators), it is not easy for regions to measure their performance. A simpler measurement of sustainable development is one way to overcome this complexity, by using three pillars of sustainability, namely: (a) economic pillars, (b) social pillars, and (c) environmental pillars, more holistically. The measurement methods were used by Nijkamp & Vreeker (2000), and Jesinghaus (2007). The evaluation of its sustainability was performed by Shmelev & Rodríguez-Labajos (2009) and Poveda & Lipsett (2011). Fauzi & Oxtavianus
(2014) have also measured the sustainability by using a composite index to assess Indonesia's sustainable development in the provinces, while Erlinda (2016) uses the Flag and Impressive Decision Model approach to evaluate sustainable development in Jambi Province.
Based on a report released by World Bank (2009) environmental degradation and natural resource degradation, and the absence of good governance in Indonesia have, and will undermine Indonesia's national income between 0.2% to 7% of GDP or vary between or vary between US$ 0.56 billion to US$ 7.7 billion per year. We can see that there are still many challenges and obstacles to achieve sustainable development objectives at the national level. However, this commitment remains a national agenda and should remain to be a development agenda or priority for all provinces in Indonesia.
With the background and consideration as described above, the purpose of this study is to analyze the sensitivity of indicators and sustainability status of regional development in Indonesia.In addition to the enforcement of the SDG's policy, Indonesia is also faced with the ASEAN Economic Community (MEA) policy, which aims to ensure that each country in the ASEAN region can improve its economic stability and might be able to address various issues related to the economy in each region.
II. Method
A. Sensitivity Analysis Indicators and Hierarchy of Sustainable Development of Provincial Region in Indonesia The method used for this analysis is a scalogram analysis. According to Saefulhakim (2004), the scalogram can be used to analyze the number of facilities owned by each region or to analyze the presence or absence of such facilities in a region. The facilities in this study are used as indicators of sustainable development in the province. The indicators used in this study are presented in Table 4, which are secondary data sourced from BPS and related Ministries/Institutions, with serial data from 2010-2014.
1. Develop data tabulation for each indicator, and calculate the mean (x) and standard deviation (σ) of each indicator, as illustrated in Table 1. 2. Standardize data for each indicator. At this
stage, based on the results of the Phase 1 analysis of data tabulation, each data is standardized (Table 2). Standardization is calculated using the formula:
(
)
I i
X'
=
X
−
X /
σ
Notes:
X’I = standardized indicator values Xi = value of the indicator
X
= average value of the indicator
σ = standard deviation
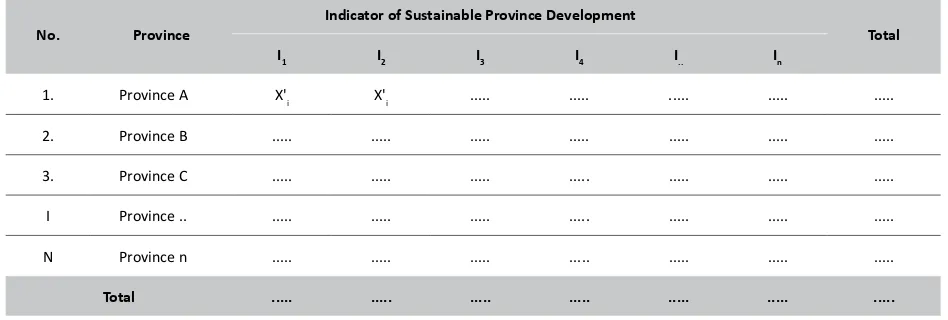
Table 1.
Data on Key Indicators of Sustainable Province Development
No. Province
Key Indicator of Sustainable Province Development
Total
I1 I2 I3 I4 I.. In
1. Province A ... ... ... ... ... ... ...
2. Province B ... ... ... ... ... ... ...
3. Province C ... ... ... ... ... ... ...
I Province .. ... ... ... ... ... ... ...
N Province n ... ... ... ... ... ... ...
Total ... ... ... ... ... ... ...
... ... ... ... ... ... ...
σ ... ... ... ... ... ... ...
Notes:
In = Key indicator of sustainable region development number-n = Mean of the indicator
σ = Standard deviation
X
X
Table 2.
Standardization of Data on Provincial Development Indicators
No. Province
Indicator of Sustainable Province Development
Total
I1 I2 I3 I4 I.. In
1. Province A X'
i X'i ... ... ... ... ...
2. Province B ... ... ... ... ... ... ...
3. Province C ... ... ... ... ... ... ...
I Province .. ... ... ... ... ... ... ...
N Province n ... ... ... ... ... ... ...
Total ... ... ... ... ... ... ...
Notes:
3. Negative indicators of the standardized data would then be transformed into a positive indicator to equalize the direction of all indicators so that the resulting hierarchy has the same direction. A positive indicator is an indicator that shows improved conditions if the indicator value increases. An example is a per capita GDP indicator, whereas a negative indicator is an indicator that indicates an improvement in condition if its indicator value decreases. Examples of negative indicators are the open unemployment rate and the percentage of the population below the poverty line.
4. Using scalogram method, put the indicators in a hierarchy, sort the indicators from highest to the lowest. With the scalogram analysis,
we can see the best province and sustainable indicator, as presented in Table 3. Scalogram analysis is performed using Microsoft Excel.
Table 4 presents the indicators utilized in this study. The data used are secondary data sourced from BPS, the relevant Ministries/Agencies, and local governments, with data series from 2010 to 2014.
B. Analysis of the Sustainability Status of Regional Development
For computational reasons, indicators of institutional dimensions are incorporated into the Social dimension, since the institutional dimension represents the idea of social development. This indicator is then tested into three development
Table 3.
Results of Scalogram Analysis of Indicators and Sustainability of Province Development
No. Province
Indicator of Sustainable Province Development
Total (Sorted)
I1 I2 I3 I4 I.. In
1. Province A ... ... ... ... ... ... ...
2. Province B ... ... ... ... ... ... ...
3. Province C ... ... ... ... ... ... ...
I Province .. ... ... ... ... ... ... ...
N Province n ... ... ... ... ... ... ...
Total (Sorted) ... ... ... ... ... ... ...
Highest Value Lowest Value
Table 4.
Indicators Used in This Study
No. Indicator of Sustainable Province Development Unit
Economic Dimension
1. GRDP per capita IDR
2. Gini ratio Index
3. Wiliamson Inequality Index Index
4. Percentage of population below the poverty line %
5. Purchasing power parity/PPP IDR
6. Percentage of expenditure for consumption (food) %
scenarios, namely (a) Scenario I: Bussines As Usual (BAU), (b) Scenario II: Nawa Cita-MEA (NC-MEA), and (c) Scenario III: Sustainable Development Goals (SDGs).
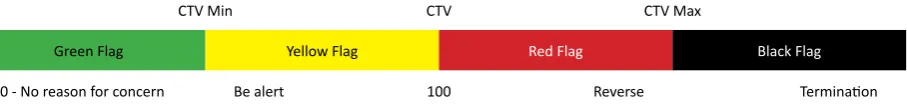
Assessment of development sustainability status in each region is done by using Flag (Erlinda, 2016; Nijkamp & Vreeker, 2000) method. The Flag method is based on the bandwidth values that are divided into intervals of different sustainability levels. This value is known as Critical Threshold Value or CTVs (Critical Threshold Values). The CTVs band is presented in Figure 1.
The CTV Flag range above indicates the sustainability of a region's development. The
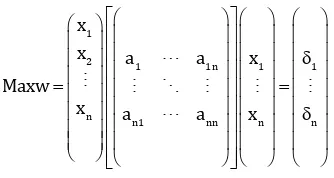
green flag indicates a high rate of sustainable development, and no concern is raised for the decision maker regarding pursuing sustainable development, while the yellow flag indicates that risks have been detected. The red indicates that the development is no longer sustainable and (reverse trend/reconsideration is needed) and black flag indicates hazard zones or high environmental damage occurring due to development that exceeds the capacity of a region (need to be terminated). The Flag Model is a multicriteria decision method, using algorithms, maximization with constraints, mathematically written as follows:
No. Indicator of Sustainable Province Development Unit
Economic Dimension
Social Dimension
8. Average school duration Year
9. Angka Partisipasi Murni (APM) of Senior Highschool (SMA) %
10. Life expectancy Year
11. Open unemployment rate %
12. Percentage of workforce in formal sector %
13. Percentage of households with access to clean water/drinking water %
14. Percentage of households with access to adequate sanitation %
Environment Dimension
15. Total CO2 emissions to population Kg/person
16. Environmental Quality Index Index
17. Percentage of critical land area to total area %
18. Percentage of flood incidence to population %
Institutional Dimensions
19. Index of social capital Index
20. Percentage of women representation in the parliament %
21. Percentage of female APS to male %
*) ATPM percentage of children in a school age group studying at the appropriate levelof education to total children in that school age group.
CTV Min CTV CTV Max
Green Flag Yellow Flag Red Flag Black Flag
0 - No reason for concern Be alert 100 Reverse Termination
Maxw=(x1, x2,...xn)... 5)
with x1ϵK1, x2ϵK2, x3ϵK3....xnϵKn... 6)
In the context of the Flag model the value of K1 to Kn is represented by the critical value (CTV), resulting in the equation constrain:
x1ϵCTV1, x2ϵCTV2, x3ϵCTV3... xnϵCTVn... 7)
The Flag model is a multi-criteria model, and represented in detail by the following equation:
1
The column vector (...) represents a constant or Critical Threshold Value (CTV). The sustainability score then based on Critical Threshold Value (CTV) where:
Where x = the value of the indicator measured; S(x) = sustainability indicator that describes green to black areas (whether safe or overloading or unsustainable).
The Flag analysis was performed using Samisoft® software developed by Nijkamp & Vreeker (2000). The data and indicators used in this study are shown in Table 5 to Table 8.
... 8)
Table 5.
CTV, CTV Min, and CTV Max of Regional I Sumatera
No Indicator Type CTV Min CTV CTV Max Unit
Economy
1 GRDP per capita G 31,426.10 34,917.39 38,409.69 Million IDR
2 Wiliamson Inequality Index B 0.43 0.48 0.53 Index
3 Percentage of population
below the poverty line B 10.06 11.18 12.30 Percentage
Social
4 Angka Partisipasi Murni (APM) of Senior Highschool (SMA)
G 49.66 55.18 60.70 Percentage
5 Life Expectancy G 62.10 69.00 75.00 Index
6 Index of Social Capital G 54.35 60.39 66.42 Index
7 Open Unemployment Rate B 5.23 5.81 6.39 Percentage
Environment
8 Total CO2 emissions to
population B 1.08 1.21 1.33 Percentage
9 Environmental Quality Index
G 58.76 65.29 71.82 Index
10 Percentage of Critical Land Area to Total Area
B 0.0018 0.0019 0.0021 Percentage
Table 6.
CTV, CTV Min, and CTV Max of Regional II Java-Bali
No Indicator Type CTV Min CTV CTV Max Unit
Economy
1 GRDP per capita G 34,990.94 38,878.82 42,766.71 Million IDR
2 Wiliamson Inequality Index B 0.60 0.67 0.74 Index
3 Percentage of population
below the poverty line B 8.62 9.58 10.53 Percentage
Social
4 Angka Partisipasi Murni (APM) of Senior Highschool (SMA)
G 49.10 54.55 60.01 Percentage
5 Life Expectancy G 64.45 71.61 78.77 Index
6 Index of Social Capital G 52.90 58.77 64.65 Index
7 Open Unemployment Rate B 5.98 6.64 7.31 Percentage
Environment
8 Total CO2 emissions to
population B 1.15 1.28 1.41 Percentage
9 Environmental Quality Index
G 47.68 52.98 58.27 Index
10 Percentage of Critical Land Area to Total Area
B 0.0009 0.0010 0.0011 Percentage
Source: FGD Results February 25, 2016, at Hotel Bumi Karsa Bidakara
Table 7.
CTV, CTV Min, and CTV Max of Regional II Kalimantan-Sulawesi
No Indicator Type CTV Min CTV CTV Max Unit
Economy
1 GRDP per capita G 29,792.21 33,102.46 36,412.70 Million IDR
2 Wiliamson Inequality Index B 0.39 0.43 0.47 Index
3 Percentage of population
below the poverty line B 8.85 9.84 10.82 Percentage
Social
4 Angka Partisipasi Murni (APM) of Senior Highschool (SMA)
G 44.91 49.90 54.89 Percentage
5 Life Expectancy G 61.70 68.56 75.41 Index
III. Results and Discussion
A. Sensitivity Analysis Indicators and Hierarchy of Sustainable Development of Provincial Region in Indonesia
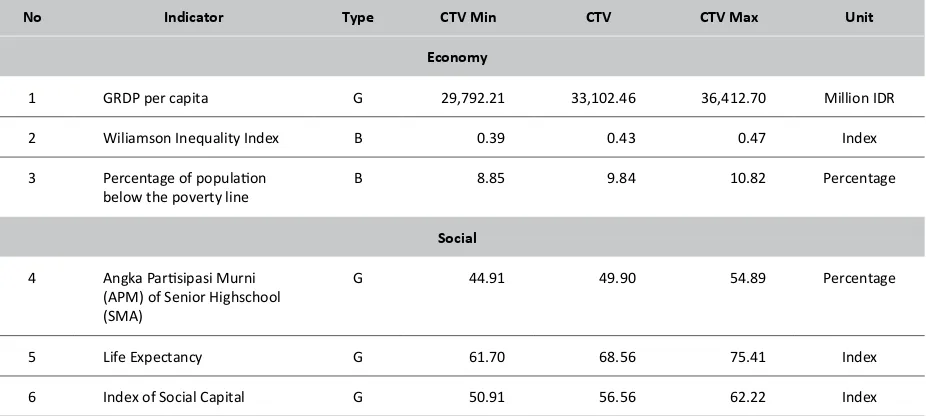
Figure 2 shows the sensitivity sequence of the twenty-one indicators. The most sensitive indicator is the rightmost indicator in the bar chart of Figure 2. The leftmost indicator shows that although classified as sensitive, the indicator's performance
No Indicator Type CTV Min CTV CTV Max Unit
Economy
7 Open Unemployment Rate B 4.52 5.02 5.53 Percentage
Environment
8 Total CO2 emissions to population
B 1.30 1.44 1.59 Percentage
9 Environmental Quality Index
G 63.04 70.05 77.05 Index
10 Percentage of Critical Land Area to Total Area
B 0.0017 0.0018 0.0020 Percentage
Source: FGD Results February 25, 2016, at Hotel Bumi Karsa Bidakara
Table 8.
CTV, CTV Min, and CTV Max of Regional II Nusa Tenggara-Maluku-Papua
No Indicator Type CTV Min CTV CTV Max Unit
Economy
1 GRDP per capita G 22,127.18 24,585.76 24,585.76 Million IDR
2 Wiliamson Inequality Index B 0.93 1.03 1.14 Index
3 Percentage of population
below the poverty line B 17.53 19.48 21.43 Percentage
Social
4 Angka Partisipasi Murni (APM) of Senior Highschool (SMA)
G 44.61 49.57 54.53 Percentage
5 Life Expectancy G 58.77 65.22 71.74 Index
6 Index of Social Capital G 52.32 58.13 63.94 Index
7 Open Unemployment Rate B 4.88 5.42 5.97 Percentage
Environment
8 Total CO2 emissions to
population B 1.02 1.14 1.25 Percentage
9 Environmental Quality Index
G 66.78 74.20 81.62 Index
10 Percentage of Critical Land Area to Total Area
B 0.0010 0.0011 0.0013 Percentage
is better than other indicators. Thus, it can be seen that there are 2 (two) most sensitive indicators, namely the percentage of the paved road length to total area and per capita GRDP. This is evidenced by the very low value of the scalogram for both indicators.
In sequence, if all the dimensions of sustainability are represented then there are 7 (seven) very sensitive indicators located at the far right of the bar chart in Figure 17. The seven indicators are: (1) percentage of the length of the steady road to the area (economic dimension), (2) GRDP per capita (economic dimension), (3) Gini ratio (economic dimension), (4) percentage of food expenditure (economic dimension), (5) percentage of formal sector labor (social dimension), (6) Total CO2 emissions to population (environmental dimension), and (7) percentage of women's representation in parliament (institutional dimension).
Of the seven highly sensitive indicators representing all sustainable dimensions, four of them are those that fall within the economic dimension, located on the far right of the chart in Figure 2. This suggests that the economy should still be both the government's and regional governments' development priority, to quickly create sustainable development in Indonesia. The four indicators are (1) percentage of expenditure on food, (2) Gini ratio, (3) GRDP per capita, and (4) percentage of steady road length to the total area.
The seven sensitive indicators are the priority
for the government and regional governments to improve, to accelerate the creation of sustainable development of provinces in Indonesia (Figure 2 and Table 9).
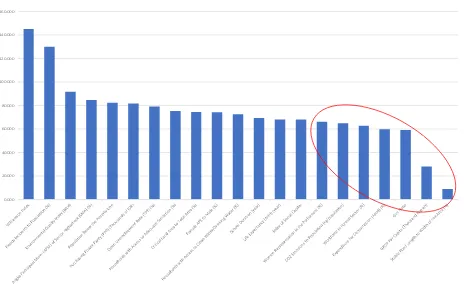
The provinces are grouped by using Standard Deviation interval and Mean value to obtain the hierarchy of sustainable provincial development based on the scalogram.
Hierarchy I (High Sustainable Development) is the group which value is the Mean value + Standard Deviation, Hierarchy III (Low Sustainable Development) is the group whose value is the Mean value - Standard deviation, and Hierarchy II (Medium Sustainable Development) is the group that lies in between Hierarchy I and III.
Base on the above criteria, where the mean value (A) = 46.847, Standard Deviation (B) = 8.605, then the Hierarchy I = A + B is 55.452, Hierarchy III = A - B is 38.242, and Hierarchy II is 38.242 ≤ Total ≤ 46.847. (Figure 3 and Table 9).
Using the above grouping, the hierarchy of provincial level of sustainability in Indonesia, are as follows:
1. Hierarchy I, Provinces with a high level of sustainability of regional development indicators, characterized with the highest total scalogram number of twenty-one development indicators. This is in line with the theory of Serageldin (1996) and UN-CSD (1995) in Spangernberg and Boniot (1998). Areas with high sustainability are areas where economic, social and institutional development is
Figure 2. Level of Sensitivity of Sustainable Province Development Indicators Using Scalogram Analysis 0.000
Table 9.
The Hierarchy of Provinces’ Development Performance Based on Twenty-One Indicators of Sustainable Province Development Using the Scalogram Method
No.
e of Floods Inciden
ts t
artisipasi Murni (APM) of
Senior High-school (SMA) (%)
Per
er pari-ty/PPP (PPP)
(thou-sands rupi-ah)
e of households with
access t
e of households with
ac-cess t
tion in the par
-lia-men
width of the ar
ea %)
4.562 4.654 0.000 2.760 3.881 2.428 0.594 4.509 3.880 1.769 4.430 4.847 3.275 2.256 2.241 0.563 4.581 4.886 0.534 4.158 5.805 66.614 I
2 East Kalimantan
3.709 3.104 3.279 3.677 3.464 3.493 0.980 3.564 3.262 3.483 3.427 3.193 3.746 0.982 4.094 2.022 3.270 3.052 2.029 4.219 0.018 62.067 I
3 Bali 4.994 4.656 2.850 4.217 3.778 2.852 3.926 4.156 3.017 2.090 4.094 2.313 2.874 3.279 0.980 0.576 2.672 3.865 0.855 0.610 0.339 58.993 I 4 Riau Islands 4.933 4.527 2.725 4.075 3.348 3.423 2.065 2.353 0.046 0.313 3.644 3.926 2.097 3.530 1.586 3.413 4.351 2.910 2.633 2.226 0.237 58.359 I 5 Bangka Belitung 5.142 4.632 2.265 1.644 3.635 3.392 3.013 1.986 2.812 4.280 3.298 1.581 2.333 4.113 1.269 2.636 2.832 1.760 3.965 0.767 0.117 57.475 I 6 Riau 4.384 4.575 1.627 3.079 3.172 3.807 2.212 2.387 2.217 1.999 2.264 2.712 2.709 2.640 3.635 2.829 2.427 1.783 2.131 2.250 0.040 54.879 II 7 DIY 4.519 4.500 1.811 4.140 1.881 3.761 3.131 2.534 2.874 2.107 3.801 3.018 4.136 3.205 1.538 0.460 2.531 3.249 0.443 0.372 0.519 54.529 II 8 North Sulawesi 4.520 4.457 3.168 2.821 3.202 2.975 1.314 3.219 1.793 3.654 2.954 3.113 2.787 0.862 4.123 1.301 2.109 2.233 0.860 0.553 0.104 52.121 II 9 North Sumatera 4.261 4.369 2.959 3.726 2.755 3.033 2.007 2.779 2.286 2.113 2.482 3.085 1.712 3.052 1.538 2.954 1.984 0.923 2.793 0.656 0.074 51.541 II 10 Central Java 3.691 4.035 1.950 2.294 1.985 3.045 2.302 4.147 3.443 1.596 2.631 1.127 3.705 1.209 2.965 2.337 1.760 2.056 1.793 0.400 0.199 48.669 II 11 West Java 4.413 4.496 1.106 1.940 2.830 2.694 0.752 2.419 2.641 2.464 2.271 1.885 3.195 2.256 2.823 3.608 2.600 2.207 1.038 0.474 0.133 48.243 II 12 East Java 3.461 4.242 1.801 2.601 2.382 3.567 3.053 2.919 1.849 2.219 2.571 1.202 2.594 3.210 1.240 2.392 1.653 2.055 2.225 0.711 0.083 48.032 II 13 North Maluku 5.190 4.380 4.024 3.221 3.191 0.315 2.654 2.229 2.171 2.528 1.869 2.469 1.439 2.070 0.951 2.818 1.045 1.623 3.123 0.205 0.044 47.560 II 14 Banten 4.097 4.739 0.974 2.169 3.503 2.525 0.000 2.802 3.197 2.080 2.821 2.419 2.105 0.000 2.369 3.842 3.476 2.125 1.006 0.646 0.258 47.154 II 15 West Sumatera 5.024 3.585 3.409 3.475 3.153 2.913 1.934 1.459 2.441 2.122 1.851 2.598 1.788 2.057 1.000 1.805 1.778 0.948 2.610 0.501 0.055 46.504 II 16 Lampung 4.895 4.386 2.341 2.059 1.913 1.696 2.517 3.063 2.483 3.278 1.502 1.675 2.279 3.011 2.034 1.960 1.191 1.360 2.247 0.427 0.077 46.394 II 17 South Sulawesi 4.395 3.852 2.574 2.451 2.939 3.036 2.153 2.405 2.231 2.618 2.733 1.734 2.270 1.227 2.369 2.228 1.695 1.974 0.605 0.528 0.038 46.056 II 18 Bengkulu 4.920 4.301 3.516 2.985 1.495 2.402 3.262 2.992 0.249 3.235 1.039 2.392 1.842 2.552 2.220 1.588 1.332 1.153 2.063 0.294 0.094 45.926 II 19 Southeast
Kalimantan
5.368 3.836 2.919 1.468 3.472 3.040 3.493 0.883 0.503 3.356 1.128 2.082 2.232 1.167 2.854 1.083 1.876 1.107 2.939 0.649 0.009 45.465 II
20 Maluku 4.536 4.390 3.761 3.117 1.206 1.334 0.874 2.263 2.195 2.452 1.838 3.199 0.598 2.561 3.489 2.384 1.180 1.845 1.962 0.111 0.023 45.318 II 21 Jambi 4.577 3.407 2.428 2.265 3.073 2.833 2.925 1.996 1.550 2.317 1.904 1.999 2.599 3.015 1.499 0.000 1.869 1.196 2.998 0.821 0.047 45.317 II 22 Aceh 4.406 2.798 3.556 4.223 1.536 1.201 1.005 1.700 2.627 2.564 1.931 2.789 2.246 2.524 1.797 2.167 1.856 0.246 3.322 0.471 0.023 44.991 II 23 Central Sulawesi 5.002 3.567 4.284 2.570 2.035 2.549 3.104 2.781 3.220 2.250 1.866 2.111 1.304 0.820 1.903 0.359 1.322 1.821 1.490 0.460 0.028 44.844 II 24 South Sumatera 4.244 4.098 2.438 2.146 2.149 2.570 2.441 1.270 1.450 2.766 1.832 1.840 2.037 2.988 2.157 2.503 1.483 1.334 1.864 0.670 0.026 44.306 II 25 South Kalimantan 4.773 3.662 2.000 1.727 3.699 3.062 2.864 1.922 1.925 2.848 2.101 1.807 1.459 1.121 1.499 1.140 1.789 1.722 2.020 0.562 0.049 43.752 II 26 West Sulawesi 5.221 3.547 3.027 1.780 2.429 2.717 3.797 1.695 2.512 0.000 1.204 1.094 0.000 2.700 2.220 2.836 0.872 0.800 2.697 0.256 0.055 41.459 II 27 West Kalimantan 4.904 4.534 3.323 0.894 3.173 2.679 3.137 1.772 2.430 1.093 0.857 0.878 2.326 1.353 1.220 2.021 1.251 1.290 1.404 0.404 0.010 40.953 II 28 North Sulawesi 4.839 0.000 3.229 2.731 2.332 1.675 3.088 1.651 1.331 2.488 2.252 2.145 2.549 0.681 2.220 1.037 1.486 2.220 0.611 0.547 0.035 39.146 II 29 West Papua 2.324 4.665 4.095 2.324 0.379 0.000 2.122 0.434 3.526 1.585 1.690 1.204 0.643 2.256 1.185 3.559 1.738 2.184 0.576 1.681 0.015 38.185 III 30 Gorontalo 5.195 1.219 4.201 1.726 1.732 2.039 2.945 1.845 0.000 3.307 1.764 1.257 1.328 0.862 3.489 1.056 1.628 2.248 0.000 0.243 0.071 38.154 III 31 NTB 3.885 4.117 3.415 3.049 1.290 3.217 2.528 1.853 3.111 0.306 1.921 0.595 0.467 1.441 0.781 2.197 0.852 0.646 1.924 0.179 0.155 37.930 III 32 NTT 4.643 3.971 2.446 1.099 1.342 0.596 3.537 0.000 1.701 2.549 0.619 1.019 0.916 1.390 1.000 1.655 0.297 0.952 2.179 0.000 0.058 31.969 III 33 Papua 0.000 4.677 3.942 0.000 0.000 0.781 3.340 1.373 3.329 0.344 0.000 0.000 0.538 1.709 0.000 1.696 0.000 0.000 0.295 1.012 0.000 23.036 III
sustainable. 4. There are 5 (five) province in Hierarchy I, namely DKI Jakarta Province, East Kalimantan, Bali, Riau Islands, and Bangka Belitung. The Hierarchy I provinces indicates that they have a high degree of sustainability indicators on the economic, social, environmental, and institutional dimensions
2. Hierarchy II, Provinces with moderate value of sustainability level, as shown by a moderate economic, social, environmental and institutional indicator. There are 23 (twenty-three) provinces included in the Hierarchy II. This shows that generally the Provincial Region in Indonesia are still in developing stage. The 0.000
10.000 20.000 30.000 40.000 50.000 60.000 70.000
Hierarchy 1 Hierarchy 2 Hierarchy 3
Figure 3. The Hierarchy of Sustainable Province Development Based on the Performance Indicators of Sustainable Development
level of economic, social, environmental, and institutional progress on average are still moderate. This proves that Indonesia is still in a developing country, and still need some efforts to further improve economic, social and institutional development, without causing any damage to the environment.
3. Hierarchy III, Provinces with low sustainability and low development indicator value. This hierarchy indicates low sustainability indicators of economic, social, environmental and institutional development and low levels of sustainability. There are 5 (five) provinces in the Hierarchy III, namely West Papua, Gorontalo, West Nusa Tenggara, East Nusa Tenggara, and Papua.
The detail description of the hierarchy of provinces sustainability in Indonesia is presented in Figure 4.
B. Analysis of the Status of Sustainable Regional Development in Indonesia In assessing the sustainability status of regional development in Indonesia, the 33 provinces are grouped into 4 (four) regions based on island characteristics, socio-economic conditions, and the demographic profiles. The four regions are: Region I (Sumatra); Region II (Java - Bali); Region III (Kalimantan - Sulawesi); and Region IV (Nusa Tenggara, Maluku and Papua). The analysis uses ten indicators of economic, social, environmental, and institutional dimensions.
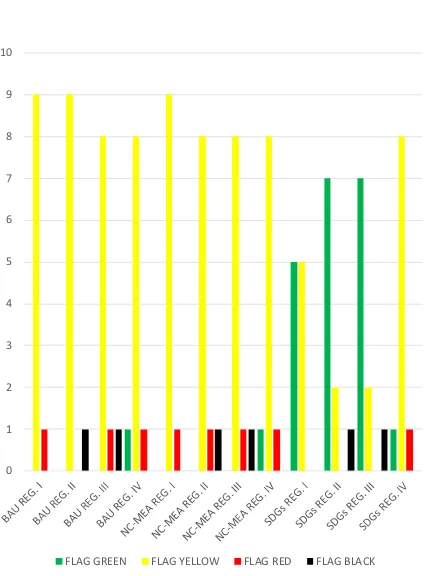
Table 10 and Figure 5 show the results of Flag analysis based on BAU, NC-MEA, and SDGs policies. The summary is shown in Table 9, which indicates that the SDGs policy scenario is better than that of NC-MEA and BAU for Region I to IV. This is demonstrated by the discovery of green flags that are more evenly distributed in SDGs policy scenarios than NC-MEA and BAU. In addition, Figure 4 also shows a relatively even distribution of the yellow flags in NC-MEA and BAU policies across all regions.
This is demonstrated by green flags that are more evenly distributed in SDGs policy scenarios than NC-MEA and BAU. Figure 4 also shows a relatively even distribution of the yellow flags in NC-MEA and BAU policies across all regions.
Table 11 shows cross-tabulation results for the Sumatra Region. It shows that both NC-MEA and BAU policy scenarios have similar sustainability levels. This is indicated by the same number of green, yellow, red and black flags. (0 green, 9 yellow, 1 red, and 0 black). Furthermore, when BAU is compared with SDGs it appears that SDGs are better since they produce more green flags (5:0), and no red flags (0:1).
Cross tabulation between SDGs and NC-MEA for region I Sumatra indicates that SDGs are better,
Table 10.
Flag Analysis of BAU, NC-MEA, and SDGs Policy in Region I-IV
FLAG BAU
FLAG GREEN FLAG YELLOW FLAG RED FLAG BLACK
since they produce more green flags (5:0) and no red flags (0:1). Thus, it can be concluded that the policy of SDGs development is more sustainable for Region I (Sumatra).
Table 12 presents cross tabulation for Region II Java Bali. Comparison of NC-MEA and BAU policies, shows that both scenarios have same sustainability levels, as shown by the number of flags generated. BAU scenario has more yellow flags (9:8), but both BAU and NC-MEA have the same black flags (1:1). Comparison of BAU with SDGs shows that SDGs is better, as it produces greener flag (7:0) and no black (0:1).
Cross tabulation between SDGs and NCA-MEA in Region II Java-Bali shows that SDGs are better than NC-MEA, since they produce more green flags (7:0), and no red flags (0:1). Thus, it can be concluded that SDGs have more sustainability level for regional II (Java Bali).
Table 13 shows the results of cross-tabulations for Region III Kalimantan-Sulawesi. Comparison between NC-MEA and BAU policies, shows no difference between the two, both scenarios generate the same number of flag (0 green, 8 yellow, 1 red, and 1 black). However, when the BAU is compared with SDG, it appears that the SDG is better than BAU, with more green flags (7:0) and fewer yellow flags (2:8). This is because the emergence of a green flag
will cause a reduction in the yellow flag, and no red flag (0:1).
Comparing between SDGs and NC-MEA policies, SDGs scenario also showed better than NC-MEA, since it produced more green flags (7:0) and less yellow flag (0:1). Thus, it can be concluded that the sustainability of SDGs is better in Region III (Kalimantan-Sulawesi) compared to BAU and NC-MEA policies.
Table 14 provides cross tabulation for the Nusa Tenggara-Maluku-Papua region. The cross-tabulation results between BAU, NC-MEA, and SDGs have the same tendency since both produce the same number of flag (1 green, 8 yellow, 1 red, and 0 black). However, if BAU policy scenarios are compared with SDGs, it appears that the SDG scenario is better than BAU with more green flags (6:1), fewer yellow flags (4:8), and no red flag (0:1).
Comparison between SDGs and NC-MEA, shows that the SDG scenario showed better than NC-MEA, since it produced more green flags (6:1) and fewer yellow flags (4:8), and no flag red (0:1). Thus, it can be concluded that the sustainability of SDGs is better in the Region III Kalimantan-Sulawesi compared to the BAU and NC-MEA.
To implement the policy on SDG development, the provincial government can issue a Regional Regulation (PERDA), which adopts more sustainable
Table 11.
Cross-tabulation of Region I Sumatra Flag Nawa Cita-MEA
principles for the region. For example, Regional Regulations on Sustainable Natural Resources Utilization, and Local Regulations on the Provincial Environmental Protection and Management Plan (RPPLH), which is one of the provincial authorities as set forth in Law of the Republic of Indonesia Number 23 of 2014. Such regulation may be the entry point towards sustainable development. It may be followed by adopting the Green Regional Budget Plan (Green APBD) to finance more environmentally friendly economic activities. The formulation of regional policies in the form of regional regulations, regulations of the regional heads, and decision letters of the regional heads to exercise regional authority are in accordance with the provisions of Article 17 paragraph 1 of Law of the Republic of Indonesia Number 23 of 2014.
In addition, it should be encouraged that the formulation of regional development planning policies should adopt sustainable principles. For example, as defined in Law Number 25 Year 2004 regarding National Development Planning System and Law of the Republic of Indonesia Number 23 of 2014, Provincial Governments shall determine the Long Term Regional Development Plan (RPJPD), the RPJPD shall be referred to in the preparation of the Medium Term Regional Development Plan (RPJMD), and subsequently the RPJMD is translated into
annual planning and budgeting (RKPD and APBD). It means that the implementation of sustainable development policies should be initiated from long-term regional development plan, to be carried to the medium-term regional development planning plan, and reflected in the annual planning and budgeting.
The results of this study also suggest improving the supervision and monitoring of the regional government by the central government for the issues identified as the authority of the central government as stated in Law of the Republic of Indonesia Number 23 of 2014. This is done by incorporating the principles of sustainable development into regulation or policy, as well as in the preparation of norms, standards, procedures and criteria by each ministry/agency at the central government, which will serve as guidelines for local government in governing, developing and empowering the community in the region.
Finally, it should be acknowledged that regional disparities are still a major concern in Indonesia. Gaps concerning the environmental, economic and social aspects of development among regions in Indonesia are still wide. Therefore, policies that minimize such differences should be encouraged. The central government, for example, may use different mechanisms in assessing sustainability criteria based on regional performance. It is well
Table 13.
Cross-tabulation of Region III Kalimantan-Sulawesi Flag Nawa Cita-MEA
known that Eastern provinces such as Papua and West Papua, rich in natural resources and vast forest areas, are less developed by economic indicators (GRDP). However, if sustainable development indicators are used, such as the forested area, low pollution, resource efficiency, and local wisdom, the provinces of Papua and West Papua may have higher development performance scores than in Java and Sumatra.
IV. Conclusion
Of the twenty-one indicators selected, seven highly sensitive indicators, namely (1) percentage of the length of the paved road to width of the area (economic dimension), (2) GRDP per capita (economic dimension), (3) Gini ratio (economic dimension), (5) percent CO2 emissions to population (environmental dimension), and (7) percentage of women's representation in parliament (dimension institutional). These seven indicators are very effective in improving the sustainability of provincial development in Indonesia. Of the 33 provinces studied, the twenty-four provinces of Indonesia are at a moderate level of sustainability.
Assessment of sustainability in the context of regional development in Indonesia is urgent to do. This research seeks to bridge and overcome challenges to create sustainable regional development in Indonesia through measurement using sustainable regional development indicators. This study shows that Bussines As Usual (BAU) tends to be unsustainable for almost all regions. Meanwhile, the Nawa Cita-MEA scenario tends to deliver mixed results across regions in Indonesia. The development of SDGs scenarios, however, consistently provides better sustainable development across the regions in Indonesia. This study provides a lesson that policy makers may be able to use in assessing how sustainable development can be done easily given the complexity of the expected indicator.
Acknowledgement
We would like to thank and convey our appreciation to the Director General of Regional Autonomy and the Director General of Regional Development, for all the support for during the commencement of this study, The Head of Education and Training Agency, Ministry of Home Affairs for its funding assistance through the Ministry of Home Affairs Budget for the Year 2013-2015 that enable this study and research to be performed.
V. References
Erlinda, N. (2016). Pembangunan Wilayah Berkelanjutan di Provinsi Jambi dan Implikasi
Model Jamrud. Bogor Agricultural University.
Retrieved from http://repository.ipb.ac.id/
handle/123456789/81527
Fauzi, A., & Oxtavianus, A. (2014). The Measurement of Sustainable Development in Indonesia.
Jurnal Ekonomi Pembangunan, 15(1),
68–83. Retrieved from http://hdl.handle. net/11617/4780
Jesinghaus, J. (2007). Indicators: Boring Statistics or the Key to Sustainable Development? In T. Hák, B. Moldan, & A. L. Dahl (Eds.), Sustainability
Indicators: A Scientific Assessment (pp. 83–95). Washington, D.C.: Island Press.
Law of the Republic of Indonesia Number 17 of 2007 concerning the National Long-Term Development Plan Year 2005-2025, Pub. L. No. 17 (2007). Indonesia.
Law of the Republic of Indonesia Number 23 of 2014 on Regional Government, Pub. L. No. 23 (2014). Indonesia.
Nijkamp, P., & Vreeker, R. (2000). Sustainability Assessment of Development Scenarios: Methodology and Application to Thailand.
Ecological Economics, 33, 7–27.
Poveda, C. A., & Lipsett, M. G. (2011). A Review of Sustainability Assessment and Sustainability/ Environmental Rating Systems and Credit Weighting Tools. Journal of Sustainable
Development, 4(6), 36–55. http://doi.
org/10.5539/jsd.v4n6p36
Regulation of the Minister of Home Affairs of the Republic of Indonesia Number 56 of 2015 concerning Code and Data of Administrative Government Region, Pub. L. No. 56 (2015). Indonesia.
Regulation of the President of the Republic of Indonesia Number 5 of 2010 concerning the National Medium Term Development Plan Year 2010-2014, Pub. L. No. 5 (2010). Indonesia. Rustiadi, E., Saefulhakim, S., & Panuju, D. R. (2009).
Perencanaan dan Pengembangan Wilayah.
Jakarta: Yayasan Obor Indonesia.
Saefulhakim, S. (2004). Modul Pemodelan. Bogor: Fakultas Pertanian IPB.
Shmelev, S. E., & Rodríguez-Labajos, B. (2009). Dynamic Multidimensional Assessment of Sustainability at the Macro Level: The Case of Austria. Ecological Economics, 68(10), 2560–2573. http://doi.org/10.1016/j. ecolecon.2009.03.019
Spangenberg, J. H., Pfahl, S., & Deller, K. (2002). Towards Indicators for Institutional Sustainability: Lessons from an Analysis of Agenda 21. Ecological Indicators, 2(1–2), 61–77. http://doi.org/10.1016/S1470-160X(02)00050-X
Management, 38(4), 688–702. http://doi. org/10.1007/s00267-004-0352-y
United Nations. (2015). Transforming Our World: the 2030 Agenda for Sustainable Development.
General Assembly 70 Session.
World Bank. (2009). Investing in a More Sustainable Indonesia: Country Environmental Analysis.