Hydrogeology
Field Manual
Willis D. Weight, Ph.D., P.E.
Montana Tech of The University of Montana Butte, MontanaSecond Edition
part of this publication may be reproduced or distributed in any form or by any means, or stored in a database or retrieval system, without the prior written permission of the publisher.
0-07-160120-1
The material in this eBook also appears in the print version of this title: 0-07-147749-7.
All trademarks are trademarks of their respective owners. Rather than put a trademark symbol after every occurrence of a trademarked name, we use names in an editorial fashion only, and to the benefit of the trademark owner, with no intention of infringement of the trademark. Where such designations appear in this book, they have been printed with initial caps.
McGraw-Hill eBooks are available at special quantity discounts to use as premiums and sales promotions, or for use in corporate training programs. For more information, please contact George Hoare, Special Sales, at [email protected] or (212) 904-4069.
TERMS OF USE
This is a copyrighted work and The McGraw-Hill Companies, Inc. (“McGraw-Hill”) and its licensors reserve all rights in and to the work. Use of this work is subject to these terms. Except as permitted under the Copyright Act of 1976 and the right to store and retrieve one copy of the work, you may not decompile, disassemble, reverse engineer, reproduce, modify, create derivative works based upon, transmit, distribute, disseminate, sell, publish or sublicense the work or any part of it without McGraw-Hill’s prior consent. You may use the work for your own noncommercial and personal use; any other use of the work is strictly prohibited. Your right to use the work may be terminated if you fail to comply with these terms.
THE WORK IS PROVIDED “AS IS.” McGRAW-HILL AND ITS LICENSORS MAKE NO GUARANTEES OR WARRANTIES AS TO THE ACCURACY, ADEQUACY OR COMPLETE-NESS OF OR RESULTS TO BE OBTAINED FROM USING THE WORK, INCLUDING ANY INFORMATION THAT CAN BE ACCESSED THROUGH THE WORK VIA HYPERLINK OR OTHERWISE, AND EXPRESSLY DISCLAIM ANY WARRANTY, EXPRESS OR IMPLIED, INCLUDING BUT NOT LIMITED TO IMPLIED WARRANTIES OF MERCHANTABILITY OR FITNESS FOR A PARTICULAR PURPOSE. McGraw-Hill and its licensors do not warrant or guarantee that the functions contained in the work will meet your requirements or that its operation will be uninterrupted or error free. Neither McGraw-Hill nor its licensors shall be liable to you or anyone else for any inaccuracy, error or omission, regardless of cause, in the work or for any damages resulting therefrom. McGraw-Hill has no responsibility for the content of any information accessed through the work. Under no circumstances shall McGraw-Hill and/or its licensors be liable for any indirect, incidental, special, punitive, consequential or similar damages that result from the use of or inability to use the work, even if any of them has been advised of the possibility of such damages. This limitation of liability shall apply to any claim or cause whatsoever whether such claim or cause arises in contract, tort or otherwise.
We hope you enjoy this
McGraw-Hill eBook! If
you’d like more information about this book,
its author, or related books and websites,
please
click here.
Professional
Willis D. Weight, Ph.D., P.E., is Head of the Hydrogeology Program within the Department of Geological Engineering at Montana Tech of The University of Montana in Butte. He is widely recognized for his hydrogeology research and related engineering work.
v
Contents
Preface xiii
Chapter 1. Field Hydrogeology 1
1.1 Hydrologic Cycle 2
1.2 Water-Budget Analysis 4
1.3 Water-Budget Myth 10
Sustainability 11
Water as a commodity 12
Changes in flow systems 13
1.4 Sources of Information on Hydrogeology 14
1.5 Site Location for Hydrogeologic Investigations 16
1.6 Taking Field Notes 18
Daily information 19
Lithologic logs 19
Well drilling 22
Well completion 24
Pumping tests 25
Water-quality measurements 27
1.7 Groundwater Use 29
1.8 Groundwater Planning 30
Source-water protection studies 31
1.9 Summary 35
Chapter 2. The Geology of Hydrogeology 37
2.1 Geologic Properties of Igneous Rocks 38
Extrusive rocks 38
Andesite 42
Basalt 46
Intrusive rocks 49
2.2 Geologic Properties of Metamorphic Rocks 55
Plate tectonic settings of metamorphic rocks 57
2.3 Geologic Properties of Sedimentary Rocks 59
Weathering 61
Transport of sediment and depositional environments 64
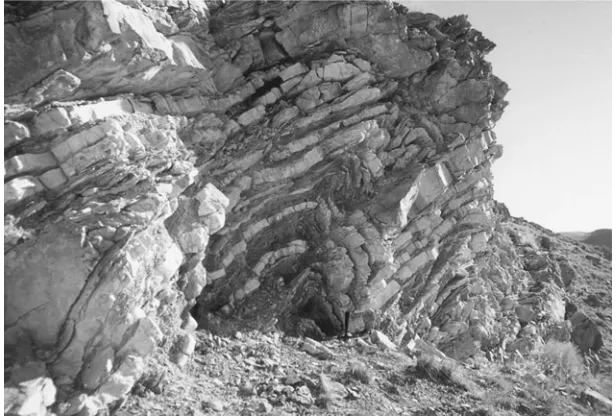
2.4 Structural Geology 68
Strike and dip 69
Fold geometry 73
Faulting 74
Other observations in structures 78
Structural effects in karst areas 79
2.5 Geologic Time 84
2.6 Using Geologic Information 87
Chapter 3. Aquifer Properties 91
3.1 From the Surface to the Water Table 91
3.2 Porosity and Aquifer Storage 94
Porosity 94
Storativity 101
3.3 Movement of Fluids through Earth Materials 104
Transmissivity 110
3.4 Aquifer Concepts 111
Unconfined aquifers 113
Confined and artesian aquifer 114
Confining layers 116
Chapter 4. Basic Geophysics of the Shallow Subsurface 125
4.1 Common Targets for Shallow Geophysical Investigation 126 4.2 Approaches to Shallow Subsurface Investigations 126
4.3 Overview of Geophysical Techniques 127
Methods 127
Limitations 127
4.4 Matching Geophysical Methods to Applications 129
4.5 Geophysical Survey Planning 130
4.6 Seismics 131
Basic principles 131
Refraction surveying 140
Reflection surveying 143
4.7 Surface Wave Methods 148
4.8 Electrical 151
Basic principles and units 151
Resistivity 152
Induced polarization (IP) 162
Spontaneous potential (SP) 163
Telluric and magnetotelluric methods 164
Electromagnetic (EM) techniques 165
Chapter 5. Groundwater Flow 173
5.1 Groundwater Movement 173
Hydraulic head 176
Hydraulic head and Darcy’s law 179
5.2 Flow Nets 183
Vertical groundwater flow 188
Gaining and losing systems 189
Refraction of groundwater flow 191
5.3 Level Measurements in Groundwater Monitoring Wells 192
Defining level measurements 194
Access to wells 197
Measuring points 200
Water-level devices 201
Practical design of level-measurement devices 211
Other practical applications 215
Summary of level-measurement methods 220
5.4 Misinterpretation of Water-Level Data 222
Shallow and deep wells 223
Short versus long screen lengths 227
Combining different aquifers 228
5.5 Summary 229
Chapter 6. Groundwater/Surface-Water Interaction 231
6.1 Fluvial Plain 232
Channel orientation and groundwater/surface-water exchange 234
6.2 Hyporheic Zone 236
Channel geomorphology and stream connectivity 237
6.3 Stream Health 240
6.4 Field Methods to Determine Groundwater/Surface-Water Exchange 242
Stream gauging 243
Chapter 7. Water Chemistry Sampling 287
7.1 Have a Plan 287
Quality assurance 289
What are you sampling for? 290
Make a checklist 291
7.2 Collecting Groundwater Samples 292
Sample retrieval 292
Passive sampling 293
Filtration, preservation, and labeling 294
Chain of custody 297
Cleaning and decontamination 297
7.3 Field Measurements 298
Specific conductance 300
Dissolved oxygen and redox state 303
Alkalinity 304
Turbidity and total suspended solids 307
7.4 Laboratory Analyses 307
Dissolved metals 307
Anions 308
Organic compounds 308
Total dissolved solids 309
Other types of analyses 310
7.5 Interpreting Lab Results 312
Data validation 312
Charge balance 314
Speciation of dissolved inorganic carbon 315
Hardness and sodium adsorption ratio 316
7.6 Tips on Reporting Data 317
7.7 Summary 319
Chapter 8. Drilling and Well Completion 321
8.1 Getting Along with Drillers 321
8.2 Rig Safety 324
Summary of safety points 328
Other considerations 329
8.3 Drilling Methods 330
Cable-tool method 331
Forward (direct) rotary method 335
Reverse circulation drilling 341
Casing advancement drilling methods 344
Auger drilling 346
Direct-push methods 347
Sonic or rotasonic drilling 351
Mini-sonic 351
Cone penetrometer testing (CPT) 351
Horizontal drilling 353
8.4 How to Log a Drill Hole 354
Describing the cuttings 358
Lag time 358
How much water is being made and
where did it come from? 359
8.5 Monitoring-Well Construction 360
Objectives of a groundwater monitoring program 361
Installing a groundwater monitoring well 363
Well completion materials 369
Well development 371
Completion of multilevel monitoring wells 373
8.6 Production-Well Completion 374
Sieve analysis 375
Well screen criteria 378
Screen entrance velocity 382
Well completion and development 385
8.7 Water Witching 390
Chapter 9. Pumping Tests 395
9.1 Why Pumping Tests? 395
9.2 Pumping-Test Design 396
Geologic conditions 397
Distance-depth requirements of observation wells 400
9.3 Step-Drawdown Tests 404
Well efficiency 405
Laminar versus turbulent flow 406
9.4 Setting Up and Running a Pumping Test 411
Power supply and pumps 412
Data loggers, transducers, and well sentinels 418
E-tapes 424
Discharge system 425
Duct tape 427
Setup procedure 427
Frequency of manual readings 431
Safety issues 432
9.5 Things that Affect Pumping Test Results 433
Weather and barometric changes 433
Other apparent sources and sinks 433
9.6 Summary 435
Chapter 10. Aquifer Hydraulics 437
10.1 Wells 438
Cone of depression 438
Comparison of confined and unconfined aquifers 441
10.2 Traditional Pumping-Test Analytical Methods 443
Cooper-Jacob straight-line plot 448
Single-well tests 455
Casing storage 456
Leaky-confined and semiconfined aquifers 458
Specific yield and vertical hydraulic conductivity
from unconfined aquifer tests 463
Distance-drawdown relationships 470
Predictions of distance-drawdown from time-drawdown 472
Recovery plots 474
10.3 Specific Capacity 477
10.4 Well Interference and Boundary Conditions 479
Aquifer boundary conditions 481
Image well theory 483
10.5 Partial Penetration of Wells and Estimates
of Saturated Thickness 484
Estimates of the saturated thickness in
unconfined aquifers 486
10.6 Fracture-Flow Analysis 492
Pumping tests in flowing wells 495
10.7 Summary 498
Chapter 11. Slug Testing 501
11.1 Field Methodology 502
Performing a slug test 505
Slug tests using well sentinels 508
11.2 Common Errors Associated with Performing Slug Tests 509
Monitoring well completion issues 509
Equipment problems 511
11.3 Analyzing Slug Tests—The Damped Case 512
Hvorslev method 513
Bouwer and Rice slug test 516
Common errors made in analyzing
slug test data 523
How to analyze slug tests for both damped
methods from a single plot 524
11.4 Analyzing Slug Tests—Underdamped Case 525
Nature of underdamped behavior 526
Effective stress and elastic behavior 529
van der Kamp method 533
Kipp method 535
Methodology 537 Comparison of two methods and discussion
of storativity 542
11.5 Other Observations 543
Chapter 12. Vadose Zone Hydrogeology: Basic Principles,
Characterization, and Monitoring 547
12.1 Energy Status of Pore Water 548
12.2 Water Content 551
12.3 Soil-Water Retention Curves 551
12.4 Darcy’s Equation and Unsaturated Flow Parameters 554
Hydraulic gradient 554
Unsaturated hydraulic conductivity 555
12.5 Soil-Water Budget 559
Infiltration 559
Evaporation and transpiration 562
12.6 Water Storage and Deep Percolation 565
12.7 Physical Methods 565
Soil lysimeters 565
Water balance 566
Darcy flux in the vadose zone 566
Numerical models of soil-water flow 566
Chemical methods in the vadose zone 567
12.8 Characterizing Hydraulic Properties 569
Soil-water characteristic curve 569
Saturated hydraulic conductivity 571
Unsaturated hydraulic conductivity 577
Estimating unsaturated hydraulic conductivity 579
12.9 Vadose Zone Monitoring 583
Pressure head soil-water potential 583
Indirect methods 586
Moisture content 589
Soil gas sampling and monitoring 592
Pore liquid sampling 593
Chapter 13. Karst Hydrogeology 603
13.1 Introduction 603
13.2 Karst Types 606
Covered and exposed karst 606
Cone and tower karst 607
Cockpit karst 608
Pavement karst 608
Fluviokarst 608
Sinkhole karst 609
Karst in the literature 609
13.3 Carbonate Rocks 610
Limestone 611
Folk classification 612
Dunham classification scheme 613
Dolomite 614
13.4 Recharge Areas 615
13.5 Surface Karst Features 616
Sinkholes 616
Twentieth century theories on cave formation 629
Controlling factors in cave formation 629
Cave passageways 630
Speleothems 631
13.7 The Karst Aquifer 633
13.8 Land Use Problems in Kart 636
Human impact on karst groundwater resources 636
13.9 Investigative Methods in Karst 638
Groundwater dye tracing 638
Hydrographs and chemographs 639
Geophysical techniques 641
Electrical survey 641
Frequency domain electromagnetic survey 641
Ground penetrating radar 641
Gravity survey 641
Seismic survey 642
13.10 Summary 643
Chapter 14. Tracer Tests—General 651
14.1 Tracer Test Objectives 652
14.2 Tracer Material 652
14.3 Design and Completion of Tracer Test 656
Conceptual design 657
Selection of the initial mass of the tracer
or its concentration 658
Point-source infrastructure 662
Sampling schedule 668 Monitoring 670 Equipment 671
14.4 Common Errors 673
Chapter 15. Tracer Tests—Dye 675
15.1 Utility of Groundwater Tracing 675
15.2 Characteristics of Ideal Tracing Agents 679
15.3 Common Misconceptions about Tracer Dyes 679
15.4 Dye Nomenclature and Properties 681
15.5 Designing a Dye Tracing Study 686
15.6 Sampling and Analysis for Dyes 689
15.7 Detection Limits for Tracer Dyes 695
15.8 Determining Dye Quantities 696
15.9 Summary 698
Appendix A. Unit Conversions Tables 699
Appendix B. Relationship of Water Density and Viscosity
to Temperature 707
Appendix C. Periodic Table 709
Appendix D. Values of W(u) and ufor the Theis
Nonequilibrium Equation 711
Appendix E. Sources of Cave and Karst Information 713
Appendix F. Water Quality Parameters and Their Significance 719
Preface
The first edition of this book, Manual of Applied Field Hydrogeology,
resulted from an enquiry by Bob Esposito of the McGraw-Hill Professional Book Group about Montana Tech of the University of Montana’s long running hydrogeology field camp, which was began in 1985 by Dr. Marek Zaluski (Chapter 14). This course was continued under the direction of John Sonderegger and myself from 1989 to 1996, when John Sonderegger retired. In 1997 Chris Gammons (Chapter 7) came on board, and he has assisted in directing this course until the time of this printing. Bob asked whether we would consider taking the course notes and field tasks and putting it into book form. A detailed outline and pro-posal was submitted, which was professionally reviewed. A very distin-guished reviewer was exceedingly enthusiastic about a book of this scope being produced. During his review he expressed the opinion that “every hydrogeologist with less than 10 years of experience should own this book.” It was also his opinion that there was a burning need to have a reference that inexperienced field hydrogeologists could refer to that would explain things in real world terms. This has been the per-spective in putting together the chapters. Ultimately, McGraw-Hill’s Senior Editor Larry Hager led the team in completing the first edition.
Feedback from readers and reviewers led to the printing format of the second edition Hydrogeology Field Manual. Larry Hager again spear-headed the effort to improve the first edition. Since John Sonderegger had retired, other experts were solicited as contributors to rewrite and expand the first edition. The original chapters were revised and expanded significantly to appeal to a wider audience and expand the scope to appeal to an international audience. The introductory chapters were written to be included as an undergraduate introductory course in hydrogeology, while the other chapters are appropriate to be included for a course or two at the lower graduate level, with a strong field emphasis. The book is specifically useful for a hydrogeology field camp, with enough material to be used for other courses. Chris Gammons, also of Montana Tech’s Department of Geological Engineering rewrote
xiii
Chapter 7 (Water Chemistry Sampling) and Dan Stephens (Daniel B. Stephens & Associates, Inc) from New Mexico rewrote the Vadose Zone chapter (Chapter 12). New material was written to include hydrogeo-logic studies in karst settings, resulting in the addition of two chapters. The significance of karst hydrogeology was written by David Bednar from Arkansas (Chapter 13), followed by a chapter devoted to dye tracing (Chapter 15) written by Tom Aley of Ozark Underground Laboratories in Missouri. The previous Chapter 13 (Tracer Tests) written by Marek Zaluski was moved to Chapter 14 with a new title (Tracer Tests— General) followed by the new chapter by Tom Aley (Tracer Tests—Dye) to provide two perspectives on this important topic. The result is a book intended for use by students and professionals alike as a reference that can be pulled off the shelf again and again and brought into the field as a useful reference.
Readers are encouraged to study the examples throughout the book. They stand out in a different font and represent helpful hints and exam-ples from many years of the author’s experience. They also contain little anecdotes and solutions to problems that can help save hours of mistakes or provide an experienced perspective. Calculations in the examples are intended to illustrate proper applications of the principles being discussed. To help illustrate field examples, the author has taken many photos and created line drawings in a hope to make the reading more understandable and interesting. Examples come from previous field camps, consulting, and work experience.
It is helpful for the practicing hydrogeologist to be able to “read up” on a topic in field hydrogeology without having to wade through hun-dreds of pages. Students and other entry-level professionals can use this reference to help them overcome the “panic” of the first few times of performing a new task such as logging a drill hole, supervising the installation of a monitoring well, or analyzing slug-test data. It is felt that if this book helps someone save time in the field or reduces the panic of performing a field task then this effort will have been worth it.
When people go fishing, they may try all sorts of bait, tackle, and fish-ing techniques; however, without some basic instruction on proper methodologies, the lines get tangled, the fish steal the bait or spit out the fly, or the person fishing becomes frustrated. Even people who are considered to be fishing experts have bad days; however, they always seem to catch fish most of the time. Hydrogeology Field Manual takes a “teaching how to fish” approach.
It is always a dilemma to decide what to include and what to leave out in writing a book like this. It is the author’s hope that the content is useful. The ideas and feedback from you, the readers, have been invaluable and led to the improvements made. Please continue to send ideas that can be considered for the future. A significant effort was made to acknowledge all photographs and figures contributed by others. If any errors are found, they are the responsibility of the authors. We would appreciate readers’ comments, corrections, and suggestions for future editions.
Acknowledgments
I would like to thank the many individuals who helped review the chap-ters and provided some of the photos used in this book. Peter Norbeck and John Metesh of the Montana Bureau of Mines and Geology in Butte, Montana, have provided several helpful comments on some of the chap-ters. Bill Uthman of the Montana Department of Resources and Conservation (DNRC) provided some helpful suggestions for the expan-sion of Chapter 1. Mark Sholes, Diane Wolfgram, and Hugh Dresser (emeritus) from the Department of Geological Engineering at Montana Tech of the University of Montana have provided helpful suggestions on Chapter 2. Hugh Dresser provided all of the stereo pairs found in the book. Peter Huntoon provided some of the photos for Chapter 2 and provided helpful encouragement and examples. He was also a mentor to me during my graduate school years. John Sonderegger was gracious enough to “have others that are currently involved” replace his chapters from the first edition (Chapters 7 and 12). John was an invaluable mentor during my early years at Montana Tech. He was always good at asking the right questions. Marvin Speece was instrumental in review-ing Chapter 4.
discussed in Chapter 7. Dan O’Keefe of O’Keefe Drilling in Butte, Montana, was very helpful in reviewing the drilling techniques section and in providing photos for Chapter 8. Mark DuBois of Newmont Mining Corporation provided some invaluable editorial comments and was a major contributor of the first edition’s errata sheet. Other cooperating specialists, especially Herb and Dave Potts (Potts Drilling in Bozeman, Montana), and Fred Schmidt, Tom Patten, and John LaFave of the Montana Bureau of Mines and Geology in Butte, Montana, have given significant input. Kevin Mellot was very helpful in providing informa-tion and scanning several of the slides used in the figures. Readers have provided other valuable comments and suggestions.
I would especially like to thank the contributors for their chapters who have enriched this book and allowed its depth and breadth to become sig-nificantly more useful. Curtis Link contributed all of the content for Chapter 4, including all of the line drawings. Chris Gammons has been a colleague and friend now for over 10 years—he contributed all of Chapter 7, and also made valuable suggestions on the introductory chapters. Dan Stephens contributed his expertise in rewriting the Vadose Zone chapter (Chapter 12). Marek Zaluski contributed Chapter 14 and some of the photos. David Bednar and Tom Aley made the karst hydrogeology chapters (Chapters 13 and 15) possible. The combined efforts of the authors rep-resent nearly 200 years of experience.
I wish to thank the many students over the years for being the sub-jects of photos and providing good questions and discussion. Kay Eccleston was instrumental in transforming all of the chapters into desktop publishing form, and providing the format for all the text, and constructing the whole first edition of the book.
Finally, I wish to acknowledge the support of my wife Stephanie, our seven children (some who were used in the photos), our growing number of grandchildren, and my parents who make life so grand.
WILLISD. WEIGHT
1
Field Hydrogeology
Water is a natural resource unique to the planet Earth. Water is life to us and all living things. After discounting the volumes represented by oceans and polar ice, groundwater is the next most significant source. It is approximately 50 to 70 times more plentiful than surface water (Fetter 1994). Understanding the character, occurrence, and movement of groundwater in the subsurface and its interaction with surface water is the study of hydrogeology. Field hydrogeology encompasses the meth-ods performed in the field to understand groundwater systems and their connection to surface water sources and sinks.
A hydrogeologist must have a background in all aspects of the hydro-logic cycle. They are concerned with precipitation, evaporation, surface water, and groundwater. Those who call themselves hydrogeologists may also have some area of specialization, such as the vadose zone, computer mapping, well hydraulics, karst hydrogeology, aquifer storage and recovery (ASR), public water supply, underground storage tanks, source-water protection areas, and surface-water groundwater interac-tion, actually each of the chapters named in this book and beyond.
The fun and challenge of hydrogeology is that each geologic setting, each hole in the ground, each project is different. Hydrogeologic principles are applied to solve problems that always have a degree of uncertainty. The reason is that no one can know exactly what is occurring in the subsurface. Hence, the challenge and fun of it. Those who are fainthearted, do not want to get their hands dirty, or cannot live with some amount of uncer-tainty are not cut out to be field hydrogeologists. The “buck” stops with the hydrogeologist or geologist. It always seems to be their fault if the design does not go right. Properly designed field work using correct principles is one key to being a successful field hydrogeologist. Another important aspect is being able to make simple common-sense adjustments in the field to allow the collection of usable data. The more level-headed and adaptable one is, the more smoothly and cost-effectively field operations can be run.
1
Hydrogeology is a fairly broad topic. Entry-level professionals and even well-seasoned, practicing hydrogeologists may not have attempted one or more of the topics described in this manual. New field tasks can be stressful and having to read a large reference book on one subject can be cumbersome. The objective of this book is to provide a brief presen-tation on the general topics associated with field hydrogeology. Field methods, tasks, pitfalls, and examples using ideal and nonideal behavior will be presented, in hopes of reducing stress and panic the first few times performing a new task.
1.1 Hydrologic Cycle
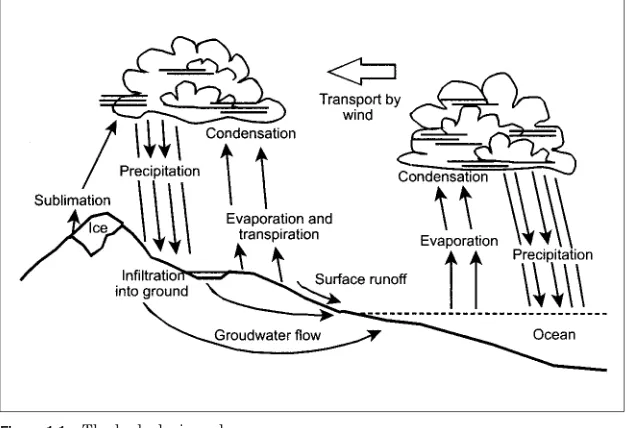
The hydrologic cycle is an open system powered by solar radiation. Water from the oceans evaporates into the atmosphere, is carried to land as precipitation, and eventually returns back to the oceans. Solar radiation is more intense nearer the equator, where rising air condenses and falls back onto the world's rain forests. The movement of moisture into the atmosphere and back onto the land surface is an endless cycle. Approximately five-sixths of the water that evaporates upward comes from our oceans; however, only three-fourths of the water that falls from the sky, in the form of precipitation, falls back into the oceans (Tarbuck and Lutgens 1993). This means one-fourth of all water that falls to Earth falls on land. Some of this water is stored in ice caps and glaciers, some runs off from the earth's surface and collects in lakes and various drainage networks, some replenishes the soil moisture, and some seeps into the ground. This is important in supplying the land masses with freshwater. Once the water reaches the land, it takes a variety of pathways back to the oceans, thus completing the hydrologic cycle (Figure 1.1). Other than ocean water (97.2%) and frozen water (2.1%), groundwater (0.6%) accounts for a significant volume of the Earth's water (Fetter 1994).
Having a general understanding of the hydrologic cycle is important for perspective, for keeping the big picture in mind. The occurrence and behavior of groundwater in the field can be tied back to this big picture. For example, global climatic conditions may contribute to why there are more or less wet years or help explain why dry years occur, which later affects water availability in storage. Are decreasing trends in hydro-graphs in wells tied to water use or drought conditions that may have depleted storage?
The upwelling brings nutrient-rich waters important for fisheries and other marine ecosystems. Cool waters are normally within 50 m of the surface. The trade winds blow toward the west across the tropical Pacific, resulting in the surface sea elevation being 0.5 m higher in Indonesia than in Ecuador (Philander 1990). During the year of an El Nin~o, the warm water off the coast of South America deepens to approximately 150 m, effectively cutting off the flow of nutrients to near-surface fisheries. The trade winds relax and the rainfall follows the warm water eastward, resulting in flooding in Peru and the Southern United States and drought in Indonesia and Australia (NOAA 2000). A strong El Nin~o year occurred during 1997 to 1998.
Many hydrogeologists may be aware that global conditions are chang-ing, but fail to apply this to the local drainage at hand. It is easy to become focused on only local phenomenon, such as within a given water-shed. Sometimes one can get too close to a subject to be able to have the proper perspective to understand it.
There is the story of the four blind men who came in contact with an elephant. Each described what they thought an elephant looks like. One felt the trunk and exclaimed that the elephant must be like a vacuum at a local car wash. Another felt the tail and said that an ele-phant was like a rope. Yet, another felt the leg and said an eleele-phant must be like a tree. Finally, one felt the ears, so big and broad, and thought the elephant must look like an umbrella. In their own way each was right, but presented only a part of the picture. Understanding the big picture can be helpful in explaining local phenomena.
Figure 1.2 Aerial view of a dendritic patterned watershed.
1.2 Water-Budget Analysis
Most groundwater studies that a typical consulting firm may be involved with take place within a given watershed area (Figure 1.2). The hydro-logic cycle is conceptually helpful, but a more quantitative approach is
to perform a water-budget analysis, which will account for all of the
inputs and outputs to the system. It is a conservation of mass approach. This can be expressed simply as:
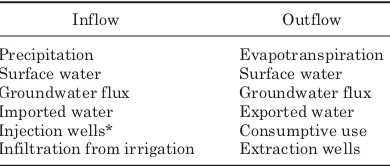
INPUT OUTPUT STORAGE (1.1)
The term STORAGE (change in storage) refers to any difference
It is often difficult to separate transpiration from plants and evapora-tion from a water surface, therefore, they are combined together into a term called evapotranspiration or ET. In any area with a significant amount of vegetation close to the water table, there may be diurnal effects in water levels. Plants and trees act like little pumps, which are active during daylight hours. During the day, ET is intense and nearby water levels drop and then later recover during the night. Diurnal changes from plants and diel cycling can also cause changes in water quality in streams (Chapters 6 and 7). Accounting for all the components within water-budget analyses are difficult to put closure on, although they should be attempted. Simplifying assumptions can sometimes be helpful in getting a general idea of water storage and availability. For example, it can be assumed that over a long period of time (e.g., more than one year) that changes in storage are negligible. This approach was taken by Toth (1962) to form a conceptual model for groundwater flow, by assuming the gra-dient of the water table was uniform over a one-year period, although the surface may fluctuate up and down. This model is also useful when per-forming back-of-the-envelope calculations for water availability.
Example 1.2 The Sand Creek drainage basin is located 7 mi (11.4 km) west of Butte, Montana (Figure 1.3). The basin covers approximately 30 mi2(7,770 ha). In 1992, the land was zoned as heavy industrial. In 1995, there were two existing factories with significant consumptive use. The author’s phone rang one afternoon, and the local city manager calling from a meeting on a speaker phone wanted to know how much additional water was available for devel-opment. The question was posed as to whether anyone was willing to pay for drilling a test hole so that a pumping test could be performed. After the laugh-ter from the group subsided, they were informed that information to provide a quantitative answer was limited but that a number would be provided as a rough guess until better information could be obtained and that an answer would be forthcoming in a few minutes. Fortunately, there were some water-level data from which a potentiometric surface could be constructed (Chapters 3 and 5). From the potentiometric surface and a topographic map, a hydraulic gradient and an aquifer width were estimated. A probable range of values was estimated for the hydraulic conductivity (Chapter 3), and a guess was given TABLE 1.1 Major Inflow and Outflow Components
Inflow Outflow Infiltration from irrigation Extraction wells
for aquifer depth. Darcy’s law was used to estimate the volume of water moving through a cross-sectional area within the watershed per unit of time (Chapter 5). This quantity was compared with the water already being used by the existing industrial sources. It was reasoned that if the existing con-sumptive use was a significant portion of the Darcian flow volume (greater than 20%), it wouldn’t look like much additional development could be toler-ated, particularly if the estimated contribution from precipitation did not look all that great. The local city manager was called back and provided with a preliminary rough guess of volume ranges. The caveat was that the answer provided was an extremely rough estimate, but did have some scientific basis. It was also mentioned that the estimate could be greatly strengthened by drilling test wells and performing additional studies.
Performing water-budget analyses is more difficult if there is signif-icant consumptive use or if water is being exported. Sometimes there is a change in storage from groundwater occupying saturated media that ends up in a surface-water body. For example, in the Butte, Montana, area, short-term changes in storage can generally be attributed to groundwater flowing into a large open pit known as the Berkeley Pit (Burgher 1992). Water that was occupying a porosity from less than 2% in granitic materials and greater than 25% in alluvial materials was being converted into 100% porosity in a pit lake.
Example 1.3 Many investigations have been conducted in the Butte, Montana, area as a result of mining, smelting, and associated cleanup activities. It was desirable that a water-budget analysis be conducted in the Upper Silver Bow Creek Drainage to better manage the water resources available in the area. Field stations were established at two elevations, 5,410 ft and 6,760 ft (1,650 m and 2,060 m) to evaluate whether precipitation and evaporation rates varied according to elevation. Within the 123 mi2 (31,857 ha) area, there were no historical pan evaporation data (Burgher 1992) (Figure 1.4). The period of study was from August 1990 to August 1991.
Part of the water balance required accounting for two sources of imported water from outside the area. One source was water from the Big Hole River, imported over the Continental Divide to the Butte public water supply system. Another
source was water from Silver Lake, a mountain lake west of Anaconda, Montana, connected via a 30-mile (49-km) pipeline to mining operations northeast of Butte.
The water-budget equation used was:
PQimp ET QsoQuoQexp Sn0 (1.2)
wherePprecipitation from rain or snow
Qimp imported water from the Big Hole River and Fish Creek (in
parenthesis below)
ETevapotranspiration
Qsosurface outflow at the western edge of the valley
Quoestimated groundwater outflow
Qexpexported water through mining activities
Schange in storage in the system groundwater to surface water (Berkeley Pit)
nerror term, net loss or gain
Precipitation was higher at the upper site (13.35 in, 339 mm) compared to the lower site (10.5 in, 267 mm), while evaporation values were similar (23.79 in, 604 mm and 23.46 in, 596 mm). All values in Equation 1.2 were calculated in units of millions of gallons per day, where the error term is used to balance the equation. The results are shown below:
112.73 (9.18 5.20) 113.34 12.25 0.15 1.40 5.32 5.35 0
One question that could be asked is, “Is more water within the region being used than is coming in?” Some areas have such an abundance of water that much development can still take place with little effect, while other areas are already consuming more water than their system can stand. An inventory of water use and demand needs to be taken into account if proper groundwater management is to take place.
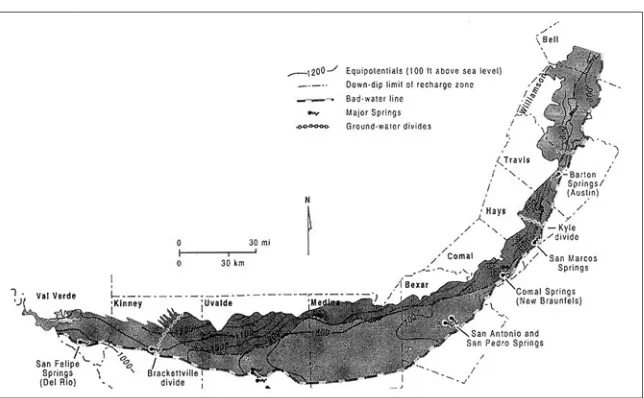
Example 1.4 The Edwards aquifer of central Texas is an extensive karsti-fied system (Chapters 2 and 13) in Cretaceous carbonate rocks (Sharp and Banner 1997). Historical water-balance analysis shows that this aquifer receives approximately 80% of its recharge via losing streams (Chapter 6) that flow over the unconfined portions of the aquifer (Chapter 3). The amount of recharge has varied significantly over time and seems to be connected to amount of stream flow (Figure 1.5). The average recharge between 1938 and 1992 was 682,800 acre ft/year (26.6 m3/s), reaching a maximum of 2,486,000 acre ft/year (97 m3/s) in 1992 and a minimum of 43,700 acre ft/year (1.7 m3/s) during 1956 (Sharp and Banner 1997). Other sources of recharge include leakage from water mains and sewage lines in urban areas and cross-for-mational flow where the aquifer thins, especially to the north (Figure 1.5).
Figure 1.5 Edwards aquifer showing hydraulic boundaries, major springs, and equipo-tential lines. [From Sharp and Banner (1997). Reprinted with permission from GSA Today, 1997.]
(Sharp and Banner 1997). Individual well yields are incredible. A single well drilled in San Antonio is reported to have a natural flow rate of 16,800 gpm (1.06 m3/s) (Livingston 1942) and another well drilled in 1991 is likely the high-est yielding flowing well in the world at 25,000 gpm (1.58 m3/s) (Swanson 1991). Figure 1.5 also indicates that other than a few years during the mid-1950s there has always been enough water to meet demands. With the current growth rates in the corridor between San Antonio and Austin Texas, there is a concern about water demands being able to keep up. For example, in 1996 the underdeveloped land north of Austin was being subdivided at a rate of 1 acre every 3 h (Sharp and Banner 1997)!
Complicating matters are the additional roles the Edwards Aquifer plays in supplying water for recreation areas, fresh water critical for nurseries in estu-aries for shrimp, redfish, and other marine animals, and spring water for threatened and endangered species that dwell in them (Sharp and Banner 1997). The Edwards Aquifer is a good example of how water-balance studies can assist in addressing the significant decisions that are continually badgered by special and political interests.
if recharge rates decreased to a particular level when streamflow also decreased? The areal effects of different management scenarios can be observed in the output (Erickson 1995). A simplified approach can be taken by evaluating flow nets (Chapter 5).
1.3 Water-Budget Myth
In articles by John Bredehoeft (1982, 2002) a presentation is made about the water-budget myth. You might be thinking what does this mean and what is going on? The water-budget myth holds that natural aquifer recharge is the measure of the potential yield of the aquifer to wells. It is a myth because it disregards the fact that, over time, the nat-ural recharge to the aquifer determines the natnat-ural discharge from the aquifer. The natural recharge rate, however, is a fixed function of envi-ronmental conditions and is independent of pumping. (Natural recharge is not affected by pumping). Pumping therefore can only reduce the rate of natural discharge from an aquifer by an amount equal to the ground-water development. Although this was argued to be a false idea many years ago by Theis (1940), where he stated that groundwater develop-ment is based on the principle that pumping causes a loss of water somewhere in the hydrologic system. Bredehoeft (2002) and Devlin (2005) point out its persistence in the hydrogeology community.
Groundwater development requires a disruption of the balance or equilibrium between natural recharge and discharge. Groundwater development becomes sustainable only when hydrologic equilibrium is reestablished as groundwater withdrawal is eventually balanced by the capture of an equal amount of discharge from the aquifer. This may require long periods of time (tens to hundreds of years) before a new equilibrium can be reached depending on the distance of pumping from the discharge area and the aquifer properties (Kendy and Bredehoeft 2006). Many streams are partially penetrating (they are only in contact with the upper portion of an unconfined aquifer, Chapters 3, 6, and 10) and therefore the stresses of pumping may be capturing groundwater discharge from the other side of the stream, a phenomenon known as
cross-river flow(Gamache et al. 2003).
quantity of pumping is balanced by a reduction of stream flow (even though this may take a long time), a water right to withdraw ground-water from the well essentially becomes a ground-water right to divert surface water from the stream at that same rate. In groundwater basins where surface-water allocations equal or exceed all of the groundwater dis-charge, groundwater development ultimately becomes a problem of stream over-appropriation and must be managed by retiring existing water rights to augment or mitigate the effects of the requirements of new water rights. (A holistic approach examining the entire watershed is recommended for groundwater management.)
In groundwater basins where surface-water right allocations are less than the requirements for minimum stream flows or other defined pur-poses, there may be an opportunity for groundwater development. The quantity of how much additional groundwater discharge can be captured by a pumping well is known as sustainable yield (Bredehoeft 2002; Sophocleous 2005).
Sustainability
Sustainable development, as defined by Bredehoeft (2006), is the quan-tity of water available to meet present-day needs without compromis-ing the needs of future generations. Here, we can learn from Native Americans because they evaluate most problems looking at least seven generations into the future (Medicine Head 2004 and Brandon 2005). Current scientific thought is that sustainable yield should be evaluated using the tool of numerical groundwater modeling on a total basin scale over hundreds of years (Alley and Leake 2004 and Bredehoeft [2002, 2006]). If recharge rates are sufficiently high, some degree of stream depletion can be justified (Devlin and Sophocleous 2005). Watersheds where the concepts of recharge, discharge, and water consumption are poorly understood may result in disastrous outcomes.
land being irrigated. The overall impact has been a steady decline in the water table (1 m/year), diminished surface stream flows, and saltwater intrusion—truly a groundwater management nightmare.
Kendy (2003) emphasizes the point that hydrogeologists need not only consider what happens to groundwater once it is pumped, but should also be concerned about what happens to that water once it reaches the surface, the water actually consumed. Therefore, trying to stabilize an unconfined aquifer through sound management practices means balancing the budget of the entire hydrologic system (a holistic approach), and not just the aquifer. This is the broader thought process that must be included by those involved in groundwater management.
Water as a commodity
As the demand for freshwater increases, so does its need for manage-ment. The supply and demand for water pushes it into the realm of a commodity (Southwest Hydrology, 2004). The available water, both sur-face and groundwaters, are allocated through the water-right process, where the quantity of water is defined along with a specific beneficial use. Once the water right is defined with a title of ownership that can be transferable, it emerges as a commodity (Southwest Hydrology, 2004). Rural agricultural lands are being converted into expanding urbanized areas that have a demand for water. Every product we consume requires water to produce it. As a result, many water laws in the western United States have changed significantly during the past decade and will undergo more changes in the future. The days of unmetered, low-cost irrigation water will likely be replaced with monitored water-use per-mits, where water can be developed in some areas and transported to water-poor areas for a significant fee.
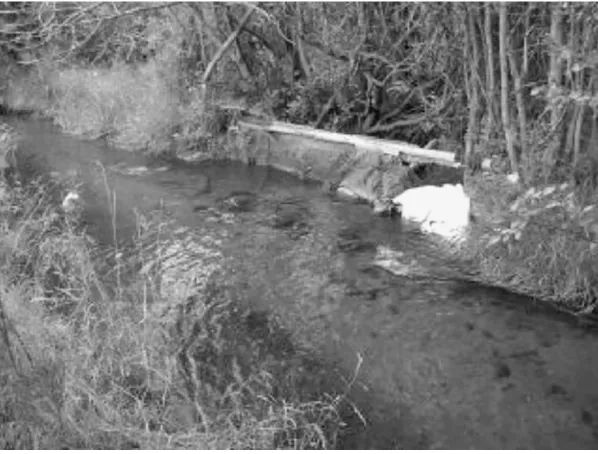
Figure 1.6 Breached irrigation ditch approximately 7 ft (2.1 m) wide using carpet as a dam material.
Complaints from “old-time” surface-water users to fix and maintain their ditches will rend the air, but the reality is that water management has been lax and stronger accountability must be part of the governing process.
Changes in flow systems
1.4 Sources of Information on Hydrogeology
Information on hydrogeology can be gathered from direct and indirect sources. Direct sources would include specific reports where field data have been collected to evaluate the hydrogeology of an area (Todd 1983). Information may include water level (Chapter 5), geologic (Chapter 2), pumping test (Chapters 9 and 10), and groundwater flow direction (Chapter 5). Indirect information are data sources that may be used to project into areas with no information. For example, a few well logs placed on a geologic map and correlated with specific geologic units can be used to project target depths for drilling scenarios.
Since the first edition of this book, there has been an explosion of information accessibility through the Internet. If you need to find spe-cific information about a given topic it is worthwhile to go to your local university. Universities buy the rights to access information databases. Sure you can try a Google search but it is likely you will get tens of thou-sands of hits that would require days of sorting. On the other hand, at a university you could sit at a computer terminal and click on Databases A–Z and a list of library-purchased databases will appear. A few of the most common ones are GeoRef, Engineering Village 2 (formerly Compendex), or Science Direct. During a topical search, specific refer-ences are listed with hotlinks to the full text articles if the library has purchased the database.
Knowing which database to use can be confusing as different vendors buy the rights to use a given database and then change the name for their own marketing purposes. Hence the Compendex database may appear as Engineering Village 2 or Engineering Village II or some other name. An exception to this is GeoRef, which seems to be consistent from library to library.
If you really have to have a thorough search done for very specific information and are willing to pay the required fees (by the minute) you can get a librarian or other search professional to use Dialog or STN databases that will do a simultaneous multi-database search. For example, these programs search a dozen databases simultaneously for very specific information. They are not recommended for general topics.
The following list may give some ideas on where to start. It is by no means an exhaustive list and no specific order is intended:
■ Oil field logs or geophysical logs.
■ Peer review journals Ground Water, Water Resources Research,
Hydrogeology Journal, and a host of other journals with “Water” in their titles (use the Database A–Z search at a local university library).
■ State published or unpublished (incomplete) geologic maps.
■ US Geological Survey (on the WEB at www.usgs.gov): This is a source
of topographical maps and other published information plus a large section on water supply information, including real-time surface water stations and flows.
■ US Evironmental Protection Agency (US EPA) (on the WEB at
www.epa.gov)
■ The National Oceanographic and Atmospheric Association (NOAA)
has a wealth of information about precipitation data (on the WEB at www.noaa.gov).
■ Topographic maps are helpful in locating wells (near building) and
evaluating topography (for recharge or discharge areas) and making geologic inferences (by evaluating shapes of drainage patterns).
■ Structure-contour maps that project the top or bottom of a formation
and their respective elevations.
■ State surveys and agencies are a great source for published
informa-tion within a given State; addiinforma-tionally they have well-log and water-quality databases and other production information. These are often organized by county or Section ,Township, and Range.
■ Libraries have a wealth of current and older published information.
Sometimes the older publications are very insightful. Additionally, many libraries have search engines for geologic and engineering ref-erences, such as GeoRef and Compendex (described above).
■ Long-time landowners can give valuable historical perspectives and
current observations.
■ Master’s and PhD theses have a variety of qualities, so glean what you
can with a grain of salt. Some are very well done while others should not have been published.
■ Summary reports prepared by state agencies on geology, groundwater,
surface water, or water use and demand.
■ Consulting firms and other experienced hydrogeologists.
■ US Geological Survey Water Supply Papers and Open File Reports. ■ County or city planning governments may have information in
Geographical Information System (GIS) formats and have listing of wells, well ownership, or other useful information.
■ Some authors or editors attempt to evaluate all references associated
In most states, a well log is required to be filed each time a well is drilled. Included is the depth, lithologic description, perforation or screened interval, the static water level (SWL), and brief pumping or bailing-test information. This can be used to evaluate depth to water, lithologies, and get a general idea of well yield. Sometimes this information is not reported, as some drillers are hesitant to report unsuccessful wells. If no water is found sometimes the well logs do not get filed, when in reality “no water” reported in a well log is good information. Experienced hydro-geologists learn how to combine a variety of geologic and well-log data-base sources into a conceptual model, from which field decisions can be made.
1.5 Site Location for Hydrogeologic Investigations
As simple as it sounds, the first task is to know where the site is. As a hydrogeologist, you may be investigating a “spill,” evaluating a property for a client who is considering buying the property, locating a produc-tion well, or participating in a construcproduc-tion dewatering project. It is imperative that you know where the site is, so you can assess what existing information there might be. If this is a preexisting site, there will be some information available; however, if you are helping to “site in” a well for a homeowner or a client for commercial purposes on an unde-veloped property, you must know where the property is (see “well drilling” in Section 1.6). Part of knowing where a site is includes both its geography and its geology.
Example 1.5 A phone call came after drilling a 340-ft duster (dry hole). The drill site was chosen near an old, existing homestead cabin. The client (landowner) figured that since the homestead had water, and it was an ideal location for his ranching operation, it would probably make a good site. The driller asked for the location and the drilling commenced. After going 340 ft, with no water in sight, the driller decided to call and get some recommen-dations. The property consisted of more than 600 acres near a small town in western Montana. The section, township, and range were provided. After an initial investigation in the library, geologic and topographic maps were located. The geologic information was superimposed onto the topographic map, and a couple of cross sections were constructed. The target zone would be a coarser-grained member of a lower Cretaceous sandstone. A meeting time and place were arranged. Within minutes of driving down the road from the meeting site, it became evident that the driller was heading to a location different from what was described. Instead of slightly undulating Cretaceous sedimentary rocks, the outcrops were basalt, rhyolite, and Paleozoic carbonates that had been tilted at a high angle. The dry hole had been drilled into a basalt unit, down geologic dip (Chapter 2). It becomes difficult to recommend anything when the structure and geologic setting are uncertain.
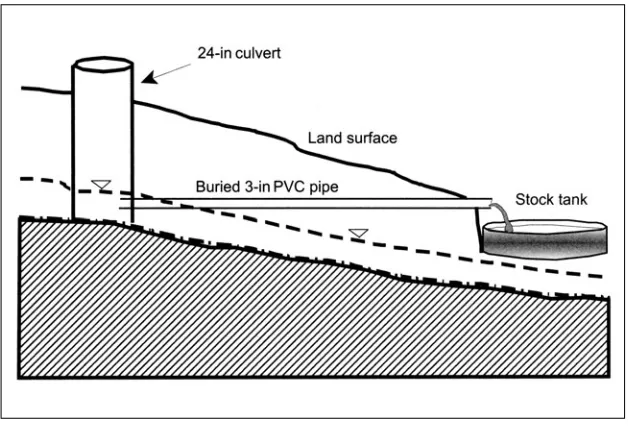
The purpose for well drilling was for stock watering. An initial design was recommended that would not require electrical power. A local drainage area could be excavated with a backhoe and cased with 24-in galvanized culvert material. A 3-in PVC pipe could be plumbed into the “culvert well” at depth and run to a stock tank (Figure 1.7). It was a gravity-feed design and would help keep cows at the far end of his property in the summer.
After this initial meeting, the rancher informed the author that they tried the backhoe method and found that the area had good aquifer materials, but no water. Once the proper location was known, we went back in the office and eval-uated the geology. We determined that this drainage was siteval-uated on a large fault and that any infiltrating water collected would be lost quickly into the Paleozoic limestone formations, and would be found only by drilling well below the surface.
In Example 1.5, an understanding of the geology was essential to locat-ing a target for water development. Even if the geologic settlocat-ing is known, modifications due to structural features may need to be made. Discussion of the geology of hydrogeology is further discussed in Chapter 2.
1.6 Taking Field Notes
A field notebook is your memory of events, locations, people, and figures. Without decent field notes, it will be difficult to reconstruct what happened in the field, let alone remember the important details that are necessary for billing out time and completing reports back at the office. Notebooks should be accessible, sturdy, and weatherproof, or at least you should write with a waterproof pen. Some people prefer to use a pencil (with something hard like a 6H lead), while others prefer pens. What is the prob-lem with using a pencil? Pencils can smear as the pages chafe back and forth in a field bag. After a few times in the field, the information becomes hard to read. A pen can usually be clearly visible for years. After all, one should never erase in a field book. If your field notebook is needed in court, erase marks will be questioned and the book later thrown out as being tampered with. Don’t use whiteout or some other coverup to make your field book look prettier for the same reason. After all, it is a field book. Mistakes will be made, and when they occur, neatly draw a line through the mistake and continue on. Your notebook should not be a disorganized mess, because it will be needed to help you remember what happened later on. Some people have a “working” field book and a second field book that the day’s work is translated into for neatness. It is a good idea to record or add information each evening or during slack time, or details will be missed. You take notes so you don't have to remember everything.
Inside the cover, put your name, address, and phone number, so you can be reached in the event you lose your field book. Some prefer to staple a business card inside the front cover. The back of the field book should have some blank pages, reserved to write the names, addresses, and phone numbers of contacts or distributors of equipment, supplies, or parts frequently needed. Again, business cards can be stapled directly inside these back pages, for ready access. For some people, it is also help-ful to put conversion tables in the field book so that they are accessible for calculations. Your field book is your memory.
Daily information
There is some basic information that should appear in a field book each time one ventures out. The location, purpose, and objective of the day’s work should be noted. For example, soil sampling along Skunk Creek for ACME remediation study. The day’s date and time of departure can be very important. It is a good idea to record the times people arrive and leave a site as a daily itinerary. This could be significant in a law suit if claims are made about who was where, when. It is a good idea to record the people in the party who are present and their phone num-bers and names (including the last names). Saying that Jim or Susan was there may not be very helpful a few years down the road. The basic who?, when?, where?, why?, and how? approach to field notes is a good way to remember what should be recorded.
Comments on the weather and how it changes during the day can also be significant in field interpretation. For example, a rainstorm moving in will change the air pressure. In confined aquifers, this may help explain why the water levels increased or slowed down during a pump-ing test (discussed in Chapter 9). Rainstorms may be the source of why the stage in a stream changed. If the weather is very cold, this may con-tribute to errors committed in the field from stiff fingers, trying to get the job done quickly, or trying to work with gloves on. Conversely, hot weather can also affect the quality of field data collected as perspiration drops often land right where you need to record information. Equipment is also temperature-sensitive, particularly water-quality equipment. This may contribute to data values drifting out of calibration. Of course, this can occur as one bounces down a bumpy road!
It is a good idea to record detailed observations and descriptions during slack time while your mind is still fresh. Field sketches and diagrams are useful. Many field books have grid lines so that well logs can be drawn vertically to scale. If your drawing or sketch is not to scale, say so in the field book. You may have a field book dedicated to a particular project or get a new one each year. It is advisable to organize or record informa-tion in a systematic way. For example, some people like to number the pages sequentially so that a table of contents can be made at the front of the field book. This is helpful if there are a variety of jobs over a broad area. Some of us just prefer to mark the beginning and end of a partic-ular day’s effort by noting page 1 of 4, 2 of 4, etc, for example. Whatever system you use, strive to be consistent, complete, and neat.
Lithologic logs
field book too, then, shame on you, you forgot your memory. It may be, for example, that you are making field descriptions of surface geology during a site characterization (Nielsen and others, 2006) or recording lithologic information from monitoring wells. (How to log a drillhole is discussed in Chapter 8 and a more detailed discussion of geologic infor-mation is presented in Chapter 2.)
Lithologic logs are generally recorded during the drilling process. The type of drilling affects the time that you have to record information (Chapter 8). If you are logging and bagging core, collecting chips, or doing a variety of other tasks, then it can get tricky getting everything done while still recording a meaningful lithologic log.
Example 1.6 I can recall my first attempt at recording lithologic logs for drill holes in overburden on a coal property near Hanna, Wyoming. It was a forward rotary drilling rig, and drillers could drill with air for the first 200 ft or so in relatively soft layered sediments. The mast was almost free-falling at a rate of approximately 20 ft/min. The drillers laughed as I frantically tried to record information. It was bewildering as the various lithologies changed in texture and color before my eyes.
Besides learning to work with your driller, it is helpful to have a shorthand set of descriptions for lithologies and textures (this is dis-cussed further in Chapter 8). Many companies may have their own system, and these can later be incorporated into a software package for visualization. Rock or soil descriptions should be indicated by the pri-mary lithology first, followed by a series of descriptors. Information recorded could include the following:
■ Lithology name.
■ Grain size and degree of sorting (is this the actual crushed bedrock
or soil particles?).
■ Color (can be affected by drilling fluids, such as mud).
■ Mineralogy (HCl fizz test, or mineral grains observed in the cuttings). ■ Probable formation name, etc. For example, an entry might say,
sand-stone: very-fine to fine-grained, tan, with dark cherty rock fragments, the basal Member of the Eagle sandstone.
how samples were taken. For example, were the cuttings washed? (The fines would wash through a sieve, while the chips or coarse fraction would remain behind.) Were they grab samples, split-spoon, or core samples?
Another useful thing to note along with the lithologic log is the drilling rate. There may be a variety of similar rock types, but some may be well cemented and drill slower or faster than others. This may affect the abil-ity for vertical groundwater communication between units, or it may be helpful for a blasting engineer, who needs to know about a very hard sandstone or igneous unit that will require extra blasting agents. Drilling rates can be roughly compared to cone-penetrometer tests. Some drilling may be smooth or “chatterier.” For example, a hard sandstone may cause the drill string to chatter because the bit bounces somewhat as it chews up the formation, but the drilling will proceed slowly. Contrasted to this, a coal bed will “chatter” when it is soft and is chewed up quickly. Notice how long it takes between the first “chatter” sound and the appearance of black inky water from the coal bed at the land surface. Use your senses (odors, for example) to notice changes. Additional comments about log-ging during drilling are made in Chapter 8.
Well drilling
While performing well drilling, you not only need to record the lithologic information, but also the well-completion information. Depending on the
complexity and depth of the well, there may be other key people involved: other geologists, tool pushers, mud loggers, or engineers. Once again, write down the names, addresses, and phone numbers of the driller and these key people, or better yet get their cards and staple them into your book. Hopefully, you have performed some background geologic work and have an idea about what formation you are drilling in and the targeted depth. What is the purpose of the well (monitoring, production, stock well, etc.)? Were there other wells drilled in the area? How deep did they drill for water or product contamination? What were the production zones? What will the conditions likely be (hard, slow drilling, heaving sands, etc.)?
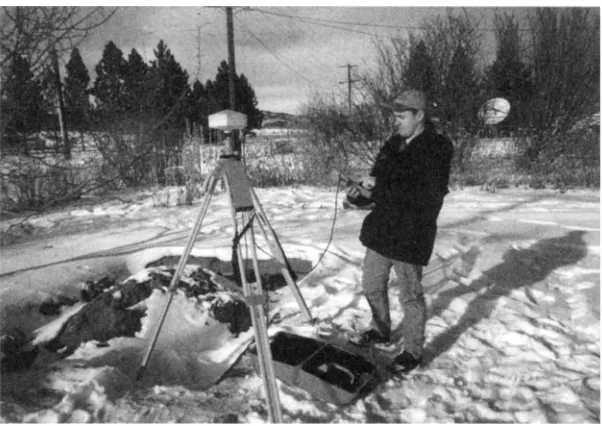
Record a detailed location of the well, using coordinates if possible, township descriptions, or other identifiers, such as latitude and longi-tude from a global positioning system (GPS). It should be noted that GPS systems vary dramatically in accuracy. Hand held units will get you in the ball park, but to accurately locate (within inches or centimeters) a well, it is necessary to have a base station and a rover unit with expen-sive software to correct for the global changes that occur during the day (Figure 1.10) (Chapter 5). Will the elevations be surveyed or estimated from a topographic map?
Write down the make and model of the rig and any drilling fluids that were used and when. Did you start with air or begin drilling with mud? It is a good idea to write down a summary of the work completed
by your driller before you arrive. Quantities of materials billed by a driller should corroborate with your field notes to document errors. Big projects may need to be drilled continuously in shift work format until the job is done.
Example 1.7 In western Wyoming in the early 1980s, some deep (1,200 ft, 370 m) monitoring wells were being placed down structural dip of a mining property. Each well took several days, so drilling and well completion took place in 12-h shifts by the geologists and drillers on a continuous basis until the wells were completed. A new drill crew and geologist would arrive every 12 h. It was critical that communication took place between the ones leaving and the ones arriving for continuity.
It is also important for billing purposes to write down incidents of slack time (standby), equipment breakdowns, or “runs” for water. The work submitted should match the field notes taken or inquiries might be made, Each morning or during slack time, measure and record the static-water levels. This is particularly important first thing in the morning after the rig sat all night. The size and type of bit is also impor-tant for knowing the hole diameter. Any unusual or problematic situa-tions or condisitua-tions should be recorded and discussed with your driller.
Well completion
Once the hole is drilled, the well is completed from the bottom up. Your field book needs to contain sufficient information to construct well com-pletion diagrams back at the office or in the motel room at night. It is helpful to review the information on forms required by the local gov-ernment, so that all details are covered. For example, was surface casing used? If so, what was the diameter? What about screen type or slot size? What are the diameters of the borehole and pump liner? The mechanics of well completion is discussed in Chapter 8; however, the fol-lowing items should probably be included in your field book:
■ Total depth drilled (TDD) and hole diameter (important for well
hydraulics calculations) (Chapters 10 and 11).
■ Indication of type and length of bottom cap (or was it left open hole?). ■ Is there a sump or tailpipe (a blank section of casing above the bottom
cap)?
■ Interval of screened or perforated section, slot size and type or size of
perforations, outer diameter (OD) and inner diameter (ID) of screen, and material type (schedule 80 PVC)? Is the screen telescoped with a packer, threaded, or welded on?
■ Number of sections of casing above the screen, length of each
![Figure 1.3Sand Creek drainage basin southwestern Montana and field area detail.[Adapted from Borduin (1999).]](https://thumb-ap.123doks.com/thumbv2/123dok/2433987.1645593/24.398.37.361.66.430/figure-sand-creek-drainage-southwestern-montana-adapted-borduin.webp)
![Figure 1.4Silver Bow Creek drainage. [Adapted from Burgher (1992).]](https://thumb-ap.123doks.com/thumbv2/123dok/2433987.1645593/25.398.38.339.334.598/figure-silver-bow-creek-drainage-adapted-burgher.webp)