Variability of chlorophyll
a
and photosynthetic parameters in a nutrient-saturated
tropical great lake
G. M. Silsbe, R. E. Hecky, and S. J. Guildford
Department of Biology, University of Waterloo, Waterloo, Ontario N2L 5C7, Canada
R. Mugidde
Fisheries Resources Research Institute, P.O. Box 343, Jinja, Uganda
Abstract
Diurnal measurements of Secchi depth, light attenuation, thermal structure, photosynthetic irradiance (PE) parameters, and chlorophylla(Chla) were performed at weekly intervals in three inshore bays in Lake Victoria, Uganda. The only statistically significant diurnal patterns observed were a decline in PE parameters normalized to Chlaand a decline in gross integral phytoplankton production. On a weekly timescale, Chla was positively correlated to changes in the mean water-column temperature (TWC) in each bay. Meteorologic data in one of these bays suggest that the synchronous increases and decreases in Chlaand TWCare related to the extent of advective exchange with deeper areas of the lake. Analysis of all data from this study, as well as available historic data, reveals that the optical properties of Lake Victoria covary with the concentration of Chla. On weekly timescales, the PE parametersaB and PBM covary, and both parameters generally decline as Chl aincreases, a pattern consistent with historic data from Lake Victoria. Empirical relations are developed that relate optical properties and PE parameters to Chla. These relations provide a mathematical representation of the limnologic changes that Lake Victoria has experienced through eutrophication and can be used to predict these parameters over larger spatial and temporal scales and facilitate estimates of whole-lake primary production.
Lake Victoria is the second largest freshwater lake by surface area and supports the largest freshwater commer-cial fishery in the world (Simonit and Perrings 2005). In the latter half of the twentieth century, increases in subsistence agricultural, deforestation, municipal and industrial efflu-ents, and human encroachment on the shoreline that led to wetland degradation collectively gave rise to historically unprecedented nutrient loadings into the lake (Hecky 1993; Vershuren et al. 2002). The eutrophication of Lake Victoria caused a fourfold and eightfold increase in chlorophyll
a(Chla) in the offshore and inshore, respectively (Mugidde 1993), and a disproportionate increase in phosphorus loading relative to nonbiologically fixed nitrogen and soluble reactive silica loadings caused a taxonomic shift from green algae and siliceous diatoms to nitrogen-fixing cyanobacteria (Hecky 1993; Kling et al. 2001). The increase
in algal biomass has further altered the physical, chemical, and biological environment of Lake Victoria. Secchi depth measurements declined in the offshore from a range of 5.5 to 8.2 m in the 1920s (Worthington 1930) to a mean value of 2.0 m in the early 1990s (Mugidde 1993), with an associated narrowing of the light-transmission spectra that has devastated the diversity of the endemic cichlid fauna that rely upon visual coloration for sexual selection (Seehausen et al. 1997). Furthermore, increased stability of stratification, together with higher organic sedimenta-tion to the hypolimnion, has significantly augmented the volume of seasonally anoxic water (Hecky et al. 1994) and caused loss of fish habitat and a shift in the benthic invertebrate community toward anoxia-tolerant species (Verschuren et al. 2002). In addition to these ecologic stressors, the introduction of the Nile perch in the 1950s eventually resulted, by the 1980s, in the establishment of the large commercial fishery for perch and the further restructuring of the lake’s food web (Kitchell et al. 1997). Lake Victoria’s fishery is currently considered over-exploited (Simonit and Perrings 2005). By 1995, a 48%
decline in commercial harvesting of fish had occurred from its peak in 1990. A fourfold increase in fishing boats has occurred during the past decade, and fish-processing plants continue to be built (Simonit and Perrings 2005).
The high mean concentrations and large range of Chl
a and macronutrients observed in modern-day Lake Victoria are unprecedented among the world’s large lakes (Hecky 1993; Guildford and Hecky 2000). Mugidde (1993, 2001) concluded that phytoplankton populations in Lake Victoria were usually self-shaded by high-chlorophyll standing crops, with the highest crops in the shallowest portions of the lake. Here, we investigate temporal and
Acknowledgments
We are thankful to the Fisheries Research and Resources Institute and the National Water and Sewerage Corporation in Uganda for access to laboratory facilities and field transportation. William Okello, Godfrey Magezi, Simon Kikonyogo, Kennedy Ara, and Jill Aitken provided valuable assistance in the field and laboratory.
Financial support was provided by a National Science and Engineering Research Council grant awarded to R.E.H. and a Canadian International Development Agency Innovation grant awarded to G.M.S. The Lake Victoria Environmental Manage-ment Program also provided financial support through some collaborative fieldwork. NSF grant DEB931808 supported data acquisition for the Lake Victoria Ecosystem Project.
Comments from two anonymous reviewers and Marcel Babin significantly improved this manuscript.
1Corresponding author ([email protected]).
spatial trends of Chlaon weekly and diurnal timescales in three inshore bays in Lake Victoria and examine relations between Chl a and the vertical attenuation of photosyn-thetically active radiation (kPAR), Secchi depth, and photosynthetic-irradiance (PE) parameters. Seasonal pat-terns of Chl a in Lake Victoria’s offshore have been well defined (Hecky 1993; Mugidde 2001). However, within the inshore, only diurnal patterns of Secchi depth (Wanink and Kashindye 1998), thermal structure (MacIntyre et al. 2002), and nutrients and gases (Ramlal et al. 2001) have been directly addressed to date. PE parameters, kPAR, and Chl
a permit computation of phytoplankton production (Fee 1990). Therefore, analysis of how kPARand PE parameters vary with Chlaprovides a framework that can be used with remotely sensed Chladata, given a validated algorithm, to obtain highly resolved phytoplankton production estimates for the whole lake. This analysis is particularly important, as financial logistics severely inhibit the frequency of spatial and temporal data collection in Lake Victoria because of its immense surface area, and an accurate estimate of whole-lake phytoplankton production could be used to estimate the maximum sustainable yield of Lake Victoria’s fishery by use of existing empirical models (e.g., Melack 1976; Pauly and Christiansen 1995). Finally, the derivation of Chl a2specific empirical relations can further extend the interpretation of both historic and current data sets, as often only one or two of these critical parameters have been measured (e.g., Secchi depth in Worthington [1930], Chl
a and kPAR in Talling [1965], and Chl a in Hecky [1993]) to understand how changing environmental conditions in Lake Victoria have affected the primary productivity of this great lake and its fishery.
Materials and methods
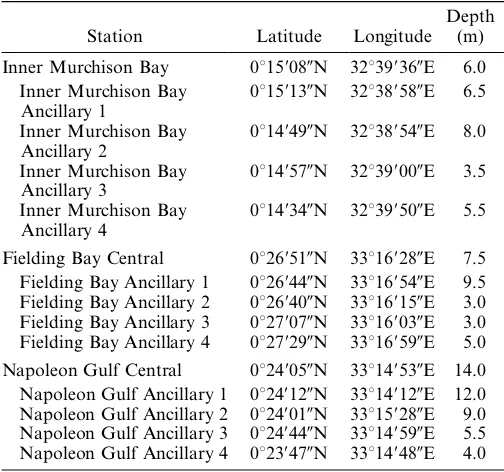
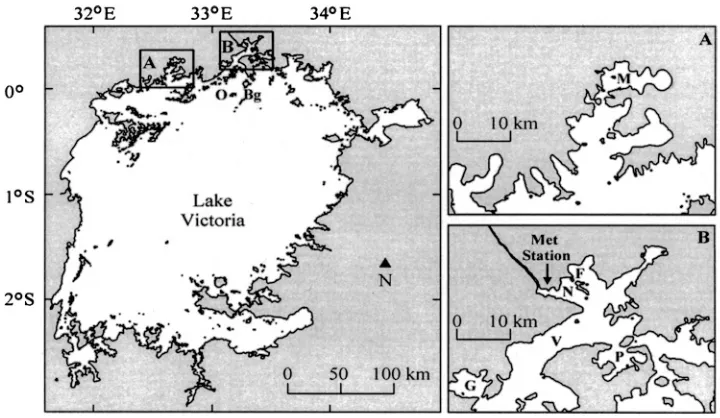
This study was undertaken in three inshore bays, all located in northern Lake Victoria; Napoleon Gulf and Inner Murchison Bay were sampled in 2001, and Fielding Bay was sampled in 2002. In each bay, one centrally located station was selected to perform the routine measurements described below, and supplemental CTD profiles, Secchi depth, and light-attenuation profiles were carried out at four ancillary stations in each bay. Table 1 provides the location and bottom depth of all stations, and Fig. 1 depicts the central station in each bay, as well as historic stations referenced in this study. The proximity of Napoleon Gulf and Fielding Bay to the Fisheries Research and Resources Institute (FIRRI) in Jinja and the proximity of Inner Murchison Bay to the National Water and Sewerage Corporation (NWSC) in Kampala allowed samples to be immediately transported to the respective research institute for preservation or analysis, with the exception of measurements of phytoplankton photosynthe-sis in Inner Murchison Bay, which were transported (,2 hours) to FIRRI for incubation. Napoleon Gulf is
not a typical embayment, as it experiences consistently high flow of the Nile River, the lake’s outlet that exits from the gulf. To assess diurnal variability, measurements of Chla, kPAR, Secchi depth, and CTD profiles were repeated at three different times each day in each bay (approximately
09:00 h, 13:00 h, and 18:00 h), with the exception of days 205, 242, and 323 of the year in Inner Murchison Bay, Napoleon Gulf, and Fielding Bay, respectively, when repeated measurements were not possible. Diurnal mea-surements of PE parameters were only conducted in Fielding Bay.
Secchi depth was measured with a white, 25-cm diameter Secchi disk as the average depth at which the disk was no longer visible upon lowering and raising it in the water column on the shaded side of the boat. A flat-collector LI-COR quantum sensor (LI-LI-COR Biosciences) was used to determine underwater irradiance in the photosynthetically active spectral range (l400 to 700 nm). Measurements were taken above and below the air2water interface and every 0.5 m thereafter to a depth of approximately 0.1%surface
irradiance. Because of instrument noise above and below the air2water interface, only deeper measurements were used to determine kPAR. The euphotic depth (Zeu) was taken as the depth in the water column at which 0.5%of
surface irradiance occurs.
Two separate water samples for Chlaand PE parameter analyses were collected from the surface and at the base of Zeu, as estimated in the field as 3.5 times the Secchi depth to the nearest half meter. This value may be a slight un-derestimation of Zeu, as data presented in this paper suggest that Zeu is four times the Secchi depth. Water from each depth was collected by use of a 4-L Niskin sampler and siphoned into separate 3-L, acid-washed carboys that were filled to overflowing by use of a long tube to minimize aeration. Carboys were transported in the dark to the laboratory, where they were gently shaken to ensure a homogenous sample before allocation of water for each analysis. For Chla analysis, duplicate samples of 200 mL of water were passed through Whatman glass-fiber filters that were then extracted in 20 mL of 95%methanol at 4uC
Table 1. Location and bottom depth of central and ancillary
for 24 hours. The extract was placed in a Jenway spectro-photometer (Barloworld), and absorbance was measured at wavelengths of 665 and 750 nm. Chla concentration was calculated by application of the method of Talling and Driver (1963). The average relative difference of all duplicate Chl a samples was 4.6% (n 5 106), or 1.4 mg
m23for a Chlavalue of 30 mg m23. The extracted sample was then acidified with 1 mol L21 HCl and reread at the same wavelengths to determine the contribution of pheopigments, but the percentage decline in absorbance in every sample was never below the criteria specified by Lorenzen (1967), so no correction for pheopigment contribution was applied.
PE parameters were determined by use of the light-and-dark oxygen method for both surface and Zeu water samples. For each sample depth, water from the corre-sponding carboy was gently delivered into a series of biological oxygen demand (BOD) bottles by placing a tube at the bottom of each bottle and flushing it with approximately three times the bottle volume of the corresponding water sample. For each water sample, 10 BOD bottles were placed in a light-gradient incubator for 2 to 3 hours, 2 BOD bottles were immediately fixed to provide initial dissolved-oxygen concentrations, and 2 BOD bottles were kept in the dark for the length of the incubation to provide an estimate of community respira-tion. For the oxygen titration, Winkler reagents were prepared according to the technique of Stainton et al. (1977), and a HACH digital titrator (HACH Company [accuracy 5 0.00125 mL]) was used to dispense sodium thiosulphate. The average relative percentage difference of all duplicate bottles was 1.12% (n 5 144).
Photosynthet-ically active radiation (PAR) in the incubator was de-termined in each bottle position by use of an LI-COR 4p
quantum sensor, and the volumes of the BOD bottles were
routinely determined as the difference between dry and wet weight after filling with deionized water. Gross photosyn-thesis (light less dark bottle-oxygen concentrations) versus PAR was statistically fitted to a rectangular hyperbola curve (Jassby and Platt 1976) by application of the computer program PSPARMS (Fee 1990). Briefly, the PE curve has three physiologically meaningful parameters, PM is the maximum rate of photosynthesis at saturating light,
ais the slope of the PE curve where photosynthesis is light limited, and EK (EK 5 PM/a) is the light-saturation parameter of a PE curve (Talling 1957). To facilitate comparison of each variable across a Chl a gradient, PE parameters are normalized to Chl a, as indicated by the subscript B.
Mean euphotic-zone estimates of PE parameters and Chl
a (ChlZeu) presented in this paper are the average of samples taken from the surface and at the base of the euphotic zone. On average and relative to measurements from the base of the euphotic zone, surface Chla was 8%
higher (coefficient of variation [c.v.] 17%), surface PBMwas
12% lower (c.v. 17%), and surface aB was 9% lower (c.v. 22%).
A SBE-19 CTD profiler (Sea-Bird Electronics Inc.) equipped with a WetSTAR fluorometer (WetLABS) collected vertical profiles at each station throughout the day. The conductivity, temperature, and pressure (depth) sensors on the CTD were not altered from the factory calibration, as each sensor is very precise and extremely stable. The CTD sampled at a 2-Hz interval and was lowered at an approximate descent rate of 0.2 m s21, which allowed for measurements of temperature, conductivity, and Chlafluorescence every 0.1 m to the maximum depth of the station. These profiles allow the calculation of average water-column temperature (TWC), and the stability of the water column is calculated as the buoyancy Fig. 1. Map of Lake Victoria shows the sampling location of A, Inner Murchison Bay (M),
frequency, N5(2g/r?dr/dz)1/2, wheregis gravity andris density. Only data from early morning profiles (before 09:00 h) are reported, to minimize the influence of the significant diurnal heating that occurred in these inshore bays, as we are interested in persistent and not diurnal structure.
The WetSTAR fluorometer measures in vivo Chl
a fluorescence (ChlF [range 0.062150 ChlF mg m23, sensitivity $ 0.03 mg m23]) and is often used to estimate extractable Chla (Lorenzen 1966). However, fluorescence per unit Chla, or fluorescence yield, varies with taxonomic composition (i.e., pigmentation) and physiologic status of the phytoplankton community (Falkowski and Raven 1997). For each profile, extracted Chl a taken from the base of the euphotic zone was compared with the ChlF at the same depth to derive a calibration factor (Chla: ChlF). This calibration factor was then applied to all other ChlF measurements in the profile only below the euphotic zone to derive estimates of extractable Chl a at these depths. Combined with the estimate of mean ChlZeu, derived Chl
a measurements beneath the euphotic zone provide an estimate of mean water-column Chl a (ChlWC) for each profile. This procedure to estimate Chl a from ChlF assumes that, in any given profile, fluorescence yield (Chl
a: ChlF) beneath the euphotic zone is static with respect to taxonomic composition and physiologic status. To support this assumption, the calibration factor (Chl a: ChlF) has a notably lower average c.v. for diurnal measurements (c.v. 5 5%) than on weekly scales (c.v. 5 42%), which implies
changes in taxonomic composition and physiologic status are small in a given day and, hence, through depth because of frequent mixing to maximum depth in inshore embay-ments (MacIntyre et al. 2002) relative to longer timescales. Diel-averaged data in the results section were computed by linear interpolation and static extrapolation between and beyond data points, respectively, following the logic of Fee (1990). Gross integral phytoplankton production (GPP) was calculated by application of an adapted version of Fee’s (1990) phytoplankton-production model (http:// biology.uwaterloo.ca/research/uwaeg/web/index.htm) that allows the input parameters (Chl a, kPAR, and PE parameters) to vary diurnally. To assess how the diurnal variation of the input parameters affect GPP, the model runs that used data only from the morning, noon, or late afternoon, respectively, were compared with model runs in which all parameters were allowed to vary diurnally.
Meteorologic data for the calendar year of 2002 was provided courtesy of the Directorate of Water Development (Uganda) from a meteorologic station (Campbell Scientific) whose location is shown in Fig. 1. At this location, wind speed, wind direction, and air temperature were measured at an approximate height of 3 m above lake level at the Jinja Pier aboard a stationary vessel. Meteorologic data are applied to interpretation of limnologic measurements from Fielding Bay, approximately 6 km east.
Results
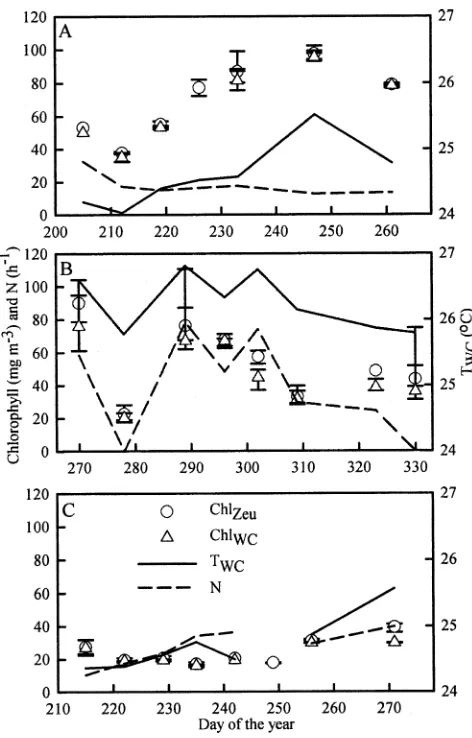
Figure 2 depicts the temporal variation of ChlZeu and ChlWC, with points that correspond to daily averages and
a synchronous decrease and increase in TWC was also observed. A strong linear correlation was found between TWCand ChlWCin Fielding Bay (r250.57,p50.03,n58) and Inner Murchison Bay (r250.87,p50.006,n56) but not in Napoleon Gulf (r25 0.18,p5 0.34,n 57), and N was correlated to ChlWC in Fielding Bay (r2 5 0.59, p 5 0.02,n 58) but not in the other two bays (p. 0.5).
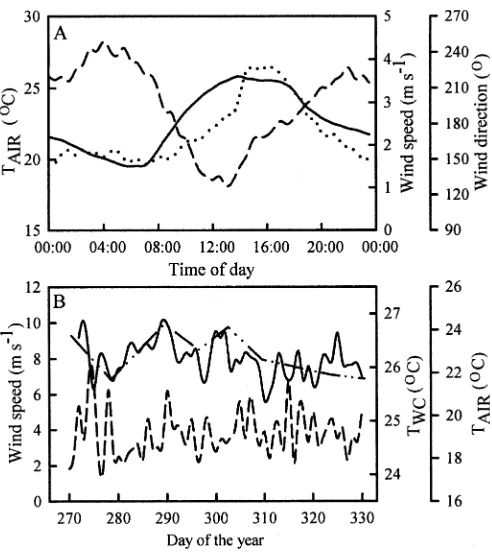
Data from a nearby meteorologic station, whose location is shown in Fig. 1, were available during 2002 to investigate potential links between meteorologic parame-ters with changes in TWCand ChlWCin Fielding Bay. Time-specific averaged meteorologic data during the 2002 period of observation (days 270 to 330 of the year) demonstrates a diel pattern, shown in Fig. 3A, with maximal air temperature and strong southerly winds that occur around 16:00 h, consistent with an afternoon lake breeze common-ly observed around the Lake Victoria basin (Asnani 1993). The prominent mechanisms in Lake Victoria’s inshore that induce increases and decreases in TWC are solar radiation and latent heat transfer, respectively, where the largest losses of heat correspond with strong nocturnal wind events (MacIntyre et al. 2002). Although solar radiation was not measured at the meteorologic station, the mean air temperature over the 24 hours before each measurement of TWC was positively correlated to weekly measure-ments of TWC (r2 5 0.84, p . 0.01, n 5 8) and ChlWC (r2 5 0.69, p 5 0.01, n 5 8) in Fielding Bay. The diel meteorologic pattern shown in Fig. 3A does not show a consistent nocturnal land breeze, also commonly ob-served around the Lake Victoria basin (Asnani 1993). However, as shown in Fig. 3B, the maximum nocturnal (19:00 h–06:00 h) wind speed as averaged in a 1-hour time window exceeded 6 m s21 on 5 separate days during the 2002 period of observation. Overall, the magnitude of the maximum nocturnal 1-hour wind event before each early morning profile was negatively correlated to both TWC (r250.57,p50.03,n58) and Chl
WC(r250.65,p50.02,
n58).
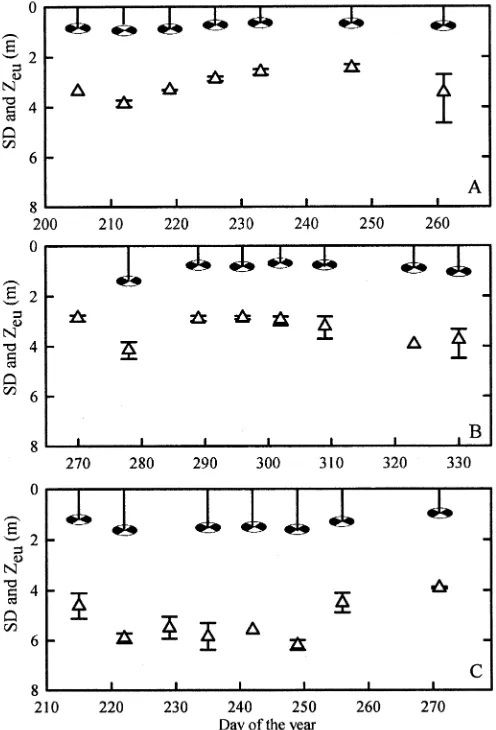
Figure 4 shows the temporal variation of average Zeu and Secchi depth in each of the three bays, with points that
correspond to daily averages and error bars that encompass the diurnal range. As summarized in Table 2, with the exception of kPARin Napoleon Gulf, weekly variability of Secchi depth and Zeuwere approximately two times greater than both diurnal variability and within-bay spatial variability of both parameters in each of the three study areas. On average, both Zeu and Secchi depth were
Table 2. Coefficient of variances (%) of limnologic parameters on different temporal scales in three inshore areas. Mean values of each parameter at each study site over the entire study period are given in parentheses (n.m.5not measured).
ChlZeu(mg m23) kPAR(m21) Secchi depth (m)
PBM(mg O2mg Chl21h21)
aB(mg O2mg Chl21mol21m2) Inner Murchison Bay
Weekly 35.0 (69.5) 21.3 (1.74) 18.6 (0.76) 30.5 (12.1) 43.5 (16.9)
Diurnal 13.5 11.3 10.1 n.m. n.m.
Spatial n.m. 10.9 9.6 n.m. n.m.
Fielding Bay
Weekly 42.0 (54.9) 16.4 (1.63) 26.1 (0.85) 27.9 (14.7) 50.3 (22.7)
Diurnal 13.5 8.1 12.1 9.0 10.6
Spatial n.m. 9.3 11.9 n.m. n.m.
Napoleon Gulf
Weekly 26.0 (24.2) 15.7 (1.03) 18.4 (1.42) 12.1 (20.4) 24.6 (34.5)
Diurnal 9.6 9.3 10.1 n.m. n.m.
Spatial n.m. 13.1 9.7 n.m. n.m.
shallowest in Inner Murchison Bay, followed by Fielding Bay, and deepest in Napoleon Gulf. In each bay, Secchi depth and Zeuexhibited similar temporal patterns, as kPAR is linearly correlated to the inverse Secchi depth (Secchi depth2150.793k
PAR– 0.06,r250.90,p,0.0001,n5 112). Both kPAR and Secchi depth21 were strongly correlated with ChlZeu, as seen in Fig. 5A and 5B, respectively, and both curves became increasingly asymp-totic as ChlZeu increased. Because of the covariance between optical properties with Chla, temporal and spatial patterns of Zeuand Secchi depth are similar to the patterns exhibited by Chl a in each bay. Unpublished data (R.E. Hecky, Lake Victoria Ecosystem Project) supplements each relation with more spatially extensive data from several offshore stations that have deeper Zeu and Secchi depth relative to inshore sites presented here. The historic data of Talling (1965) are also presented in Fig. 5A to assess the historic validity of the kPAR versus ChlZeu empirical relation. Talling’s (1965) attenuation coefficients are
wavelength specific (kl) and were converted to an estimated kPARby application of a series of curves presented in Jerlov (1976) that relate klto kPAR. The empirical curve presented in Fig. 5A was generated by application of kPARand ChlZeu from both modern data and Talling’s historic data sets. An empirical curve derived by use of only modern data provided an excellent fit to Talling’s transformed attenu-ation data (r250.91,p,0.001,n515), with a regression equation that was not statistically different from the regression equation in Fig. 5A that includes Talling’s data (p, 0.05).
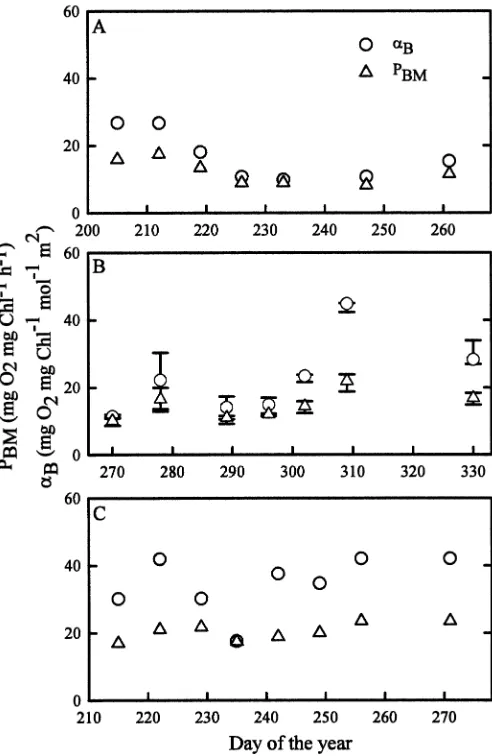
Figure 6 depicts the temporal variation of PE parame-ters in each of the three bays, with points that correspond to daily averages and error bars that encompass the diurnal range for the Fielding Bay data set. As summarized in Table 2, weekly variability of aB and PBM were approxi-mately 4.7 and 3.1 times greater than diurnal variability, respectively, as measured in Fielding Bay. In each bay,aB and PBM exhibited similar temporal patterns, as aB was significantly correlated to PBM, as shown in Fig. 7A, despite a 5.5-fold and 3.5-fold range in each parameter, respectively. In contrast to Chla, on average both PBMand
aB were lowest in Inner Murchison Bay, followed by Fielding Bay, and highest in Napoleon Gulf. Accordingly,
aB and PBMshowed significant correlation to Chl a when fitted with equations shown in Fig. 7B and 7C, respectively; in each bay, when Chlawas high PE parameters were low, and when Chlawas low PE parameters were high. Historic PBM and Chl a data from Lake Victoria were used to Fig. 4. Temporal variation of Zeu(open triangles) and Secchi
depth (hatched circles) in (A) Inner Murchison Bay, (B) Fielding Bay, and (C) Napoleon Gulf. For Zeu, symbols correspond to daily averages, and error bars represent the range of data on that day. Fielding Bay measurements are from 2002. Other bays were measured in 2001.
validate this relation, as seen in Fig. 7D (Talling 1965; Mugidde 1992). Although increased unexplained variance is present in the historic data sets, at-test of the linearly transformed regression equations of historic and current data sets were not statistically different (p ,0.05).
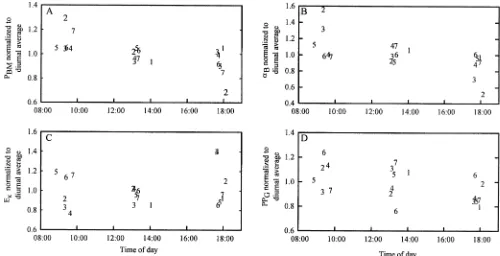
Diurnal variations in PE parameters from samples collected at Zeu, as well as the diurnally computed GPP, as measured in Fielding Bay, are shown in Fig. 8. Each parameter in Fig. 8 is normalized to its computed daily average, where labels represent day of the year. PE parameters from Zeu, as well as surface samples (not shown), generally decline through the day, where a two-tailed t-test confirms that the differences between the morning and late afternoon population means of each parameter at each depth are statistically significant (p , 0.05). On average, PBMdecreased by 11%and 18%andaB decreased by 16% and 28% between the morning and late
afternoon at the surface and Zeu, respectively. EKgenerally increases through the day, and the largest average increases of 13%for both surface and Zeuoccur between midday and
late afternoon. However, this pattern is not consistent for each individual day, and two-tailed t-tests show that the differences between the morning, midday, and late after-noon population means are not statistically significant (p. 0.05). GPP also generally decreases throughout the day, and the average difference between the morning and late afternoon population means of 16% is statistically signif-icant (p , 0.05), as calculated by a two-tailed t-test. In contrast, ChlWC, ChlZeu, Secchi depth, and kPAR (not shown) do not exhibit a statistically significant diurnal pattern; on some days these parameters increased through-out the day and on others they decreased.
Discussion
Optical properties covary with Chl a in Lake Victoria—
The strong covariance between kPAR and Secchi depth21 with ChlZeudepicted in Fig. 5A,B suggests that the optical properties of Lake Victoria may be considered as ‘‘Case I waters’’ (Morel 1988). However, upon comparison of the empirical relation that describes covariance of kPAR with ChlZeu in Lake Victoria with the same relation within oceanic Case 1 waters (kPAR5 0.12 ChlZeu0.43[see eq. 5 in Morel 1988]), the vertical attenuation of irradiance is seen to be approximately twofold higher in Lake Victoria over the range of ChlZeu presented in this manuscript, which suggests the presence of additional strong light absorbers in the euphotic zone beyond phytoplankton. Resuspension of optically active, nonliving material through vertical mixing and colored dissolved organics is probable, given the fine unconsolidated organic sediment present at each study site (Silsbe pers. obs.), although the potential contribution of these materials to kPAR has yet to be quantified in Lake Victoria. The asymptotic nature of the ChlZeuversus kPAR and Secchi-depth curves, termed the ‘‘nonlinear biological effect’’ (Smith and Baker 1978), has been attributed to a decrease in the Chla2specific absorption spectra (a*) of algal cells along an increasing Chl a gradient through cellular changes in the package effect and quantity of accessory pigments (Bricaud et al. 1995). The inclusion of the spatially extensive data set of the Lake Victoria Ecosystem Project, as well as the data of Talling (1965), to Fig. 5A demonstrates the validity of the empirical ChlZeu versus kPAR relation spatially and temporally in modern-day Lake Victoria and historically through the eutrophi-cation of Lake Victoria.
Strong correlations of Chlaand optical properties allow predictions of one variable from the other. For example, Worthington’s (1930) mean offshore Secchi depth of 7.46 m (n 5 8), measured in the 1920s, is among the earliest limnologic data recorded for Lake Victoria. From the regression equation of Fig. 5B, a corresponding ChlZeu concentration of 2.65 mg m23is estimated for Worthing-ton’s (1930) data set. This 1920s estimate of ChlZeuis only slightly less than Talling’s (1965) mean offshore ChlZeu concentration of 3.27 mg m23(n513) and well below the offshore ChlZeu concentration of 24.5 mg m23 (n 5 15) reported by Mugidde (1993). Although comparison of these three historic data sets provides insights into the timing of the eutrophication of Lake Victoria, deep vertical mixing Fig. 6. Temporal variation of aB and PBM in (A) Inner
Fig. 7. Regression of (A)aBversus PBMand Chlzeuversus (B)aBand (C) PBMfrom this study (M5Inner Murchison Bay, F5 Fielding Bay, N5Napoleon Gulf ) and (D) historic PBMfrom Talling (1965) (O5offshore, G5Grant Bay, K5Kavirondo Gulf ) and Mugidde (1992) (N5Napoleon Gulf, P5Pilkington Bay, V5Buvumu Channel). Solid lines are the regression curves, and dashed lines are the 95%prediction intervals of the regression curves.
can still maintain low Chla concentrations, as two of the modern-day offshore measurements of Chl a (Fig. 5B) acquired through the Lake Victoria Ecosystem Project taken during isothermal conditions are below the 1920s estimate.
PE parameters are dependent on Chl a in Lake Victoria—
PBMandaBcovary, and both parameters generally decline as Chl a increases, as shown in Fig. 7. Covariance of PE parameters is commonly observed (Behrenfeld et al. 2004), but this observation is the first explicit instance in which both PBMandaBare both shown to decrease with increased Chl a. A recent examination of physiologic mechanisms that cause PE parameter covariance (Behrenfeld et al. 2004) provides insight as to why PBM and aB decrease with increased Chla in Lake Victoria. Behrenfeld et al. (2004) identify the ratio of photosystem II : photosystem I (PSII : PSI) as the sole photochemical parameter that links PBMandaB, but they also propose that growth-dependent changes in reductant demand downstream of the photo-synthetic pathways may drive a large degree of PE parameter covariance. As PSII is the site of oxygen evolution, and assuming the quantity of Chl a associated with both PSII and PSI is approximately equivalent, a decrease in PSII : PSI, therefore, decreases photosynthetic rates per unit Chlain the sample volume (Falkowski et al. 1981). With respect to growth-dependent changes in reductant demand, Behrenfeld et al. (2004) propose that as nutrient stress increases, photosynthetic reductants become increasingly used for ATP generation through a metabolic pathway that consumes photosynthetically produced O2 and, thereby, also decreases photosynthetic rates per unit Chla. In modern-day Lake Victoria, diatoms represent a significant portion of phytoplankton biomass when Chl a is low and are increasingly displaced by nitrogen-fixing cyanobacteria as Chla increases (Kling et al. 2001; Mugidde 2001), similar to the historic shift observed through the eutrophication of the lake (Hecky 1993). This transition in community composition is consistent with both arguments brought forth by Behren-feld et al. (2004) in their explanation of the observed decrease in PE parameters with increased Chl a. With respect to the PSII : PSI ratio, it is up to four times higher in diatoms than in cyanobacteria (Berges et al. 1996), such that the shift in community composition toward cyano-bacteria with increased Chlawill cause a general decrease in the PSII : PSI ratio of the phytoplankton community. With respect to the growth rate2dependent demand for photosynthetic reductants, cyanobacteria have lower growth rates than do diatoms (Kilham and Hecky 1988) and require a high supply of adenosine triphosphate (ATP) to support energetically expensive nitrogen-fixation that becomes an increasingly important nitrogen source as Chl
aincreases (Mugidde 2001).
Behrenfeld et al. (2004) provide a theoretical validation of the trends observed between PE parameters and Chla, and the statistical similarity to the more spatially extensive PBM and Chl a data of Mugidde (1992) and the historic data of Talling (1965) provide empirical validation. Similar to the relation between Lake Victoria’s optical properties
and Chl a, the regression equations of Fig. 7 provide a means to estimate PE parameters from Chl a. Such an estimate is of particular importance in Lake Victoria, as equipment and the immense surface area of the lake limits the quantity of PE parameter data collection. Figure 7 also provides an empirical model that describes the change in phytoplankton photosynthetic rates during historic eutro-phication, where declining photosynthetic rates per unit Chlawith increased Chl ademonstrates that phytoplank-ton production has not increased to the same degree as algal Chla biomass.
Chl a biomass is physically determined in Lake Victoria—
Inner Murchison Bay and Napoleon Gulf were both sampled within the same time period of 2001, and differences between bays are apparent. As summarized in Table 2, on average, the shallower Inner Murchison Bay had euphotic depths 1.7 times less and ChlZeu concentra-tions nearly threefold greater relative to the deeper Napoleon Gulf. The average ChlZeu of 24.2 mg m23 in Napoleon Gulf presented in Table 2 is slightly lower than the average ChlZeuof 32.3 mg m23presented by Mugidde (1992) for the same station from similar dates (n 5 5), which provides some evidence that the ongoing eutrophi-cation of Lake Victoria no longer effects algal Chl
a biomass. In a series of grazing experiments performed on both inshore and offshore waters, Lehman and Branstrator (1993) determined that zooplankton grazing has a negligible effect on Chlaand emphasized the role of vertical mixing in the determination of modern-day Chl
aconcentrations. Seasonal changes in thermal stability and mixing depth (Hecky 1993) drive changes in Chlain Lake Victoria’s offshore (Mugidde 1992; Kling et al. 2001), as phytoplankton production is light limited and deeper mixing reduces light available for growth (Mugidde 1993). Unlike the offshore, where the maximum potential surface mixed-layer depth of phytoplankton is set by a seasonally transient thermocline (25–65 m [Hecky 1993]), the increased frequency of complete water-column mixing in the inshore emphasizes the importance of a bay’s morphometry in defining a finite limit on the surface mixed-layer depth. Provided that nutrients remain in excess or available from nitrogen-fixation into the shallowest depths of the lake (Hecky 1993; Ramlal et al. 2001; Mugidde et al. 2003), the morphometry of inshore areas influence the severity of light limitation that, in turn, affects the quantity of phytoplankton biomass possible before self-shading limits future growth. This hypothesis is not only supported by the differences between Inner Murchison Bay and Napoleon Gulf but also supported by a significant negative correlation (r25 0.87,p5 0.044,n54) between station depth with overall averages of ChlZeu in all three embayments in this study plus the inshore study site of Mugidde (1992 [15 samples from Pilkington Bay with a station depth of 7 m]).
and TWCon weekly timescales in each bay, as well as N and ChlWC in Fielding Bay, suggests hydrodynamic motions influence temporal variance of phytoplankton biomass. Similar to morphometry, N also influences the vertical mixing of phytoplankton (MacIntyre 1993). However, considering the importance of station depth in influencing phytoplankton biomass and the large diel fluctuations that N undergoes (MacIntyre et al. 2002), the correlation between ChlWC and N in Fielding Bay may be an artifact of an alternate hydrodynamic process. Meteorologic data showed that TWCand ChlWCin Fielding Bay was positively correlated with the maximum nocturnal wind speed. Strong overnight winds blew from the north to the south, consistent with observed nocturnal land winds over Lake Victoria (Asnani 1993). A strong northerly nocturnal wind stress over Fielding Bay would not only deepen the surface mixed layer and thereby decrease N but also, perhaps more importantly, cause water from Fielding Bay to laterally advect south to deeper areas of the lake (i.e., Buvumu Channel in Fig. 1), while causing a return flow at depth (Monismith et al. 1990). Although lateral advection routinely occurs in the inshore, strong nocturnal wind events increase the spatial range of advective exchange to deeper areas of the lake. As deeper areas of Lake Victoria are generally cooler (Silsbe 2004) and, as already shown, are expected to have lower Chl a, hydrologic flushing of Fielding Bay would decrease both TWC and Chl a. This proposed hydrodynamic process is best supported in Fielding Bay between days 270 and 278 of the year, when TWC decreased by 1uC and both ChlZeu and ChlWC exhibited fourfold decreases after a 3-hour nocturnal wind event with an average northerly wind speed over 4 m s21. Moreover, in the absence of strong nocturnal wind events between days 278 and 289, both water-column temperature and Chl a increased by 1uC and 3.5-fold, respectively, which suggests a decreased exchange with water from deeper areas. Advective exchange between shallow Nyanza Gulf with deeper areas of Lake Victoria has been shown to affect both phytoplankton and nutrient concentrations in the Kenyan side of Lake Victoria (Gikuma-Njuru and Hecky 2005).
Diurnal variability of PE parameters is not dependant on Chl a in Lake Victoria—Weekly variance of PE parameters, Chl a, and optical properties in Lake Victoria’s inshore bays exceeds diurnal variance. The only statistically significant diurnal patterns observed were the decline in PE parameters normalized to Chla and GPP through the photoperiod. The light-saturation parameter Ek increases diurnally on most days, indicative of phytoplankton photoacclimation to high irradiances over the day (Senger and Fleischhacker 1978), but this pattern is not statistically significant within our limited sample size. The decline of PE parameters in Fielding Bay through the day is consistent with several studies that examined diel or diurnal period-icity of PE parameters and showed that PBM is generally highest in the morning or at midday (Behrenfeld et al. 2004), as well as observed circadian rhythms of growth and cell division in cyanobacteria (Mori et al. 1996). Similar to the overall decline in PE parameters across a Chlagradient
shown in Fig. 7, the diurnal decreases in PE parameters may reflect ATP-oriented pathways that consume photo-synthetically produced O2becoming more prevalent in the afternoon (Behrenfeld et al. 2004). The significance of the diurnal decrease in PE parameters is further apparent through the concomitant decline in GPP, especially considering the other parameters that influence GPP (Chl
aand kPAR) have no such diurnal pattern. The only other diurnal examination of gross photosynthesis in a eutrophic tropical lake occurred in hypereutrophic Lake George (Ganf and Horne 1975), where a similar decrease through the photoperiod was also observed.
The absence of a discernable diurnal pattern for Secchi depth, kPAR, ChlWC, and ChlZeuin any of the three inshore areas may be attributed to lateral advection of limnologi-cally distinct water masses within each bay. Contempora-neous euphotic and Secchi-depth measurements at nearby locations around each study site shown in Table 1 demonstrated within-bay spatial patchiness in each study area, and on the basis of the relation presented between kPARand Secchi depth with ChlZeupresented in Fig. 5, we can reasonably assume a similar small-scale spatial patchiness in Chl a. MacIntyre et al. (2002) documented that complex patterns of mixed-layer deepening and lateral advection are prominent hydrodynamic motions in Lake Victoria’s inshore Pilkington Bay. Differential mixing can drive the within-bay spatial variability observed (MacIn-tyre 1993), and lateral advection of distinct water masses in and out of the sampled stations then complicates the elucidation of diurnal patterns. The proposed link between within-bay spatial variability and diurnal variability is supported by the similar diurnal and spatial coefficients of variance for kPARand Secchi depth in each bay, as shown in Table 2.
Global implications—In shallow inshore areas of nutri-ent-rich Lake Victoria, the mean algal biomass is de-termined by the depth of the bay where hydrodynamic motions cause variance of algal biomass on both spatial and temporal scales. In turn, the quantity of Chl a then influences the optical properties and photosynthetic rates in the water column, as demonstrated through empirical relations shown in Figs. 5 and 7. Similar empirical relations have previously been developed that relate optical proper-ties of a water body to Chl a concentrations (i.e., Morel 1988), but to our knowledge, decreases in PE parameters along an increasing Chlagradient have not been explicitly shown in any other lake or ocean. Are these relations unique to Lake Victoria? Because Lake Victoria is a tropical lake, the relatively small temperature range minimizes the influence that temperature has on photosynthetic rates (Behrenfeld et al. 2002), whereas the wide range of Chlain Lake Victoria (Guildford and Hecky 2000) that can be observed in a brief study period allows discernable Chl
et al. (1996). In a literature review of lakes with similar Chl
aranges that report synchronous Chlaand PE-parameter measurements, only two studies were found. A reanalysis of PBMand Chladata from tropical Lake Awassa (Belay and Wood 1984 [Chl a ranges from 20 to 45 mg m23]) shows that a negative-growth model with a regression equation PBM 5 e(20.04Chla+3.56) was statistically significant (r2 5 0.59,p50.0002,n518) but not statistically similar to the linearly transformed regression equation of our data set (Student’s t-test, p . 0.05), and Erikson et al. (1998) observed a decline in PBM with Chl a in eutrophic Lake Xololtan. These studies suggest that relations between the PE parameters and Chl a may not be unique to Lake Victoria, but Lake Victoria may be an ideal system to resolve which environmental factors affect photosynthetic rates in a eutrophic environment because it offers a range of optical properties and hydrodynamic environments. The empirical relations presented in this paper can extend historic data sets in which only one parameter was measured or can be applied to lakewide spatial and temporal data sets to facilitate estimates of whole-lake primary production (Silsbe 2004).
When the nonlinear relation between Chlaand kPARis examined, together with declining PE parameters and increased Chla, in the context of a numerical phytoplank-ton-production model (Fee 1990), increased Chlathrough eutrophication does not proportionally increase GPP in Lake Victoria. This finding is of particular relevance to lake stakeholders who must weigh the environmental benefits of improved water quality to be achieved by reduction of nutrient loadings and dependent phytoplankton biomass against the possible reduction of economic benefits of a productive fishery. To resolve these possible conflicts in management objectives, further research that examines the relation between Chl a and integral phytoplankton pro-duction across a trophic gradient of aquatic ecosystems is necessary to determine the trade-offs between water clarity and nuisance algae as expressed through Chlaand integral phytoplankton production.
References
ASNANI, G. C. 1993. Tropical meteorology. V. 2. Indian Institute of Tropical Meteorology.
BEHRENFELD, M. J., E. MARANON, D. A. SIEGEL, AND S. B. HOOKER. 2002. Photoacclimation and nutrient-based model of light-saturated photosynthesis for quantifying oceanic prima-ry production. Mar. Ecol. Prog. Ser.228:103–117.
———, O. PRASIL, M. BABIN,ANDF. BRUYANT. 2004. In search of a physiological basis for covariations in light-limited and light-saturated photosynthesis. J. Phycol.40:4–23.
BELAY, A.,ANDR. B. WOOD. 1984. Primary productivity of five Ethiopian rift valley lakes. Verh. Internat. Verein. Limnol.22: 1187–1192.
BERGES, J. A., D. O. CHARLEBOIS, D. C. MAUZERALL,ANDP. G. FALKOWKSI. 1996. Differential effects of nitrogen limitation on photosynthetic efficiency of photosystems I and II in microalgae. Plant Physiol.110:689–696.
BRICAUD, A., M. BABIN, A. MOREL, AND H. CLAUSTRE. 1995. Variability in the chlorophyll-specific absorption coefficients of natural phytoplankton: Analysis and parameterization. J. Geophy. Res.100:13321–13332.
ERIKSON, R., E. HOOKER, M. MEJIA, A. ZELAYA,ANDK. VAMMEN. 1998. Optimal conditions for primary production in a poly-mictic lake (Lake Xolotlan, Nicaragua). Hydrobiologia 382: 1–16.
FALKOWSKI, P. G., T. G. OWENS, A. C. LEY, AND D. C. MAUZERALL. 1981. Effects of growth irradiance levels on the ratio of reaction centers in two species of marine phytoplank-ton. Plant Physiol.68:969–973.
———,ANDJ. A. RAVEN. 1997. Aquatic photosynthesis. Black-well Science.
FEE, E. J. 1990. Computer programs for calculating in-situ phytoplankton photosynthesis. Canadian Technical Report of Fisheries and Aquatic Sciences No. 1740.
GANF, G. G., AND A. J. HORNE. 1975. Diurnal stratification, photosynthesis and nitrogen-fixation in a shallow, equa-torial lake (Lake George, Uganda). Freshwater Biol. 5:13– 39.
GIKUMA-NJURUA, P.,ANDR. E. HECKY. 2005. Nutrient concentra-tions in Nyanza Gulf, Lake Victoria, Kenya: Light limits algal demand and abundance. Hydrobiologia 534: 131– 141.
GUILDFORD, S. J., ANDR. E. HECKY. 2000. Total nitrogen, total phosphorus, and nutrient limitation in lakes and oceans: Is there a common relationship? Limnol. Oceanogr. 45: 1213–1223.
HECKY, R. E. 1993. The eutrophication of Lake Victoria. Verh. Internat. Verein. Limnol.25:39–48.
———, F. W. B. BUGENYI, R. OCHUMBA, J. F. TALLING, R. MUGIDDE, M. GOPHEN, AND L. KAUFMAN. 1994. The de-oxygenation of Lake Victoria. Limnol. Oceanogr. 39: 1476–1481.
JASSBY, A. D.,ANDT. PLATT. 1976. Mathematical formulation of the relationship between photosynthesis and light for phyto-plankton. Limnol. Oceanogr.21:540–547.
JERLOV, N. G. 1976. Marine optics. Elsevier.
KILHAM, P., AND R. E. HECKY. 1988. Comparative ecology of marine and freshwater phytoplankton. Limnol. Oceanogr.33: 776–795.
KITCHELL, J. F., D. E. SCHINDLER, R. OGUTU-OHWAYO,ANDP. N. REINTHAL. 1997. The Nile perch in Lake Victoria: Inter-actions between predation and fisheries. Ecol. Appl.7: 653– 664.
KLING, H. J., R. MUGIDDE, AND R. E. HECKY. 2001. Recent changes in the phytoplankton community of Lake Victoria in response to eutrophication, p. 47–65.InM. Munawar and R. E. Hecky [eds.], The Great Lakes of the World (GLOW): Food-web, health and integrity. Backhuys Publishers. LEHMAN, J. T.,ANDD. K. BRANSTRATOR. 1993. Effects of nutrients
and grazing on the phytoplankton of Lake Victoria. Verh. Internat. Verein. Limnol.25:850–855.
LORENZEN, C. J. 1966. A method for the continuous measurement of in-vivo chlorophyll concentrations. Deep-Sea Res. 13: 223–227.
———. 1967. Determination of chlorophyll and pheo-pigments: Spectrophotometric equations. Limnol. Oceanogr. 12: 343–346.
MACINTYRE, S. 1993. Vertical mixing in a shallow, eutrophic lake—possible consequences for the light climate of phyto-plankton. Limnol. Oceanogr.38:798–817.
———, ROMERO, J. R.,ANDG. W. KLING. 2002. Spatial-temporal variability in surface layer deepening and lateral advection in an embayment of Lake Victoria, East Africa. Limnol. Oceanogr.47:656–671.
MONISMITH, S. G., J. IMBERGER, AND M. L. MORISON. 1990. Convective motions in the sidearm of a small reservoir. Limnol. Oceanogr.35:1676–1702.
MOREL, A. 1988. Optical modeling of the upper ocean in relation to its biogenous matter content (case 1 waters). J. Geophys. Res.93:10749–10768.
———, D. ANTOINE, M. BABIN, AND Y. DANDONNEAU. 1996. Measured and modeled primary production in the northeast Altantic (EUMELI JGOFS program): The impact of natural variations in photosynthetic parameters on model predictive skill. Deep-Sea Res.43:1273–1804.
MORI, T., B. BINDER,ANDC. H. JOHNSON. 1996. Circadian gating of cell division in cyanobacteria growing with average doubling times of less than 24 hours. Proc. Natl. Acad. Sci USA.93:10183–10188.
———. 1992. Changes in phytoplankton productivity and biomass in Lake Victoria (Uganda). M.Sc. thesis, Univ. of Manitoba.
———. 1993. The increase in phytoplankton primary productivity and biomass in Lake Victoria (Uganda). Verh. Internat. Verein. Limnol.25:846–849.
———. 2001. Nutrient status and phytoplankton nitrogen fixation in Lake Victoria, East Africa. Ph.D. thesis, Univ. of Waterloo.
———, R. E. HECKY, L. L. HENDZEL,ANDW. D. TAYLOR. 2003. Pelagic nitrogen fixation in Lake Victoria (East Africa). J. Great Lakes Res.29:76–88.
PAULY, D., AND V. CHRISTENSEN. 1995. Primary production required to sustain global fisheries. Nature374:255–257. RAMLAL, P. S., G. W. KLING, L. M. NDAWULA, R. E. HECKY,AND
H. J. KLING. 2001. Diurnal fluctuations in PCO2, DIC, oxygen and nutrients at inshore sites in Lake Victoria, Uganda, p. 67–82.InM. Munawar and R. E. Hecky [eds.], The Great Lakes of the World (GLOW): Food-web, health and integrity. Backhuys Publishers.
SEEHAUSEN, O., J. J. M. VANALPHEN,ANDF. WITTE. 1997. Cichlid fish diversity threatened by eutrophication that curbs sexual selection. Science277:1808–1811.
SENGER, H., AND P. FLEISCHHACKER. 1978. Adaptation of the photosynthetic apparatus ofScenedesmus obliquus to strong and weak light conditions. Physiol. Plant.43:35–42. SILSBE, G. M. 2004. Phytoplankton production in Lake Victoria,
East Africa. M.Sc. thesis, Univ. of Waterloo.
SIMONIT, S.,ANDC. PERRINGS. 2005. Indirect economic indicators in bio-economic fishery models: Agricultural price indicators and fish stocks in Lake Victoria. ICES J. Mar. Sci. 62: 483–492.
SMITH, R. C., ANDK. S. BAKER. 1978. The bio-optical state of ocean waters and remote sensing. Limnol. Oceanogr. 23: 247–259.
STAINTON, M. P., M. J. CAPEL,ANDF. A. J. ARMSTRONG. 1977. The chemical analysis of freshwater, 2nd ed. Canadian Fisheries and Marine Service Miscellaneous Special Publication 25. ———. 1957. The phytoplankton population as a compound
photosynthetic system. New. Phytol.56:133–149.
———. 1965. The photosynthetic activity of phytoplankton in East African lakes. Int. Revue ges. Hydrobiol.50:1–32. ———,ANDD. DRIVER. 1963. Some problems in the estimation of
chlorophyll-a in phytoplankton. Proceedings Conference on Primary Productivity Measurement, Marine and Freshwater. U.S. Atomic Energy Commission.
VERSCHUREN, D.,ANDoTHERS. 2002. History and timing of human impact on Lake Victoria, East Africa. Proc. R. Soc. Lond. B Biol. Sci.269:289–294.
WANINK, J. H.,ANDJ. J. KASHINDYE. 1998. Short-term variations in pelagic photosynthesis demand well-timed sampling to monitor long-term limnological changes in Lake Victoria. Hydrobiologia377:177–181.
WORTHINGTON, E. B. 1930. Observations on the temperature, hydrogen ion concentration, and other physical conditions of the Victoria and Albert Nyzanzas. Int. Revue ges. Hydrobiol. 25:328–357.