QE Journal │Vol.03 - No.01 - 1 INFLATION PERSISTENCE IN NORTH SUMATERA PROVINCE
Wily Julitawaty
STIE Professional Management College Indonesia North Sumatra, Indonesia
Email: [email protected]
Abstract
The purpose of this study was to determine the persistence of inflation in major North Sumatera Province in 2007 until 2012 and value contributed Output Growth (GDP) of North Sumatera, Exchange Rate, Interest Rate and Error Correction Term about Inflation in North Sumatera. Data is used secondary data from general Consumer Price Index (CPI) from North Sumatera Province include Medan, Pematangsiantar, Sibolga and Padangsidempuan monthly of January 2007 until December 2012. And secondary data Consumer Price Index (CPI) of North Sumatera Province, Gross Domestic Product of Province Sumatera Utara, Exchange Rate and Interest Rate of BI Rate yearly of 1999 until 2012. Model is used model econometric with Autoregressive method and Error Correction Model. Result of this research with estimation of VAR model concludes that degree of persistence of 4 town from North Sumatera Province is low. Result of estimation of model ECM concludes that Interest Rate significantly affect to inflation rate, while Gross Domestic Product of North Sumatera Province and Exchange Rate not significantly affect to inflation rate. While ECT becomes significant correction to variable inflation rate. Where the form of error correction in the ECM suggests a long‐term relationship between the variables inflation, GDP variable, the variable exchange rate and variable interest rate is comparable.
_________________________________
Keywords:Inflation Persistence, Inflation, IHK, Error Correction Model (ECM)
INTRODUCTION
QE Journal │Vol.03 - No.01 - 2 term. Macroeconomic variables can be seen from the national income, employment, money supply, inflation, investment, economic growth, interest rates and the international balance of payments, which in turn discuss the overall economic activity. Totonchi, (2011:460):
“Rapid and faster growth of the service sector that is related to population growth and immigration is another inflationary factor. Level competition and various society crust for large possession share from National income is one of the main factors of the hidden inflation in the developed investment countries. From this viewpoint, inflation is manifestation change of economic and society is chosen from the fast dynamic growth of economy”.
Inflation is a problem faced in the economy. Mirroring the inflation rate is the percentage rate of rise of prices within a certain time, which is used as a measure indicate poor economic problems faced. The stability of the general prices that have a broad impact on the economy is reflected by the rate of inflation. Properties owned persistent inflation, which is the higher degree of persistence so consequently it will be difficult for monetary policy to reduce inflation that caused the economy to be disturbed.
Persistence can be said to be a tendency to be stronger, which may occur in the persistence of the increase and decrease of natural values. Persistence is said to be positive if the persistence is above its natural value, whereas if the negative is said to be under its natural value. In general, the persistence of inflation only examined to determine the rate of increase is faster than the decline in inflation to return to its natural rate Marques, (2005:69).
QE Journal │Vol.03 - No.01 - 3 responses of inflation to non-systematic policy actions (Batini and Nelson,2002).
In 2009, a form of monetary policy tend to be loose as one of Indonesia Central Bank 's commitment to provide a stimulus for economic recovery and build a solid foundation for sustainable economic growth in the future. The policy was adopted amid considerable pressure on the stability of the financial system so that various easing policies in force since the final quarter of 2008 were maintained, even strengthened to maintain the proper functioning of the money market.
Various it is possible to do in the middle of the lower inflation pressures. With the various policy both in terms of monetary and fiscal, the Indonesian economy recorded positive growth, better than many countries that are still faced with negative growth. Meanwhile, the balance of payments recorded a surplus, the Rupiah has strengthened, and inflation is under its target range.
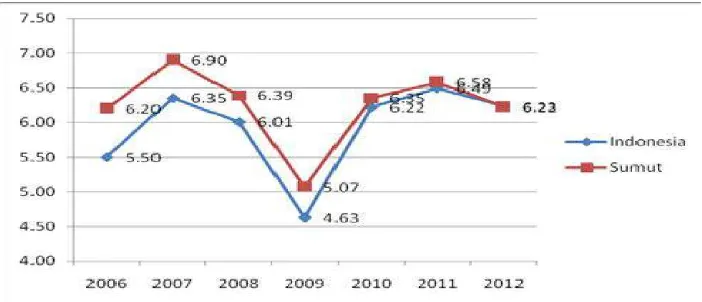
Source: Central Bureau of Statistics North Sumatera Province, processed
QE Journal │Vol.03 - No.01 - 4 Indications of slowing economic growth are also shown by the low rate of economic growth compared to the growth of national economy.
Inflation in the second quarter of 2012, it stood at 1.51% (qtq), higher than last quarter by 0.63% (qtq). The increase in the inflation rate was triggered by the summer school holidays and the new school year. Annually, North Sumatera inflation also increased to 5.52% (yoy) from earlier amounted to 3.86% (yoy).
Judging from the disaggregation of inflation, inflation Province of North Sumatera in the second quarter of 2012 was dominated by the more volatile food inflation (7.87%), followed by core inflation (5.04%), and administered prices inflation (4.00%). The food category has the highest quarterly inflation rate than other groups, ie 2.82% (qtq). Food commodities contributed sizeable inflation over the second quarter of 2012 is a red pepper, dencis, garlic, onion, mackerel, rice, and chicken meat. Almost all groups of goods and services inflation in the second quarter of 2012 unless the clothing is actually deflation of ‐0.43% (qtq). Instead foodstuff that in the first quarter of 2012 deflation of 0.27% (qtq), in this quarter inflation actually rose by 2.82% (qtq).
From 4 cities in North Sumatera were calculated inflation, the entire city has increased the rate of inflation. Quarterly Inflation highest in Sibolga, by 2.33% (qtq), followed by inflation of 1.93% Pematangsiantar city (qtq). Meanwhile, the city of Medan and Padangsidempuan inflation respectively by 1.44% (qtq) and 1.18% (qtq).
QE Journal │Vol.03 - No.01 - 5
Table 1. Quarterly Inflation in North Sumatera Cities (%)
No City
2010 2011 2012
I II III IV I II III IV I II
1 Medan 1.05 2.12 1.52 2.76 0.32 0.00 3.46 ‐0.28 0.52 1.44
2 Pematang Siantar 1.04 2.89 1.08 4.37 1.19 0.00 2.76 0.64 1.60 1.93
3 Padangsidempuan 0.38 2.13 0.82 3.92 0.87 ‐0.01 6.03 1.35 0.36 1.18
4 Sibolga 1.21 2.60 2.67 4.89 0.79 ‐0.01 2.02 1.77 0.82 2.33
Composite 1.03 2.21 1.49 3.06 0.44 0.00 3.34 0.00 0.63 1.51 Sources : Central Bureau of Statistics, processed, 2012
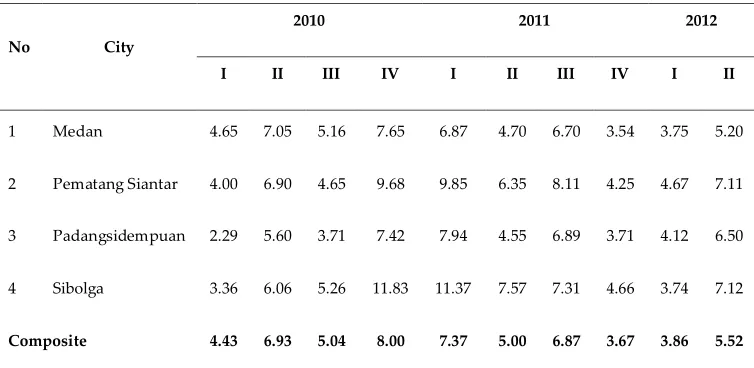
The inflation rate is calculated inflation the fourth city in North Sumatera, all experienced an increase in the level of inflation when compared to last quarter. Inflation is the highest Sibolga city compared to other cities, amounting to 7.12% (yoy), followed by the city of Pematangsiantar 7.11% (yoy). Meanwhile, inflation Padangsidempuan city and Medan respectively by 6.50% (yoy) and 5.20% (yoy).
Table 2. Annual Inflation in Four Cities of North Sumatera (%, yoy)
No City
2010 2011 2012
I II III IV I II III IV I II
1 Medan 4.65 7.05 5.16 7.65 6.87 4.70 6.70 3.54 3.75 5.20
2 Pematang Siantar 4.00 6.90 4.65 9.68 9.85 6.35 8.11 4.25 4.67 7.11
3 Padangsidempuan 2.29 5.60 3.71 7.42 7.94 4.55 6.89 3.71 4.12 6.50
4 Sibolga 3.36 6.06 5.26 11.83 11.37 7.57 7.31 4.66 3.74 7.12
Composite 4.43 6.93 5.04 8.00 7.37 5.00 6.87 3.67 3.86 5.52
QE Journal │Vol.03 - No.01 - 6 Many factors influence the rise and fall of the inflation rate in North Sumatera, causing the difficulty in controlling inflation low and stable. Therefore there are measures taken to cope with the rate of inflation in North Sumatera. The steps that can be taken by the government, in addressing the issues in the economy of North Sumatera is to create a policy that keeping inflation and create a stable monetary stability. The importance of the main factors that can cause a rise in the rate of inflation is necessary, to determine the steps taken by the government to suppress excessive rate of inflation, and it is not easy to do and requires in‐depth research.
METHODOLOGY
In this case the analytical methods used for the measurement of persistence is a method of autoregressive (AR) time series models (Beechey and
: Constants of the results of the estimation process, as control of the average inflation
: Random error term or residual from the regression equation above K : The maximum lag order.To measure the degree of persistence in relation to the sum of the AR coefficients, useful parameters to consider persistence (Levin et al, 2004):
j
(2)
Presidential approval, macropartisanship, public policy mood, per capita GNP, and many other political time series have been described as first‐ order autoregressive processes such that the current value of the process is a function of its own past value and some random error (Suzanna, 2000).
t t
t
y
QE Journal │Vol.03 - No.01 - 7 To determine the cause of inflation, used regression analysis using a dynamic model that is Error Correction Model as follows:
D : Differentiation (distinction) Log : Natural logarithm
NS Inflation : Rate Inflation of North Sumatera Province in period t NS GDP : Gross Domestic Product of North Sumatera Province in
period t
Exchange Rate : Exchange Rate U.S. Dollar against Rupiah in the period t Interest Rate : Interest Rate BI Rate in period t
ECT : Error Correction Term,
ECT : log North Sumatera GDP (‐1) + log Exchange Rate (‐1) + log Interest Rate (‐1) ‐ log North Sumatera Inflation (‐1) 0 inflation. In the multivariate model, we add information contained in real output and the central bank’s key interest rate (Dossche and Everaert, 2007; Marques, 2004; Mbaga and Coyle, 2003).
QE Journal │Vol.03 - No.01 - 8 Housing, Water, Electricity Gas and Fuel; (d) Clothing; (e) Medical Care; (f) Education, Recreation and Sports; (g) Transportation, Communication and Financial Services
2. Annual inflation (year‐of‐year) was measured using the Consumer Price Index (CPI) of North Sumatera Province at Constant Price, Gross Domestic Product (GDP) of North Sumatera, Exchange Rate and Interest Rate (BI Rate) which use the data from 1999 to 2012.
The model used methods autoregressive (AR) time to see the persistence of inflation and Error Correction Model to see the cause of inflation. Prior to the regression error correction model unit root test, cointegration, autocorrelation and mulitkolinearitas.
Inflation persistence
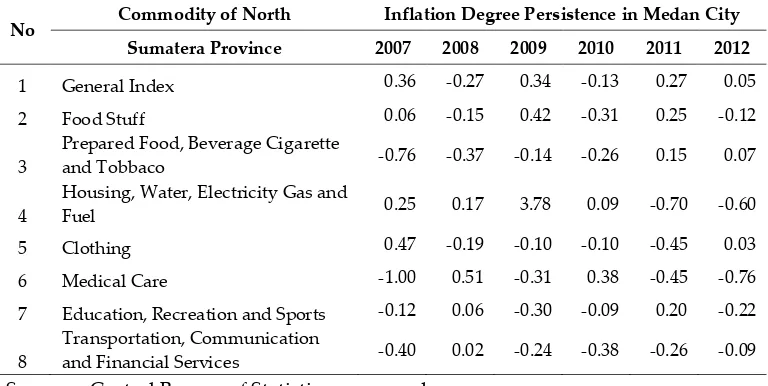
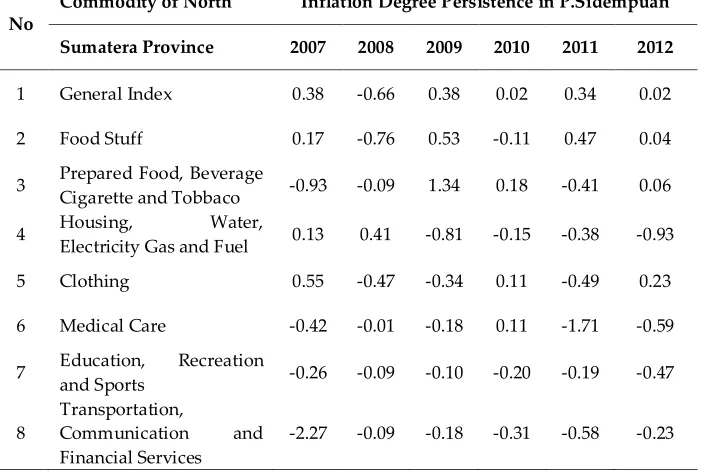
By using the full sample estimation degrees of persistence of North Sumatera Province is the city of Medan, P. Siantar, Sibolga and P. Sidempuan show that CPI inflation in North Sumatera is still very persistent. Of the seven commodity groups showed a low degree of persistence.
Table 3. Degree of Inflation Persistence Commodity Group Medan
No Commodity of North Inflation Degree Persistence in Medan City Sumatera Province 2007 2008 2009 2010 2011 2012
1 General Index 0.36 ‐0.27 0.34 ‐0.13 0.27 0.05
2 Food Stuff 0.06 ‐0.15 0.42 ‐0.31 0.25 ‐0.12
3 Prepared Food, Beverage Cigarette and Tobbaco ‐0.76 ‐0.37 ‐0.14 ‐0.26 0.15 0.07
4 Housing, Water, Electricity Gas and Fuel 0.25 0.17 3.78 0.09 ‐0.70 ‐0.60
5 Clothing 0.47 ‐0.19 ‐0.10 ‐0.10 ‐0.45 0.03
6 Medical Care ‐1.00 0.51 ‐0.31 0.38 ‐0.45 ‐0.76
7 Education, Recreation and Sports ‐0.12 0.06 ‐0.30 ‐0.09 0.20 ‐0.22
8 Transportation, Communication and Financial Services ‐0.40 0.02 ‐0.24 ‐0.38 ‐0.26 ‐0.09 Sources : Central Bureau of Statistics, processed
QE Journal │Vol.03 - No.01 - 9
No Commodity of North Inflation Degree Persistence in P.Siantar City Sumatera Province 2007 2008 2009 2010 2011 2012
1 General Index 0.10 0.13 0.16 ‐0.25 0.24 ‐0.60
2 Food Stuff ‐0.12 0.12 0.16 ‐0.19 0.23 ‐0.60
3 Prepared Food, Beverage Cigarette and Tobbaco 0.21 ‐0.53 0.32 0.00 ‐0.38 ‐0.93
4
Housing, Water, Electricity Gas and
Fuel ‐0.08 0.22 ‐0.28 0.21 ‐0.07 0.23
5 Clothing ‐0.42 ‐0.11 ‐0.26 0.07 ‐0.49 0.25
6 Medical Care ‐0.37 ‐0.65 ‐0.14 ‐0.42 ‐0.65 0.13
7 Education, Recreation and Sports ‐0.13 0.06 0.18 0.40 ‐0.01 0.27
8 Transportation, Communication and Financial Services ‐0.48 ‐0.16 0.24 ‐0.32 ‐1.07 0.19 Sources : Central Bureau of Statistics, processed
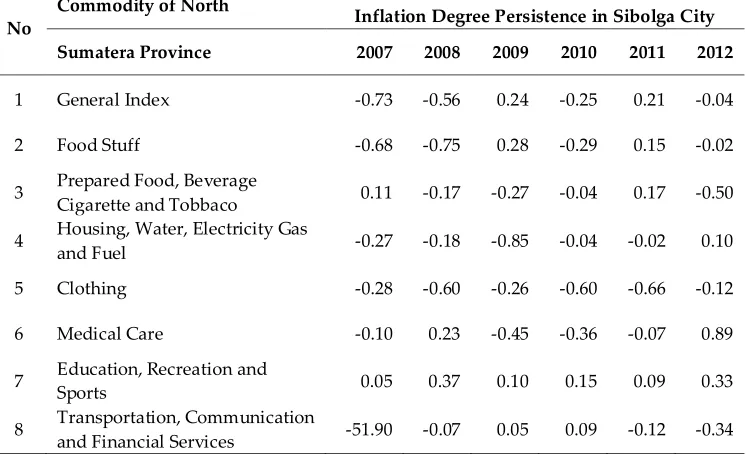
Table 5. Degree of Inflation Persistence Commodity City Group Sibolga
No Commodity of North Inflation Degree Persistence in Sibolga City Sumatera Province 2007 2008 2009 2010 2011 2012
1 General Index ‐0.73 ‐0.56 0.24 ‐0.25 0.21 ‐0.04
2 Food Stuff ‐0.68 ‐0.75 0.28 ‐0.29 0.15 ‐0.02
3 Prepared Food, Beverage Cigarette and Tobbaco 0.11 ‐0.17 ‐0.27 ‐0.04 0.17 ‐0.50
4 Housing, Water, Electricity Gas and Fuel ‐0.27 ‐0.18 ‐0.85 ‐0.04 ‐0.02 0.10
5 Clothing ‐0.28 ‐0.60 ‐0.26 ‐0.60 ‐0.66 ‐0.12
6 Medical Care ‐0.10 0.23 ‐0.45 ‐0.36 ‐0.07 0.89
7 Education, Recreation and Sports 0.05 0.37 0.10 0.15 0.09 0.33
QE Journal │Vol.03 - No.01 - 10
Table 6. Degree of Inflation Persistence Commodity City Group P.Sidempuan
No Commodity of North Inflation Degree Persistence in P.Sidempuan Sumatera Province 2007 2008 2009 2010 2011 2012
1 General Index 0.38 ‐0.66 0.38 0.02 0.34 0.02
2 Food Stuff 0.17 ‐0.76 0.53 ‐0.11 0.47 0.04
3 Prepared Food, Beverage Cigarette and Tobbaco ‐0.93 ‐0.09 1.34 0.18 ‐0.41 0.06
4 Housing, Electricity Gas and Fuel Water, 0.13 0.41 ‐0.81 ‐0.15 ‐0.38 ‐0.93
5 Clothing 0.55 ‐0.47 ‐0.34 0.11 ‐0.49 0.23
6 Medical Care ‐0.42 ‐0.01 ‐0.18 0.11 ‐1.71 ‐0.59
7 Education, and Sports Recreation ‐0.26 ‐0.09 ‐0.10 ‐0.20 ‐0.19 ‐0.47
8 Transportation, Communication and
Financial Services ‐2.27 ‐0.09 ‐0.18 ‐0.31 ‐0.58 ‐0.23 Sources : Central Bureau of Statistics, processed
Causes of Inflation
Insukindro, (1999) states that the ability of the ECM to include many variables in the analysis of economic phenomena of short‐term and long‐ term as well as assessing whether or not consistent with the empirical model of econometric theory, and in an effort to find solutions to the problem of time series variables that not stationary and spurious regression or spurious correlation.
ECM research model was used to determine the effect of a given economic variables Sumatera GDP, exchange rate and interest rate to changes in the Consumer Price Index inflation (CPI) of North Sumatera. Error correction model used in this study to estimate the model in the long term.
QE Journal │Vol.03 - No.01 - 11
DLOGNS_INFLATION = 0.555316-6.512628*LOGNS_GDP+0.372044* DLOGER + 2.127754 * DLOGTRATE-0.927276*ECT
The results of the economic interpretation of equation error correction model above as follows:
1. Variable GDP North Sumatera
North Sumatera GDP variable in the model has no effect on the variable rate of inflation. Gross Domestic Product has no effect on inflation can be seen from the inflationary pressure from administered prices still have a great influence, especially on commodities due to rising fuel prices gasoline. Similarly, inflationary pressure from volatile foods such as rice and spices. The increase in fuel prices also influence the expected rise in the prices of foodstuffs.
2. Variable Exchange Rate
Exchange variables in the model had no effect on the variable rate of inflation. In this study does not affect the exchange rate of inflation because inflation in Indonesia is influenced by demand from the food sector and the prices set by the government, for example the price of fuel oil. The impact of the Rupiah weakened against the Dollar which led to imported inflation stemming from the consumption of imported products can be said to be not significantly affect the structure of the economy. Where the movement of the price level by foreign currency will not lead to increase in prices of goods and the Rupiah weakened and falling stock prices caused by U.S. monetary policy‐setting and a decline in exports caused by the slow growth of the world economy has not effect on inflation in Indonesia.
3. Variable Interest Rate
QE Journal │Vol.03 - No.01 - 12 global economic performance and remain controlled inflation. The existence of interest rate policy response is strengthened to curb inflationary pressure from rising international commodity prices. Tight monetary policy will be continued to absorb excess liquidity optimally so that the possibility of a rate hike is gradual and measured. BI rate policy directed consistent with the inflation target and is conducive to the stability of the financial system and the economy.
4. ECT (Error Correction Term)
Figures Error Correction Term or error correction is ECTt‐1 of ‐0.927276.
Negative coefficient indicates that there is an adjustment towards the long‐ term equilibrium. ECT coefficient significant at α = 5% indicates that the error can be said to affect the balance of inflation. Then the coefficient of ECT is not equal to zero which means that inflation is not reached equilibrium in the short term. ECT coefficient indicates an imbalance that will adjust the balance equation in the next period. ECT coefficient that indicates the value of ‐0.927276 means that inflation over the study period is said to be low or is below equilibrium. ECT be a significant correction to the variable rate of inflation. Where the form of error correction in the ECM suggests a long‐term relationship between the variables Inflation, GDP variable, the variable exchange rate and variable interest rate is comparable (or one‐to‐one).
CONCLUSIONS AND SUGGESTIONS Conclutions
By using the full sample estimate of the degree of persistence of the results of North Sumatera Province is the city of Medan, P. Siantar, Sibolga and P. Sidempuan could that CPI inflation in North Sumatera is still very persistent. Of the seven commodity groups showed a low degree of persistence.
QE Journal │Vol.03 - No.01 - 13 ECT be a significant correction to the variable rate of inflation. Where the form of error correction in the ECM suggests a long‐term relationship between the variables inflation, GDP variable, the variable exchange rate and variable interest rate is comparable.
Suggestion
There was an effort of the government and Inflation Control Team of North Sumatera Province excessive restrict inflation and control the prices of goods that are not too high in the community. Considering the price of price information center to avoid the error rates used by speculators to take advantage. Conduct research regional inflation may provide scientific input to efforts to control inflation.
Developing industrial sector that will increase revenue and encourage increased rate of GDP. In order to determine the stability of government SBI rate.
The presence of government in the economy monetary policy in maintaining the stability of the exchange rate and do the steps in the stabilization of the foreign exchange market so that the Rupiah against the Dollar to strengthen.
REFERENCES
Batini, N. and Nelson, E.. 2002. The Lag From Monetary Policy Actions To Inflation: Friedman Revisited. Bank of England. Discussion Paper No. 6.
Beechey, M. and Osterholm, P.. 2007. The Rise and Fall of U.S. Inflation Persistence. Board of Governors of The Federal Reserve System. Finance and Economics. Discussion Paper No. 2007‐26.
Dossche, M. and Everaert, G.. 2007. Disentangling the Sources of Inflation Persistence. National Bank of Belgium. Paper Series.
Dossche, M. and Everaert, G.. 2005. Measuring Inflation Persistence: A Structural Time Series Approach. National Bank of Belgium Working Paper Series No. 495 / JUNE 2005.
QE Journal │Vol.03 - No.01 - 14 Insukindro. 1999. Pemilihan Model Ekonomi Empirik dengan Pendekatan Koreksi Kesalahan. Jurnal Ekonomi dan Bisnis Indonesia (JEBI), 14(1):1‐8.
Levin A. T., Natalucci F. M. and Piger J.M.. 2004. The Macroeconomic Effects of Inflation Targeting. The Federal Reserve Bank of St. Louis. Economic Review.
Levin A. T. and Piger J. M.. 2004 Is Inflation Persistence Intrinsic In Industrial Economies?. European Central Bank. Working Paper Series No. 334 / APRIL 2004.
Marques, C. R.. 2004. Inflation Persistence: Facts or Artefacts?. European Central Bank. Working Paper Series.
Marques, C. R.. 2005. Inflation Peristence: Facts or Artefacts?. Economic Bulletin.
Mbaga M. and Coyle B. T.. 2003. Beef Supply Response Under Uncertainty: An Autoregressive Distributed Lag Model. Western Agricultural Economics Association. Journal ofAgricultura1 and Resource Economics 28 (3):5 19‐539.
Suzanna, D. B.. 2000. Modeling Equilibrium Relationships: Error Correction Models with Strongly Autoregressive Data. The Pennsylvania State University. University Park, PA.
Totonchi, J. 2011 Islamic Azad University, Yazd Branch, Department of Economics, Yazd, Iran ([email protected]). Macroeconomic Theories of Inflation. Singapore: IACSIT Press. International Conference on Economics and Finance Research IPEDR vol 4.