Magnus Jonsson · Alexey Vinel
Boris Bellalta · Olav Tirkkonen
(Eds.)
123
LNCS 9305
8th International Workshop, MACOM 2015
Helsinki, Finland, September 3–4, 2015
Proceedings
Lecture Notes in Computer Science
9305
Commenced Publication in 1973 Founding and Former Series Editors:
Gerhard Goos, Juris Hartmanis, and Jan van Leeuwen
Editorial Board
David Hutchison
Lancaster University, Lancaster, UK Takeo Kanade
Carnegie Mellon University, Pittsburgh, PA, USA Josef Kittler
University of Surrey, Guildford, UK Jon M. Kleinberg
Cornell University, Ithaca, NY, USA Friedemann Mattern
ETH Zurich, Zürich, Switzerland
John C. Mitchell
Stanford University, Stanford, CA, USA Moni Naor
Weizmann Institute of Science, Rehovot, Israel C. Pandu Rangan
Indian Institute of Technology, Madras, India Bernhard Steffen
TU Dortmund University, Dortmund, Germany Demetri Terzopoulos
University of California, Los Angeles, CA, USA Doug Tygar
University of California, Berkeley, CA, USA Gerhard Weikum
Magnus Jonsson
•Alexey Vinel
Boris Bellalta
•Olav Tirkkonen (Eds.)
Multiple Access
Communications
8th International Workshop, MACOM 2015
Helsinki, Finland, September 3
–
4, 2015
Proceedings
Editors
Magnus Jonsson Halmstad University Halmstad
Sweden
Alexey Vinel Halmstad University Halmstad
Sweden
Boris Bellalta
Universitat Pompeu Fabra Barcelona
Spain
Olav Tirkkonen Aalto University Espoo
Finland
ISSN 0302-9743 ISSN 1611-3349 (electronic) Lecture Notes in Computer Science
ISBN 978-3-319-23439-7 ISBN 978-3-319-23440-3 (eBook) DOI 10.1007/978-3-319-23440-3
Library of Congress Control Number: 2015947116
LNCS Sublibrary: SL5–Computer Communication Networks and Telecommunications
Springer Cham Heidelberg New York Dordrecht London
©Springer International Publishing Switzerland 2015
This work is subject to copyright. All rights are reserved by the Publisher, whether the whole or part of the material is concerned, specifically the rights of translation, reprinting, reuse of illustrations, recitation,
broadcasting, reproduction on microfilms or in any other physical way, and transmission or information
storage and retrieval, electronic adaptation, computer software, or by similar or dissimilar methodology now known or hereafter developed.
The use of general descriptive names, registered names, trademarks, service marks, etc. in this publication
does not imply, even in the absence of a specific statement, that such names are exempt from the relevant
protective laws and regulations and therefore free for general use.
The publisher, the authors and the editors are safe to assume that the advice and information in this book are believed to be true and accurate at the date of publication. Neither the publisher nor the authors or the editors give a warranty, express or implied, with respect to the material contained herein or for any errors or omissions that may have been made.
Printed on acid-free paper
Preface
It is our great pleasure to present the proceedings of the 8th International Workshop on Multiple Access Communications (MACOM), which was held in Helsinki during September 3–4, 2015. Previous events were organized in Halmstad (2014), Vilnius (2013), Maynooth (2012), Trento (2011), Barcelona (2010), Dresden (2009), and Saint-Petersburg (2008).
Our gratitude goes to the Technical Program Committee and external reviewers for their efforts in selecting 12 high-quality contributions (out of 18 submitted) to be presented and discussed at the workshop.
The contributions gathered in these proceedings describe the latest advancements in the field of multiple access communications, with an emphasis on wireless sensor networks, physical layer techniques, resources handling and allocation, medium access control protocols, and video coding.
Finally, we would like to take this opportunity to express our gratitude to all the participants, together with the local organizers, who helped to make MACOM 2015 a very successful event.
September 2015 Olav Tirkkonen
Organization
MACOM 2015 was organized by Aalto University, Finland.
Executive Committee
General Co-chairs
Olav Tirkkonen Aalto, Finland
Alexey Vinel HH, Sweden
TPC Co-chairs
Boris Bellalta UPF, Spain
Magnus Jonsson HH, Sweden
Local Chair
Ragnar Freij Aalto, Finland
Publication Chair
Nikita Lyamin HH, Sweden
Technical Program Committee
Konstantin Avrachenkov INRIA Sophia Antipolis, France Florin Avram Universitéde Pau, France Abdelmalik Bachir Imperial College London, UK
Sandjai Bhulai VU University Amsterdam, Netherlands Giuseppe Bianchi University of Rome“Tor Vergata”, Italy Torsten Braun University of Bern, Switzerland
Raffaele Bruno IIT-CNR, France
Peter Buchholz TU Dortmund, Germany
Claudia Campolo UniversitàMediterranea di Reggio Calabria, Italy Cristina Cano Hamilton Institute, Ireland
Periklis Chatzimisios Alexander TEI of Thessaloniki, Greece Young-June Choi Ajou University, South Korea
Tugrul Dayar Bilkent University, Turkey Desislava Dimitrova University of Bern, Switzerland Alexander Dudin Belarusian State University, Belarus Marc Emmelmann Fraunhofer FOKUS, Germany Lorenzo Favalli University of Pavia, Italy Dieter Fiems Ghent University, Belgium Andres Garcia-Saavedra Trinity College Dublin, Ireland
Geert Heijenk University of Twente, Netherlands
Andras Horvath University of Turin, Dip. di Informatica, Italy
Ganguk Hwang KAIST, South Korea
Dragi Kimovski University for Information Science
and Technology - R. Macedonia, Macedonia Valentina Klimenok Belarusian State University, Belarus
Jarkko Kneckt Nokia Research Center, Finland Kristina Kunert Halmstad University, Sweden Douglas Leith Hamilton Institute, Ireland
Arturas Medeisis International Telecommunication Union, Saudi Arabia
Dmitry Osipov IITP RAS, Russia
Evgeny Osipov LTU LuleåUniversity of Technology, Sweden Edison Pignaton de Freitas Federal University of Santa Maria, Brazil Vicent Pla Universitat Politecnica de Valencia, Spain
Zsolt Saffer Budapest University of Technology and Economics, Hungary
Nikos Sagias University of Peloponnese, Greece Pablo Salvador IMDEA Networks Institute, Spain
Bruno Sericola INRIA Rennes - Bretagne Atlantique, France Susanna Spinsante UniversitàPolitecnica delle Marche, Italy Andrey Trofimov Saint-Petersburg State University of Aerospace
Instrumentation, Russia
Bernhard Walke RWTH Aachen University, Germany Till Wollenberg University of Rostock, Germany
Yan Zhang Simula Research Laboratory and University of Oslo, Norway
Contents
MAC I
Multi-objective and Financial Portfolio Optimization of Carrier-Sense
Multiple Access Protocols with Cooperative Diversity . . . 3 Ramiro Samano-Robles and Atilio Gameiro
A Centralized Mechanism to Make Predictions Based on Data
from Multiple WSNs . . . 19 Gabriel Martins Dias, Simon Oechsner, and Boris Bellalta
A Study of Energy Efficiency Techniques Using DRX for Handover
Management in LTE-A Networks . . . 33 Tanu Goyal and Sakshi Kaushal
PHY
Sequential Incomplete Information Game in Relay Networks
Based on Wireless Physical Layer Network Coding. . . 47 Tomas Hynek and Jan Sykora
Device-to-Device Data Storage with Regenerating Codes . . . 57 Joonas Pääkkönen, Camilla Hollanti, and Olav Tirkkonen
A Random Access Protocol Incorporating Multi-packet Reception,
Retransmission Diversity and Successive Interference Cancellation . . . 70 Ramiro Samano-Robles, Desmond C. McLernon, and Mounir Ghogho
Information Theory
Distortion Avoidance While Streaming Public Safety Video
in Smart Cities . . . 89 Evgeny Khorov, Andrey Gushchin, and Alexander Safonov
On the Channel Capacity of an Order Statistics-Based Single-User
Reception in a Multiple Access System . . . 101 Dmitry Osipov
MAC II
Near-Optimal Resource Allocation in Cooperative Cellular Networks
Using Genetic Algorithms . . . 123 Zihan Luo, Simon Armour, and Joe McGeehan
Optimal and Equilibrium Retrial Rates in Single-Server Multi-orbit
Retrial Systems . . . 135 Konstantin Avrachenkov, Evsey Morozov, and Ruslana Nekrasova
GOAT: A Tool for Planning Wireless Sensor Networks . . . 147 Sergio Barrachina, Toni Adame, Albert Bel, and Boris Bellalta
Multi-objective and Financial Portfolio
Optimization of Carrier-Sense Multiple Access
Protocols with Cooperative Diversity
Ramiro Samano-Robles1(B)and Atilio Gameiro2
1 Research Centre in Real-Time and Embedded Computing Systems, Porto, Portugal
2 Instituto de Telecomunica¸c˜oes, Campus Universit´ario, 3810-193 Aveiro, Portugal
Abstract. This paper addresses a trade-off design and optimization of a class of wireless carrier-sense multiple access (CSMA) protocols where collision-free transmissions are assisted by the cooperative resions of inactive terminals with a correct copy of the original transmis-sion(s). Terminals are thus enabled with a decode-and-forward (DF) relaying protocol. The analysis is focused on asymmetrical settings, where terminals explicitly experience different channel and queuing statistics. This work is based on multi-objective and financial portfolio optimization tools. Each packet transmission is thus considered not only as a network resource, but also as a financial asset with different values of return and risk (or variance of the return). The objective of this finan-cial optimization is to find the transmission policy that simultaneously maximizes return and minimizes risk in the network. The work presented here is focused on the characterization of the boundaries (envelope) of different types of trade-off performance region: the conventional through-put region, sum-throughthrough-put vs. fairness, sum-throughthrough-put vs. power con-sumption, and return vs. risk regions. Fairness is evaluated by means of the Gini-index, which is commonly used in economics to measure income inequality. Transmit power consumption is directly linked to the global transmission rate. The protocol is shown to outperform non-cooperative solutions under different network conditions that are discussed in detail in the main body of the paper.
Keywords: Cooperative diversity
·
Random access·
Throughput region·
Multi-objective and financial portfolio optimization1
Introduction
1.1 Background and Open Issues
Wireless networks are rapidly evolving. Behind this quick evolution, there is a set of powerful, increasingly complex and adaptive physical (PHY) layer tech-nologies. The study of advanced signal processing tools with multiple antennas,
c
Springer International Publishing Switzerland 2015
4 R. Samano-Robles and A. Gameiro
cooperative users and interference control requires new layer and cross-system design methodologies [1]. This means that the optimization of MAC and RRM algorithms should consider more details of the underlying PHY-layer. In addition, application layers are becoming increasingly heterogeneous, with dif-ferent quality of service requests and difdif-ferent pricing policies. The number of metrics, parameters and issues to be simultaneously addressed is thus consider-ably large in comparison with legacy networks [2]. This already large number of metrics is expected to increase even further with the advent of cognitive radios that will allow unlicensed terminals to access underutilized portions of licensed spectrum. Each spectrum band will be thus subject not only to different prop-agation and load conditions, but also to different licensing, billing and pricing schemes. Therefore, new tools are required in the design of future wireless net-works, which are able to handle simultaneously network and economic metrics.
1.2 Paper Objectives
This paper proposes the use of multi-objective and financial portfolio optimiza-tiontools for a trade-off analysis and optimization of a wireless carrier-sense mul-tiple access (CSMA) protocol enabled with cooperative relaying diversity. Multi-objective optimization is the formal mathematical framework that addresses the simultaneous optimization of different and potentially competing objective func-tions [3]. Since this type of problem usually lacks a unique solution that simulta-neously satisfies the individual optimality conditions of all targeted metrics, the concept ofPareto optimality is commonly employed. A Pareto optimal solution provides an optimal solution for a subset of the objective functions, i.e. it is not dominated by any other solution [3]. The number of Pareto solutions can be potentially infinite, thus describing aPareto frontier. The objective functions of this multi-objective optimization problem can also include financial portfo-lio metrics such as return and risk (or variance of the return). Each network resource can be therefore considered also as a financial asset whose allocation will attempt to maximize return and minimize risk, similar to a financial stock market problem.
Multi-objective and Financial Portfolio Optimization 5
reception model were proposed previously in [9] and [10], respectively. The anal-ysis presented here is focused on different types of trade-off region: throughput region, sum-throughput vs. fairness, sum-throughput vs. power, and return vs. risk regions. The results shed light on the advantages of cooperation in terms of trade-off analysis between different metrics.
1.3 Related Works
Techno-economic analysis and study of wireless networks has been addressed extensively in the literature. The conventional approach is the use of a techno-economic model to evaluate the revenue of an operator under a given set of resource allocation assumptions. The main objective was to find the optimum resource allocation that provides the highest revenue and that satisfies users of the network [11]. In the context of cognitive radio, research in this area has been intensive over the last few years due to the relevance of opportunistic spectrum usage. A review of different approaches for the use of economic optimization tools in cognitive radio can be found in [12]. The authors have also proposed a market equilibrium approach where primary and secondary users implement a learning algorithm so that they can adapt accordingly the amount of spectrum used, the pricing and the optimum demand. Most of the existing works are based on game theoretic concepts (see [13]- [17]). The work in [16] has used an atomic congestion game theoretic approach in a wireless network with spatial reuse and inter-user interference. The work in [17] addresses the problem of calculating the optimum spectrum pricing in a dynamic spectrum market. Another related approach for the use of economics in cognitive radio can be found in works such as [18] and [19] and references therein, which are based on the concepts of auction theory.
This paper uses multi-objective portfolio optimization under the assumption that each transmission is a financial asset. Our work explicitly introduces the concept of risk in the resource allocation problem and derives relevant expres-sions that allow for its interpretation as a financial stock market problem. The work in [20] has used the concept of return and variance of the return in the context of spectrum pricing. Our approach is different from these previous works regarding the explicit use of multi-objective optimization and the exploration of the boundaries of different Pareto optimal frontiers. This allows us to visualize geometrical attributes and the potential trade-off between network and economic performance metrics. In other words, instead of searching a Nash or market equi-librium as in game theory, our contribution explicitly explores the boundaries of different trade-off performance regions. In this sense, our approach complements previous works in the literature by providing a framework for trade-off analysis and explicit interpretation of financial market stock tools in wireless networks.
6 R. Samano-Robles and A. Gameiro
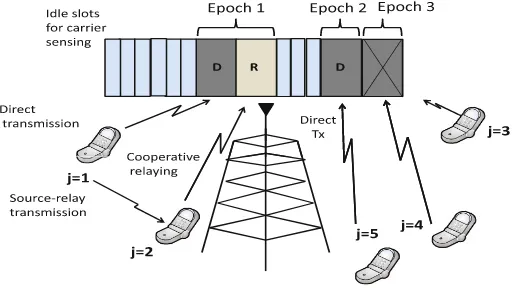
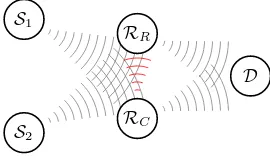
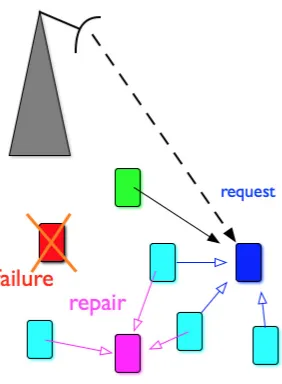
Fig. 1.Carrier-sense multiple access network with cooperative diversity
2
System Model and Protocol Description
Consider the slotted wireless random access network depicted in Fig.1with one base station (BS) andJ user terminals. Each userjhas a buffer that is assumed to have always packets ready to be transmitted (full queue or dominant system assumption). Transmissions will be controlled by a Bernoulli random process with parameter pj, which is also the transmission probability of user j. All channels are independently and Rayleigh distributed with parameterσj for the link between user j and the BS, and with parameterσj(k) for the link between userj and userk. Users are allowed to cooperate with each other by relaying, if necessary, their signals towards the BS, where they are conveniently combined. The cooperative terminals will employ decode-and-forward (DF) relaying proto-col. Since cooperation in half duplex systems requires more than one phase or time-slot, transmissions will be arranged inperiods or epoch-slotswith a variable length (in time- slots) denoted by the random variablel(see Fig.1). At the begin-ning of an epoch-slot, each user senses the channel, and in case of being sensed as idle then the user starts the Bernoulli-distributed random transmission process. The packet length will be fixed toLtime-slots orpacket-units. This means that the carrier sensing is performedL times across the duration of a transmission. Perfect carrier sensing is assumed in all derivations1. All packet collisions are assumed to yield to the loss of all the transmitted information. However, when-ever a collision-free transmission occurs, then all the inactive (non-contending) terminals and the BS will attempt to decode the signal. If the BS finds the packet as erroneous then it requests its retransmission from another terminal via an ideal feedback channel. This feedback channel has four possible outcomes
′0/1/e/r′ which indicate, respectively, idle slot (′0′),correct transmission (′1′),
collision(′e′), andretransmission request (′r′). If the feedback is′r′then all the
remaining idle terminals with a correct version of the original packet proceed
1 Imperfect carrier-sensing can be regarded as a source of additional collisions in all
Multi-objective and Financial Portfolio Optimization 7
to relay a copy in the next time-slot with probabilitypR. The BS stores all the received copies and uses maximum ratio combining (MRC) with a maximum ofM branches (retransmissions plus the initial transmission) to improve packet reception. Each retransmission is requested if the reception process in previous transmissions has failed. In the illustrative example in Fig.1, the small idle slots illustrate the granularity of carrier-sensing mechanism. The first active epoch is collision-free with terminalj= 1. Note that terminalj= 2 has received also the first transmission of terminalj = 1. However, the BS has not received the signal correctly and proceeds to request retransmission from terminalj = 2 in the next time slot. The second active epoch is also collision-free with terminal j = 5, but since the signal was correctly received by the BS, there is no cooperation. Finally, the third epoch experiences an unresolvable collision between terminals
j = 3 andj= 4.
3
Packet Reception Model
This section has been provided in [9] and [10]. The results are summarized here for convenience and clarity in subsequent analysis. Consider that the instanta-neous post-MRC processing SNR of user j at the BS during the nth time-slot of an epoch is denoted byγj,n. The correct reception probability of a packet of user j during the nth time-slot of an epoch, denoted by qj,n, is given by the probability that the instantaneous SNR exceeds the reception threshold β [9]2:
qj,n= Pr{γj,n> β} (1)
Now consider that the instantaneous SNR of a transmission of userjexperienced at the terminal of userkthat will act as potential relay is denoted byγj(k)(j=k). The correct reception probability of a packet of user j at relay k, denoted by
qj(k), is thus given by:
q(jk)= Pr{γ (k)
j > β},‘ j=k. (2)
Since all channels are Rayleigh distributed, then the SNR values both at the destination and at the potential relays during the first time-slot of an epoch are exponentially distributed. The reception probabilities in (1) and (2) are thus given by the complementary cumulative distribution function (CCDF) of the exponential distribution qj,1 = e−β/γj,1, and q(jk) = e
−β/γ(k)j , where
γj,1 = E[γj,1] = σj2, γ (k)
j = E[γj,k] = σj,k2 , and E[·] is the statistical average operator. Let us now address the modelling of the reception process during the cooperative phases. Since cooperative phases are activated only when the pre-vious phases did not achieve the required SNR threshold, then it is relevant
2 The SNR threshold reception model is commonly used in the literature to incorporate
8 R. Samano-Robles and A. Gameiro
to study the statistics of reception conditional on the events in the preceeding time-slots. The cumulative distribution function ofγj,n conditional on the SNR of previous time slots being belowβ(γj,n−1< β) is given by (see [10] for details): for the analytic formula). Therefore, the reception probability during the nth time slot of an epoch given an incorrect packet reception in the previous n−1 transmissions is given by [10]:
qj,n|tj,n−1=0= 1−Fγj,n|γj,n−1<β(β). (4)
Details of these derivations can be found in [10].
4
Trade-Off Performance Regions
4.1 Throughput Region
Throughput can be defined as the ratio of the average number of correctly receivedpacket-unitsper epoch-slot to the average length of an epoch-slot (E[l]). Considering that collisions yield the loss of all packets involved in the conflict, then a transmission of user j is free of collision with probability pjk=jp¯k, where ¯a= 1−a is the complement to one ofa, for any a(i.e.,¯pj = 1−pj). In addition, consider thatps,j is the correct reception probability of user j given that its transmission is collision-free and that cooperation is used. The through-put is thus given by:
Tj =
Lps,jpjk=jp¯k
E[l] , (5)
where the correct reception probability of userj in absence of collision can be otained by adding the contributions from allM possible cooperative stages:
ps,j =qj,1+
the denominator of (5) can be obtained by considering all contributions of idle and busy epoch-slots: one time slot with probability Jk=1p¯k, at leastL time-slots with probability 1−Jk=1p¯k, and more thanLtime-slots with probability
jpjk=jp¯k weighted byE[lc,j], which denotes the average number of coop-erative retransmissions for userj once a cooperative phase has been activated. The average length of an epoch can thus be written as:
Multi-objective and Financial Portfolio Optimization 9
where E[lc,j] = Mn=2(n−1)qj,n|tj,n−1=0
n−1
m=1q¯j,m|tj,m−1=0. is the summation
of all contributions of theM possible cooperative stages. Let us now define the concept of throughput region. For this purpose, letT= [T1, T2, . . . , TJ]T be the vector of stacked throughput values of all terminals, and p = [p1, p2, . . . , pJ]T the vector of stacked transmission probabilities. The throughput regionCT is the union over all possible realizations of throughput values for all terminals and for all possible transmission policies (0≤pj ≤1) [21]:
CT ={T˜|T˜j=Tj(p),0≤pj≤1}, (8)
which can be simply considered as the region of all achievable values of terminal throughput. The throughput region is the main performance metric used in the analysis of random access protocols in asymmetrical settings [21].
4.2 Sum-Throughput vs. Fairness Region
The sum-throughput can be defined as follows:
T = J
j=1
Tj. (9)
Fairness will be evaluated in this paper by means of the Gini-index, which is commonly used in the area of economics to measure income inequality [25]. The Gini-index can be defined mathematically as follows [25]:
FG= the best fairness scenario where the users have identical statistical performance. A value ofFGequal to one is the worst fairness scenario as only one user overtakes all the resources of the network. For convenience in subsequent analysis, (10) can be rewritten as follows: FG =
J
sum-throughput and fairness. The sum-throughput vs. fairness trade-off region can be defined as the union of all achievable values [T FG] for all possible transmission policies (0≤pj≤1):
10 R. Samano-Robles and A. Gameiro
4.3 Sum-Throughput vs. Transmit Power Region
In this paper, average transmit power will be considered as proportional to the transmit rate of the system plus the potential cooperative retransmissions. Therefore, in our setting, we can define the average consumed power as follows:
P=α
whereαis a proportionality constant. Having defined both sum-throughput and transmit power consumption, let us now define the concept of sum throughput vs. power trade-off region. First, we define the vector P= [T P]T of stacked values of sum-throughput and power. The sum-throughput vs. power trade-off region can be defined as the union of all achievable values [T P] for all possible transmission policies (0≤pj ≤1):
CP ={P˜|T˜=T(p),P˜ =P(p),0≤pj≤1}. (13)
4.4 Return vs. Risk Trade-Off Region
Let us define the instantaneous return per correctly transmitted packet of user
j as rj, and the average return asE[rj] = ˆrj. The instantaneous return of the network per epoch-slot can be thus written as follows:
R= J
j=1
rjtj, (14)
wheretjis the binary random variable that indicates whether a packet transmis-sion was correct or not per epoch-slot. The average return can be thus defined as the ratio of the average return per epoch-slot to the the average length of an epoch-slot:
Let us now calculate the average risk as the ratio of the variance of the instan-taneous return per epoch to the average length of an epoch:
S= E[R return vs. risk trade-off region can be defined as the union of all achievable values [ ˆR S] for all possible transmission policies (0≤pj ≤1) :
Multi-objective and Financial Portfolio Optimization 11
5
Multi-objective Optimization
To obtain the envelope of the trade-off regions, a multi-objective optimization ofI functions Fi is here proposed:
popt= arg max
p [F1, F2 . . . Fi, . . . FI]. (18)
Since this vector optimization usually lacks a unique solution [3], the concept of Pareto optimal trade-off front is commonly employed. A Pareto optimal solution can be loosely defined here as the point that is at least optimum for one or more of the elements of the vector objective function [F1, F2 . . . FI], or in other words when none of the objective functions can be improved in value without degrading some of the other objective values (see [3] for a complete definition). The multi-objective optimization problem can be transformed into a single objective optimization problem using the method of scalarization [3]:
popt= arg max
p
i
µiFi, (19)
where µi is the relative weight given to the ith objective function. Differen-tiating the objective function in (19) we obtain a set of equations given by
iµi∂p∂Fki = 0, k= 1.., J. AssumingJ =I, the solution of a subsetSo ofI of these linear equations independent from the values of the weighting factors µk can be proved, in our context, to be equivalent to setting the following Jacobian determinant to zero [23] [22]:
|Jo|= 0, (20)
where Jo(k, i) = ∂F∂pi
k is the (i, k) entry of the Jacobian matrix Jo, k∈ So. The final solution is given by the union of the solutions for all the possible selections of equationsSo.
5.1 Throughput Region
In the case of the throughput region, the I = J objective functions to be optimized in (19) are the throughput functions of each terminal: Fj = Tj,
j = 1, . . . , J. This means that the elements of the Jacobian determinant in (20) are given byJk,j = ∂T∂pkj. In this case, the number of objective functions is equivalent to the number of variables of the optimization. The final expression is given by (see [9] for details of the derivation):
J
12 R. Samano-Robles and A. Gameiro
5.2 Sum-Throughput vs. Fairness
In the case of the sum-throughput vs. fairness, theI= 2 objective functions to be optimized areF1 =T in (5) andF2 =FG in (10). Therefore, the Jacobian determinant in (20) reduces to:
∂X
In the particular case of two usersJ = 2 the previous expression can be proved to be equivalent to the Jacobian of the throughput region and thus boil down to the solution in (21). Further details are provided in the section of results.
5.3 Sum-Throughput vs. Transmit Power Region
In the case of the sum-throughput vs. power, the I = 2 objective functions to be optimized are F1 = T in (5) and F2 =P in (12). Therefore, the Jacobian determinant in (20) reduces to
This expression can be solved via numerical methods based on steepest gradient descent tools.
5.4 Return vs. Risk
In the case of the return vs. risk trade-off region, theI = 2 objective functions to be optimized areF1=Rin (15) andF2=S in (16). Therefore, the Jacobian determinant in (20) becomes:
This expression can be solved via numerical methods based on steepest gradient descent tools.
6
Results
Multi-objective and Financial Portfolio Optimization 13
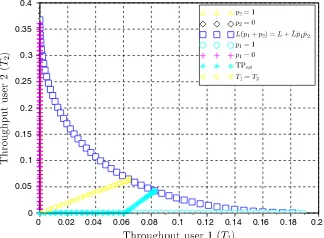
Fig. 2.Throughput region forL= 1 and
M = 1
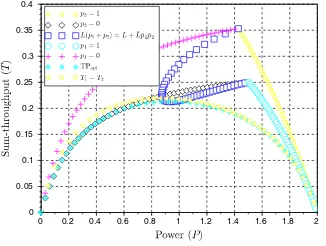
Fig. 3. Sum-throughput (T) vs. fairness (FG) region forL= 1 andM= 1
User-to-user communication is implemented with parameter ˆγ1(2) = ˆγ (1) 2 = 8. The reception threshold is set to β = 1. In terms of financial parameters, we selected ˆr1= 0.8, ˆr2= 0.5,E[r21] = 0.01, andE[r22] = 0.9. While this is a rather arbitrary selection of financial parameters, it is possible to obtain some useful results and conclusions for the general case.
14 R. Samano-Robles and A. Gameiro
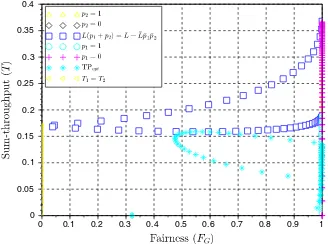
Fig. 6.Throughput region forL= 4 and
M = 1
Fig. 7. Sum-throughput (T) vs. fairness (FG) region forL= 4 andM= 1
in (21) for a two-user system. The projections of the Pareto optimal throughput-power envelope (labelled TPopt) and the equal throughput curve (labelled T1=
T2) are also displayed. The non-convexity of the throughput region means that the trade-off region of sum-throughput and fairness region in Fig. 3 exhibits a rapid decrease of throughput for increasingly improving values of Gini-index (a value of zero indicates the best fairness condition). Note also that the boundary of the fairness region is described by half of the solution that describes the throughput region, which is the half corresponding to the user with best channel conditions. The other half is also displayed inside the region in Fig. 3. The sum-throughput vs. power trade-off region displayed in Fig. 4 shows that the region is defined by boundary conditions and by the Pareto solution in (23), which also describes the minimum sum-throughput curve. Note that the Pareto front of the throughput region labelled asL(p1+p2) =L+ ¯Lp¯1p¯2 is projected as a vertical constant power line that cuts the region into two equal halves. The return vs. risk trade-off region displayed in Fig.5 is defined by boundary conditions with the point of maximum and minimum risk. The curve that defines the Pareto solution for the throughput and fairness region also describes the Pareto solution of the return vs. risk region by joining the points of maximum or minimum return (or risk). The non-convexity of the throughput region makes the return vs. risk region also non-convex, which means it is difficult to achieve high values of return without compromising risk and also fairness.
Multi-objective and Financial Portfolio Optimization 15
Fig. 8.Throughput region forL= 1 and
M = 4
Fig. 9. Sum-throughput (T) vs. fairness (FG) forL= 1 andM = 4
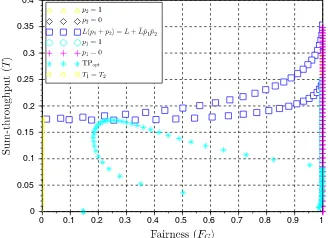
Fig. 10. Throughput region for L = 4 andM = 4
Fig. 11. Sum-throughput (T) vs. fair-ness (FG) region forL= 4 andM = 4
16 R. Samano-Robles and A. Gameiro
improvements on the operation of the protocol under different networking cir-cumstances: carrier sensing improves the avoidance of collisions, while coopera-tion improves the effective recepcoopera-tion capabilities of the system. This improvement on the convexity of the region can be also observed in a reduction of the steep-ness of the fairsteep-ness Pareto curve in Fig. 9, which means that an improvement on fairness (reduction of Gini index) is not accompanied by a considerable decline of aggregate throughput.
Multi-objective and Financial Portfolio Optimization 17
7
Conclusions
This paper has presented the MAC-PHY cross-layer design of a class of carrier-sense multiple access protocol where users with good channel states can cooper-ate with users with bad channel stcooper-ates by relaying a copy of collision-free signals. Different types of trade-off region were here analysed by means of multi-objective and financial convex optimization tools. It was confirmed that cooperation pro-vides an improvement of the reception capabilities of the system, particularly for users with bad channels states which benefit from users with better channel states relaying their signals towards the base station, where they were conve-niently combined. This improved reception was translated in an increase of the throughput region, reduced steepness of the Pareto curve of sum-throughput vs. fairness and a better trade-off between return and risk in the network. In terms of power consumption, cooperation provides a considerable increase but in combination with carrier sensing was proved to yield a good compromise between network performance and consume power. Carrier-sensing was proved to reduce the non-convexity of the throughput region particularly when both users contend for the channel, which is also translated in a better trade-off between sum-throughput and fairness. In combination with cooperative diversity, carrier-sensing provides a considerable increase also in terms of the throughput region of the algorithm. Future work includes the use of multi-objective and financial optimization tools in the analysis of more complex random access schemes.
Acknowledgments. The research leading to these results has received funding from the ARTEMIS Joint Undertaking under grant agreement no. 621353, the Portuguese National Science Foundation FCT, and by the North Portugal Regional Operational Programme (ON.2 O Novo Norte), under the National Strategic Reference Framework (NSRF), through the European Regional Development Fund (ERDF), and by FCT, within project ref. NORTE-07-0124-FEDER-000063 (BEST-CASE, New Frontiers).
References
1. Srivastaya, V., Montani, M.: Cross-layer design: a survey and the road ahead. IEEE Commun. Ma.43(12), 112–119 (2005)
2. Samano-Robles, R., Gameiro, A.: Network and Economic Trade-off Performance Regions of Cognitive Radio Systems with Transmit Power Control. Applied Math-ematics and Information Science7(5), 1755–1766 (2013)
3. Boyd, S., Vandenberghe, L.: Convex optimization. Cambridge University Press (2004)
4. Chen, W., Dai, L., Letaief, K.B., Cao, Z.: A unified cross-layer framework for resource allocation in cooperative networks. IEEE Transactions on Wireless Com-mun.7(8), 3000–3012 (2008)
18 R. Samano-Robles and A. Gameiro
6. Liu, P., Tao, Z., Lin, Z., Erkip, E., Panwar, S.: Cooperative wireless communi-cations: a cross-layer approach. IEEE Wireless Communications Magazine13(4), 84–92 (2006)
7. Scaglione, A., Goeckel, D.L., Laneman, J.N.: Cooperative communications in mobile ad hoc networks. IEEE Signal Processing Magazine23(5), 18–29 (2006) 8. Choi, W., Andrews, J.G.: Downlink performance and capacity of distributed antenna
systems in a multicell environment. IEEE Transactions on Wireless Communications 6(1), 69–73 (2007)
9. Samano-Robles, R., Gameiro, A.: Throughput, Stability, and Fairness of Carrier Sense Multiple Access with Cooperative Diversity. International Journal of Com-munications3, 21–31.http://www.seipub.org/ijc/Download.aspx?ID=9051
10. Samano-Robles, R., Gameiro, A.: A packet reception model for cooperative diver-sity in wireless multi-cell networks. In: International Conference on Consumer Elec-tronics, Berlin, Germany, September 2011
11. Smura, T.: Techno-economic modelling of wireless network and industry architec-tures, Doctoral dissertation. Aalto University (2012)
12. Niyato, D., Hossain, E.: Spectrum trading in cognitive radio networks: A market-equilibrium-based approach. IEEE Wireless Communications15, 71–80 (2008) 13. Southwell, R., Chen, X., Huang, J.: Quality of service satisfaction games for
spec-trum sharing. In: IEEE INFOCOM - Mini Conference, Turin, Italy (2013) 14. Chen, X., Huang, J.: Spatial spectrum access game: nash equilibria and distributed
learning. In: ACM Mobihoc, Hilton Head Island, South Carolina (2012)
15. Duan, L., Huang, J., Shou, B.: Duopoly Competition in Dynamic Spectrum Leasing and Pricing. IEEE Transactions on Mobile Computing11, 1706–1719 (2012) 16. Tekin, C., et al.: Atomic Congestion Games on Graphs and Their Applications in
Networking. IEEE Transactions on Networking20, 1541–1552 (2012)
17. Duan, L., Huang, J., Shou, B.: Investment and Pricing with Spectrum Uncertainty: A Cognitive Operators Perspective. IEEE Transactions on Mobile Computing10, 1590–1604 (2011)
18. Zhang, Y., Niyato, D., Wang, P., Hossain, E.: Auction-based resource allocation in cognitive radio systems. IEEE Communications Magazine 50, 108–120 (2008) 19. Huang, J., Berry, R., Honig, M.L.: Auction-based Spectrum Sharing. Springer
Jour-nal Mobile Networks and Applications11, 405–408 (2006)
20. Wysocki, T.A., Jamalipour, A.: An Economic Welfare Preserving Framework for Spot Pricing and Hedging of Spectrum Rights for Cognitive Radio. IEEE Trans-actions on Network and Service Management9, 87–99 (2012)
21. Luo, J., Ephremides, A.: On the throughput, capacity, and stability regions of random multiple access. IEEE Transactions on Information Theory 52(6), 2593–2607 (2006)
22. Samano-Robles, R., Ghogho, M., McLernon, D.C.: Wireless Networks with retrans-mission diversity and carrier sense multiple access. IEEE Transactions on Signal Processing57(9), 3722–3726 (2009)
23. Abramson, N.: The throughput of packet broadcasting channels. IEEE Transac-tions on CommunicaTransac-tions25(1), 117–128 (1977)
24. Tobagi, F., Kleinrock, L.: Packet switching in radio channels: part IV-stability con-siderations and dynamic control in carrier sense multiple access. IEEE Transactions on Communications25(10), 1103–1119 (1977)
A Centralized Mechanism to Make Predictions
Based on Data from Multiple WSNs
Gabriel Martins Dias(B), Simon Oechsner, and Boris Bellalta
Department of Information and Communication Technologies, Pompeu Fabra University, Barcelona, Spain
Abstract. In this work, we present a method that exploits a scenario with inter-Wireless Sensor Networks (WSNs) information exchange by making predictions and adapting the workload of a WSN according to their outcomes. We show the feasibility of an approach that intelligently utilizes information produced by other WSNs that may or not belong to the same administrative domain. To illustrate how the predictions using data from external WSNs can be utilized, a specific use-case is considered, where the operation of a WSN measuring relative humidity is optimized using the data obtained from a WSN measuring temperature. Based on a dedicated performance score, the simulation results show that this new approach can find the optimal operating point associated to the trade-off between energy consumption and quality of measurements. Moreover, we outline the additional challenges that need to be overcome, and draw conclusions to guide the future work in this field.
1
Introduction
Nowadays, forests, cities and houses, among others, are monitored by multiple Wireless Sensor Networks (WSNs) that may belong to different organizations, both public and private, as well as to individual citizens. In addition, there is a high heterogeneity regarding the technologies, protocols and standards used in WSNs. In this situation, each WSN usually operates completely independent of other WSNs, even if they are covering the same physical area, and is thus not able to take any advantage of the presence of those other WSNs to enrich its collected data nor to optimize its operation.
However, WSN performance can be improved by combining data generated from different sensors, belonging to the same node, other nodes from the same network or from other WSNs. This data sharing allows each WSN to build a deeper knowledge about its surroundings, may reduce the probability of getting wrong values and taking wrong decisions, and encompasses wider areas and different perspectives of the same environment.
In an era of high availability of data from the cloud, we are interested in using data from other WSNs to reduce the energy consumption and improve the quality of the measurements done by a target WSN. The external information will be used to make predictions and change the operation of the nodes and
c
Springer International Publishing Switzerland 2015
20 G.M. Dias et al.
save energy when the environmental conditions do not indicate that big changes will happen in the near future. For example, relative humidity and temperature values usually have a high correlation, and the former may have a higher variation if the latter is changing.
This paper lists some of the existing alternatives for collaboration and predic-tion in WSNs and develops further the inter-WSNs informapredic-tion exchange concept introduced in [1] and in [2]. The main idea behind the inter-WSN information exchange is that the data gathered by other WSNs can be exchanged via their sinks and used to improve the operation of the target one, and vice versa. Our main contribution is a mechanism that uses the data from collaborating WSNs to make predictions. In order to validate our idea, we show how the WSNs evolve using this kind of collaboration, define a way to scale the quality of the measure-ments and the WSNs’ performance, and finally present some simulation results from a chosen scenario consisting of two WSNs, one for monitoring the relative humidity and another for the temperature. Based on the presented results, we show how energy-efficient and accurate it can be.
The paper is organized in the following sections: In Section2, we describe related works about collaboration between WSNs, the use of data from exter-nal sensors and predictions in WSN environments; the details of our proposed mechanism are explained in Section 3; the use case considered for the tests is detailed in Section 4; the simulation results and the evaluation of the approach are explained in Section5 and; at the end, our conclusions and ideas for future work are shown in Section6.
2
Related Work
A system that combines the action of individual components may produce better results than the individual components acting separately. Supported by this premisse, several collaboration mechanisms in WSNs have been developed. Most of the approaches explore the collaboration between sensor nodes of the same WSN. In contrast to them, we extend the concept of collaboration to an upper layer and build the information exchange between different WSNs, without losing any other possible collaboration from the other levels.
An inter-domain routing protocol is described in [3], where it is shown that the gateways may share information about their nodes and take advantage of being physically close to each other. This information can be used to transmit packets through nodes of the other WSNs and can be done either to share the information or for routing purposes. Even though the idea of our work is to create a link between nodes from different WSNs, it is neither meant to share resources nor information between wireless sensor nodes, but the knowledge that the network is able to produce based on collected data.
A Centralized Mechanism to Make Predictions 21
track objects from a distance. The goal of the described approach is to enable a robot to use the data retrieved by a WSN that detects the presence of objects inside the monitored area. After receiving the information from the WSN, the robot interprets the position of the object and moves itself to its location in order to get more details about the real situation. Their approach is different from ours mainly because it uses a non-generic solution that is highly coupled to the presented scenario without a WSN as the beneficiary of the collected infor-mation, besides not making any prediction with the information received from the others.
Besides the works that encourage the collaboration among WSNs, some authors applied predictions in order to reduce the energy consumption in the WSNs and extend their lifetime. In [5], the authors developed an algorithm for WSN applications that require a continuous delivery of sensor measurements, such as temperature and traffic monitoring. In order to build sets of nodes that provide trustful measurements, it considers that a sensor measurement is pre-dictable if the predicted value (on average) differs on less than a (user) defined threshold when using other nodes’ measurements. After defining which sensors can be predicted by which other, the base station must find a set of subsets of active nodes such that a different prediction subset is used at each time, and such that all sensors are queried at least once during a cycle. After building this set, the base station must activate a subset of nodes at a time. In other words, only the sensor nodes from the active subset are activated during a time interval and all the others have their radios and sensors turned off in order to save energy and extend the WSN lifetime. Simulations using real data show that such app-roach can successfully achieve its goals depending on the user requirements and on the quality of the data. Similarly, our mechanism also assumes the task of selecting which sensors are going to be active in the next time interval. However, our mechanism is able to react to environmental changes, while their work is less dynamic. That is, once the sets of sensors are defined, they will be interleaved independently of changes that may happen around the WSN. We highlight that it may be possible to improve our mechanism by adopting their techniques to build the groups of sensors in a way that there is no reduction in the quality of the measurements and the energy savings are maximized.
22 G.M. Dias et al.
chosen threshold, it assumes that such value satisfies the system requirements. Oth-erwise, it calculates the energy consumed to retrieve new measurements consider-ing the costs to activate the correspondconsider-ing sensor and, finally, builds a query that will require the lowest energy consumption for the WSN and will give at least the minimum level of confidence set by the user. Similarly to our mechanism, it exploits the correlation between different types of data that the sensor nodes may be able to measure, for example, their own voltage and the local temperature. The difference from our work is that they do not provide a method to measure the quality of the measurements and the performance of the system.
3
Proposed Mechanism
Our system architecture is ready to use information from external WSNs, as described in [1] and [7]. To achieve the goal of optimizing the performance of the WSNs, they must be interconnected through their respective Enhanced Gate-ways (EGs). We explain the details of the mechanism in the following.
3.1 Centralized Decisions
Periodically, the data retrieved by the nodes are transmitted to the sink. After receiving all the measurements, the sink computes the received values before reporting them to the EG, which may forward them to external WSNs. In par-allel, the EG may also receive information from external WSNs and, up to this point, all the data are collected and stored for further analysis. In intervals, the EG uses the collected data to predict if there will be changes in the near future. Figure1 describes the possible states of a WSN.
The predictions done by the EG can have two different outcomes:positive, when changes in the environment are expected; and negative, otherwise. If an EG receives information from internal and external sources, each prediction may be based on a different data type and independent for each metric. In such cases, they can be combined in order to produce only one outcome. The outcomes can be compared with the real observations in order to verify the performance of the predictions. The feedback can be incorporated by the EGs in order to improve their future decisions.
3.2 Applications
A Centralized Mechanism to Make Predictions 23
Fig. 1. Different states of a WSNs using inter-WSN information exchange
Adaptive Sensor Nodes Selection. This application reduces the energy con-sumption of the network by deactivating some nodes during a certain period of time. In other words, when a node is deactivated, it does not make any mea-surement, but it may forward messages exchanged by their neighbors. We recall that the sets of active nodes can follow the guidelines described in [5], so the energy savings can be maximized without compromising the quality of the mea-surements.
Adaptive Sampling. Differently from the other application, this solution does not change the number of active nodes. However, when the EG has a positive outcome and changes are expected in the environment, the nodes should reduce the time between two consecutive measurement transmissions, consuming more energy and producing more information about the environment. Otherwise, the energy can be saved, because it is not expected big changes in the environment.
3.3 Quality of Measurements (QoM)
As explained before, one of the goals of this mechanism is to reduce the energy consumed in a WSN without reducing the QoM (i.e., a parameter that evaluates if the gathered information from the environment during a certain period is enough to accurately represent it). However, the level of the QoM depends on the type of information reported by the nodes.
24 G.M. Dias et al.
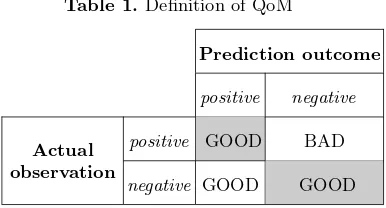
QoM, the intervals with a negative observation can be covered by less reports without compromising the quality, thereby saving energy. Periods with anegative observation that are wrongly predicted mean that the system expected to have apositive observation in them, produced more measurements and, thus, wasted energy. Differently from the states that a positive is observed and the WSN produced a low number of measurements, those periods still have agood QoM, but the energy consumption might have been reduced and the WSN lifetime increased.
Table 1.Definition of QoM
Prediction outcome
positive negative
Actual observation
positive GOOD BAD
negative GOOD GOOD
Based on this, the accuracy was defined as the percentage of intervals in a day in which the system was operating in a highlighted state. Moreover, the accuracy of positives is the percentage of intervals with positives covered by a high number of measurements.
Regarding the system operation, during intervals in which variations are pre-dicted and the predictions havepositiveoutcomes, the EG updates the operation of its WSN in order to collect more information. Each update on its opera-tion affects either the number of active nodes or the time interval between two measurements done by the sensors. As a consequence of this, the number of measurements, the number of transmissions and the energy consumption have higher values during these periods of time, while the opposite effect occurs when no variation is predicted.
3.4 Performance Score
In order to evaluate how efficient the use of external information can be, we developed a way to compare the approaches. For a given scenario, we calculate the lowest energy consumption that the WSN may have (Emin), which can be done by always setting the plan that produces less measurements during a day. On the other hand, we measure how much energy is consumed by the WSN when it produces the maximum number of measurements during the same time interval (Emax). Thus, the percentage of energy saved by an approach (Eps) is derived from the energy consumed (Econsumed) by the relation:
Eps=
Emax−Econsumed
Emax−Emin
(1)
A Centralized Mechanism to Make Predictions 25
is implicitly inserted in the value ofEpsand should not be considered again in the final equation. Considering this, the trade-off between the QoM and the energy consumption can be calculated if we use only the percentage of predictions of positive outcomes(Phigh∆) that the system could successfully do:
Phigh∆ =
# of positives correctly predicted
# of observed positives (2)
Finally, the Performance score (p) is defined as the product between the percentage of saved energy and the percentage of positives correctly predicted, which quantifies how much the system actually consumes to have such level of accuracy. If interpreted as a dot product between two vectors, the highest value represents the system having the highest possible energy savings and the highest possible accuracyhigh∆s:
p(α)=Epsα·Phigh∆(1−α) (3)
where 0 ≤α ≤1 is the exponent that represents the system’s priority on the energy saved over its accuracy. For example, ifα <0.5, the energy savings will have a bigger impact at the performance score. Obviously, ifα= 0.5, the system will not prioritize any of them.
4
Use Case
To create a realistic use case, we used the temperature and relative humidity of 16 days measured by three different nodes in the experiments done in [5]. The simulated use case is based on a real scenario from where the data was fetched: an office with two WSNs deployed close to each other. There, nodes are positioned in a grid topology with two different WSNs: Network A monitoring temperature and Network B monitoring relative humidity.
Network Ahas one node that retrieves data from the environment, and a sink node that receives the temperature values and transmits them to the respective EG (EGA), which forwards everything to EGB. On the other side, Network B was composed by 26 nodes that monitor the relative humidity plus a sink connected to EGB, which is responsible for averaging the values received after each measurement. Based on the data received from EGA and on the stored averages, EGBis able to set different WSN operation plans, and to communicate the required changes to its sink node in order to forward them to the wireless sensor nodes.
26 G.M. Dias et al.
more energy. Therefore, the latter is only used when the prediction produce positive outcomes and the environment is expected to change.
Adaptive Sampling. When the prediction outcome is a positiveand changes are expected inNetwork B, nodes take measurements and transmit them every 30 seconds, consuming more energy and producing more information about the environment. Otherwise, this is done every 180 seconds.
4.1 Constant Predictions
At runtime,Network Bdefines how its nodes will react to environmental changes based on the predictions done: reporting more information when the environ-ment is supposed to undergo variations and saving energy otherwise. In order to predict these variations, we calculated the average of the temperature and relative humidity values, without mixing data types, in discrete and sequential 5-minute window intervals. The absolute difference between the averages of two consecutive intervals is denoted∆. In order to identify the data types, we used subscripts:∆Tfor temperature values and∆RH for relative humidity values. We have assumed that a large difference between the averages represent significant changes in the environment. Therefore, the system goal is to predict whether the next∆ will be over a determined threshold,τ, or not. To achieve that, we used a constant na¨ıve model to make the predictions, i.e., in case of ∆ > τ, we label it ashigh∆, representing apositive outcome; otherwise, we call it alow∆.
In some cases, it may be useful to know if ahigh∆means that the average is increasing or decreasing. In order to identify it, we added an additional notation to ∆. If the most recent average computed differs more than τ and is greater than the penultimate one, we mark it ashigh∆+; if it differs more than τbut is lower, we use high∆-, as shown in Figure2. In case of having alow∆, there is no need for highlighting if the value is greater or less than the penultimate one. Predictions are independent for each metric. Furthermore, any prediction is composed by three factors: the last two symptoms and the last prediction. The general idea is to try to learn the trend and avoid wrong predictions provoked by
(a) The concept of
low∆
(b) Another case oflow∆
(c) The concept of
high∆+
(d) The concept of
high∆
A Centralized Mechanism to Make Predictions 27
Table 2.How the system reacts to the symptoms
Last Symptoms Last Prediction Prediction
low∆ low∆ any low∆
high∆+ high∆+ any high∆+
high∆- high∆- any high∆
-high∆+ any high∆+ high∆+
high∆- any high∆- high∆
-low∆ any low∆ low∆
high∆+ high∆- low∆ low∆
high∆+ low∆ high∆- low∆
high∆- low∆ high∆+ low∆
noise and outliers. Thus, every time that two factors agree in one direction, the prediction is that, in the next interval, the environment will follow it. Otherwise, if the three factors are different, the prediction is that the environment will not undergo variations in the near future. Table2shows how we did the predictions using∆s.
Finally, if a EG receives information from internal and external sources, each prediction may be based on a different data type. In this case, it combines them in the simplest way: if one of the predictions is labeled ashigh∆, the final prediction is ahigh∆; otherwise, it is a low∆.
Adaptive Threshold. The value ofτis set based on the proportion of∆s seen in the historical data. For example, if the goal is to predict the highest quarter of ∆s in a day, the threshold will be set at the 75th percentile of ∆s. In this case, we identify it with the number 75 subscripted:τ75.
Symptoms. To make those predictions, we must observe the measurements and find symptoms. A symptom,σ, is defined as a value where a∆ > σrepresents a high probability of having∆ > τin the next interval. Therefore, if we notice that the most recent∆is greater thanσ, we have a symptom ofhigh∆; otherwise, it is a symptom oflow∆. Even though the concepts ofσandτare similar, the numerical values may be different. For example, after observing the historical data, we might notice that every∆ > τ40calculated at timetwas followed by a∆ > τ75at time
t+ 1. So, we would set the value ofσat the 40th percentile of∆s.
5
Evaluation
28 G.M. Dias et al.
done by a node in a day was considered one day’s worth of data. Therefore, we had enough data to simulate 48 different days. To check the feasibility of using this solution in the presented scenario, we evaluated the energy consumption in OMNeT++ [8] and the calculations about the performance score in Matlab. First, using OMNeT++ and MiXiM [9], we simulated the energy consumption based on TelosB nodes [10] using BMAC [11] as MAC protocol and a flood-ing routflood-ing protocol. In these simulations, the sensor nodes received new plans from the EG every 5 minutes, as explained in Section 3.2. We calculated the average energy consumption on each plan, considering also the energy spent to disseminate the plan changes through the network.
In Matlab, the data from the sensors were split into a training and a valida-tion datasets to avoid overfitting. Each of these datasets was defined by a set of 24 days that were randomly selected on each run (repeated random sub-sampling validation). The model was fit to the training data, and predictive accuracy was assessed using the validation data. The tests were done over 10 different combi-nations of days and the final results were averaged over the splits. In the end, we checked how the system behaved when the plan ofNetwork B was selected using only internal information (relative humidity values), only external information (temperature values) and combining both, and used the energy consumption levels to plot the results.
5.1 Training Dataset
After selecting 24 days for the training dataset, the measured values were used to set three different parameters:
– The value ofτ– The threshold that the EGs must set. It was calculated as explained in4.1, based on the measurements done during the training days. – The values ofσs– The system built a table with the values ofpbased on percentiles, as shown in Figure3d. The numerical value ofσT andσRH was
the same as the percentiles of∆T and∆RH with the highest value ofp.
A Centralized Mechanism to Make Predictions 29
(a) Energy saved (Eps)
(b) Accuracy of the predictions
(c) Accuracy of
high∆s (Phigh∆)
(d)p(0.5)
Fig. 3.Parameters obtained using the training data
5.2 Validating Dataset
The other 24 days were considered part of the validating dataset and their data were used to validate whether the system had chosen well and whether our hypothesis was valid. For this, the system used all the parameters calculated in the last step to calculate p.
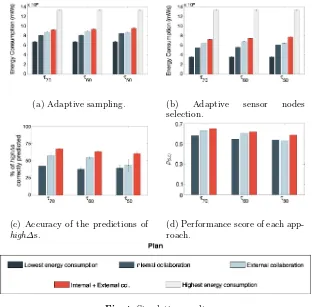
5.3 Results
The plots in Figure 4 show the obtained results, where it is possible to see how much our solution was able to exploit the trade-off between the energy consumption and the quality of the measurements. To show better its benefits, we included two baseline scenarios that did not use collaboration: the first one saved the maximum energy possible by transmitting less measurements; the second did not save energy and always used the plan that transmits more measurements. An important remark is that both scenarios have p(α) = 0 for any α, because either they did not save any energy (the highest consumption plan case) or their accuracy of detectinghigh∆s was zero (the lowest consumption plan case).
The results are split into three groups, according to the τ set for each case (τ70,τ60andτ50). Each bar represents an average for the 24 days of the validation dataset. Observing the data, we can see that the correlation between temperature and relative humidity values is closer to−1 when we consider only the highest
∆s, i.e.,τ70. Therefore, we assume that there are other factors that may influence the small variations in the relative humidity, such as the presence of persons close to the sensors. This explains why the percentage of high∆s correctly predicted is lower when the system tries to track a higher number of changes (τ50).
30 G.M. Dias et al.
(a) Adaptive sampling. (b) Adaptive sensor nodes selection.
(c) Accuracy of the predictions of
high∆s.
(d) Performance score of each app-roach.
Fig. 4. Simulation results
the accuracy levels. For example, with τ60, using the combination of internal and external information, the system was able to correctly predict 67.9% more high∆s consuming only 33.5% more energy. This means that the energy was used more intelligently in the second case.
Figure4dshows that our approach for inter-WSN information exchange out-performs the other types of collaboration that use less information and spend their energy less efficiently. In summary, the trade-off between energy consump-tion and QoM was achieved and found to produce more effective results than the other approaches.
6
Conclusion and Future Work
A Centralized Mechanism to Make Predictions 31
changes in relative humidity, but the opposite was not necessarily true. There-fore, it would be more complex to make good predictions if we tried to predict temperature changes based on relative humidity values.
Although we made use of real data from existing experiments, we did generic calculations and assumptions that can be extended to numerous scenarios, in order to prove the general idea of this concept. We expect that specific knowledge about different scenarios may lead to better results. For example, as shown in [12], when the relative humidity is over 50%, it is possible to calculate its value based on information about the temperature only. Thus, in a scenario similar to ours, the system could save even more energy by letting the EG calculate the local data based on external information.
The next steps include adapt this solution to an autonomic system, as described in [2]. That is, a more generic mechanism which is able to work with other WSN types and is able to work with other prediction methods that may have better performance in different scenarios. Additionally, the idea of an auto-nomic solution involves a pro-active and self-managing system, which improves the information fusion and the decision optimization, besides creating specific plans for the WSNs according to the predictions about the near future.
Acknowledgement. This work has been partially supported by the Spanish Govern-ment through the project TEC2012-32354 (Plan Nacional I+D), by the Catalan Gov-ernment through the project SGR2009#00617 and by the European Union through the project FP7-SME-2013-605073-ENTOMATIC.
References
1. Pal, S., Oechsner, S., Bellalta, B., Oliver, M.: Performance optimization of mul-tiple interconnected heterogeneous sensor networks via collaborative information sharing. Journal of Ambient Intelligence and Smart Environments5(4), 403–413 (2013)
2. Dias, G.M.: Performance optimization of wsns using external information. In: 2013 IEEE 14th International Symposium and Workshops on a World of Wire-less, Mobile and Multimedia Networks (WoWMoM), pp. 1–2 (2013)
3. Dressler, F., Awad, A., Gerla, M.: Inter-domain routing and data replication in virtual coordinate based networks. In: 2010 IEEE International Conference on Communications, pp. 1–5. IEEE, May 2010
4. Parker, L.E.: Detecting and monitoring time-related abnormal events using a wire-less sensor network and mobile robot. In: 2008 IEEE/RSJ International Conference on Intelligent Robots and Systems, pp. 3292–3298. IEEE, September 2008 5. Yann-Ael, L.B., Bontempi, G.: Round robin cycle for predictions in wireless sensor
networks. In: 2005 International Conference on Intelligent Sensors, Sensor Net-works and Information Processing, pp. 253–258. IEEE (2005)
6. Deshpande, A., Guestrin, C., Madden, S.R., Hellerstein, J.M., Hong, W.: Model-driven data acquisition in sensor networks. In: Proceedings of the Thirtieth Inter-national Conference on Very Large Data Bases, vol. 30, pp. 588–599 (2004) 7. Oechsner, S., Bellalta, B., Dimitrova, D., Hossfeld, T.: Visions and challenges for
32 G.M. Dias et al.
8. Varga, A.: The OMNeT++ discrete event simulation system. In: Proceedings of the European Simulation Multiconference (ESM 2001), vol. 9 (2001)
9. K¨opke, A., Swigulski, M., Wessel, K., Willkomm, D., Parker, T.E.V., Kleinhaneveld, P.T., Visser, O.W, Lichte, H.S., Valentin, S.: Simulating Wireless and Mobile Net-works in OMNeT ++ The MiXiM Vision
10. Inc., Crossbow Technology. TelosB Mote Platform. Rev B
11. Fakih, K., Diouris, J.-F., Andrieux, G.: BMAC: beamformed MAC protocol with channel tracker in MANET using smart antennas. In: 2006 European Conference on Wireless Technologies, vol. 2, pp. 185–188. IEEE, September 2006
A Study of Energy Efficiency Techniques
Using DRX for Handover Management
in LTE-A Networks
Tanu Goyal(B) and Sakshi Kaushal(B)
Computer Science and Engineerig, UIET, Panjab University, Chandigarh, India
[email protected], [email protected]
Abstract. For Internet access, smart phones and tablets have started replacing traditional computers. This change got encouraged with tech-nological development like high-resolution screens, powerful processes and compact, long-lasting batteries. With numerous wireless technolo-gies like Global Positioning System (GPS), Cellular and Wi-Fi etc., the mobile device is always connected to network and ready to perform tasks using various applications. The video conferencing and background appli-cation like messaging need higher throughput and need to be on network always, which results into regular battery consumption. So, with the recent increase of mobile data usage and the emergence of new appli-cations, such as multimedia online gaming, mobile TV, Web 2.0, and streaming contents, have motivated the development of Long Term Evo-lution (LTE) and Long Term EvoEvo-lution (LTE)-Advanced (A) technolo-gies. In LTE, Discontinuous Reception (DRX) feature focused on the objective to make User Equipment (UE) energy efficient by saving bat-tery. In this paper, we have explored and analyzed various methods in which DRX technique is used in LTE-A. We have also attempted to iden-tify the role and impact of DRX on handover in LTE-A along with some directions future work.
Keywords: LTE-A
·
Handover·
DRX·
Power saving·
Delay·
Multimedia1
Introduction
The latest discovery in networking has developed a new trend in the mobile mar-ket. This mobile market has created a new variety of smart devices, e.g., smart phones, tablets, windows etc. and replacing traditional computers. This changes got encouraged with technological development like high resolution screens, pow-erful processes and compact long lasting batteries with numerous wireless tech-nology like GPS, cellular communication, Wi-Fi etc. The mobile device is always connected to the network and ready to perform tasks using various applications for multimedia traffics like video streaming, video conferencing and background applications like messaging need higher throughput and need to always on net-work always. The Third Generation (3G) does not have ability to provide services
c
Springer International Publishing Switzerland 2015