Depressed Adolescents as Detected by In Vivo Proton
Magnetic Resonance Spectroscopy
Ronald J. Steingard, Deborah A. Yurgelun-Todd, John Hennen, JoEllyn C. Moore,
Constance M. Moore, Khashayar Vakili, Ashley D. Young, Alain Katic,
William R. Beardslee, and Perry F. Renshaw
Background: The frontal lobe has been implicated in the pathology of depression in adults. Through the use of magnetic resonance spectroscopy, altered brain choline levels have also been linked to the pathophysiology of affective disorders.
Methods: To identify possible alterations in orbitofrontal cortex levels of cytosolic choline in adolescents with and without depression, 22 depressed and 43 control adoles-cents were recruited. Of those recruited, usable proton magnetic resonance spectra were acquired from a voxel in the left anterior medial frontal lobe of 17 depressed (mean age 15.8 6 1.6) and 28 healthy adolescents (mean age 14.5 61.7).
Results: Orbitofrontal cytosolic choline/creatine (Cho/ Cr) ratios (p 5 .032) and cytosolic choline/N-acetyl aspartate (Cho/NAA) ratios (p5.043) were significantly higher in the depressed subjects than in the control subjects. There were no significant differences between depressed and control subjects in gray or white matter content within the voxel.
Conclusions: These findings suggest that brain cytosolic choline may be increased in depressed adolescents in comparison with control subjects and independent of a corresponding structural change. These results are con-sistent with similar, previously reported findings in adults and suggest that depression in adolescents is associated with alterations in orbitofrontal metabolism. Biol
Psy-chiatry 2000;48:1053–1061 © 2000 Society of Biological
Psychiatry
Key Words: Choline, depressive disorder, adolescents, MRS, MRI, frontal lobe
Introduction
N
umerous studies have implicated the frontal lobe of the brain in the pathology of depression in adults (Coffey et al 1993). Structurally, magnetic resonance imaging (MRI) studies have shown that the frontal lobe volume in depressed adult subjects is decreased relative to control subjects, particularly in the left hemisphere (Bo-wen et al 1989; Dougherty and Rauch 1997; Kumar et al 1997). This finding has been extended to depressed adolescents (Steingard et al 1996). A recent study by Rajkowska et al (1999) has also reported abnormalities in both the density and size of neurons and glial cells in the orbitofrontal cortex in postmortem tissue from patients with major depressive syndromes compared to the values obtained from control subjects. Additionally, cerebral and cerebellar gray matter volume has been found to be inversely correlated with depressive symptoms (Pillay et al 1997).Functionally, single proton emission computed tomog-raphy (SPECT) and positron emission tomogtomog-raphy (PET) studies have shown that blood flow and metabolism are decreased in the prefrontal cortex in depressed patients (Dougherty and Rauch 1997; Drevets et al 1998; Galynker et al 1998; Kennedy et al 1997). There are conflicting reports of metabolism and blood flow changes in the prefrontal cortex after antidepressant therapy (medication, electroconvulsive therapy). Five out of nine studies showed an increase after treatment, two out of nine studies showed a decrease, and two out of nine studies showed no change (Dougherty and Rauch 1997; Drevets 1998; Kennedy et al 1997; Rogers et al 1998).
Recent proton magnetic resonance spectroscopy (MRS) studies have also linked altered brain choline levels to the pathophysiology of depression and affective disorders, although these findings have varied based on the brain area of study and diagnosis of the subjects involved. Proton MR spectra contain a strong resonance at 3.2 ppm that arises principally from glycerophosphocholine and
From the Consolidated Department of Psychiatry, Harvard Medical School, Boston (RJS, DAY-T, JH, JCM, CMM, AK, WRB, PFR), The Cambridge Hospital, Cambridge Health Alliance, Cambridge (RJS, JCM, AK), Children’s Hospital, Boston (WRB), and Brain Imaging Center, McLean Hospital, Belmont (DAY-T, JH, CMM, KV, ADY, PRF), Massachusetts.
Address reprint requests to Ronald J. Steingard, M.D., Cambridge Hospital, Dept. of Psychiatry, 1493 Cambridge St., Cambridge MA 02139.
Received January 20, 2000; revised May 9, 2000; accepted May 19, 2000.
phosphocholine (Barker et al 1994; Miller et al 1996). The intensity of this cytosolic choline resonance is often reported as a ratio to the intensity of the creatine resonance at 3.0 ppm, the N-acetyl aspartate resonance at 2.0 ppm, or the unsuppressed water resonance at 4.7 ppm. In a study of 44 cm3voxels centered on the anterior cingulate cortex, Moore et al (in press) found that depression ratings in bipolar patients correlated positively with choline/creatine (Cho/Cr) ratios. They also found that use of antidepres-sants in bipolar subjects was associated with lower Cho/Cr ratios. Charles et al (1994) found that Cho/Cr levels in a 27 cm3 voxel located in the area of the basal ganglia and
thalamus were higher in depressed subjects compared to age-matched control subjects and that the choline levels decreased after the depressed subjects received therapeutic intervention. In another study of the basal ganglia, Ha-makawa et al (1998) found that in bipolar subjects in a depressive state, both the absolute value of choline-containing compounds and the Cho/Cr ratio were signifi-cantly higher compared to control subjects. On the other hand, Ende et al (1997) noted that hippocampal choline resonance in depressed subjects increased after electrocon-vulsive therapy. Also, Renshaw et al (1997) found that in an 8 cm3voxel centered on the left caudate and putamen, the Cho/Cr ratio was lower in depressed adults, as com-pared to control subjects. Although not entirely consistent, these studies suggest significantly altered levels of cyto-solic choline in depressed patients compared to control subjects.
Children and adolescents have been largely overlooked in studies of the frontal lobe and depression (Steingard 2000, in press). In particular, there are no published reports using MRS methods to investigate cytosolic cho-line in depressed children and adolescents. Yet the study of children and adolescents is necessary in order to determine whether anomalies in depressed subjects are the consequence of altered development over the life span, or if they are present even early in development, representing a potential risk factor for subsequent development of depression.
This study is part of a larger project that seeks to examine the structure and function of the frontal lobe in depressed adolescents. One objective of the protocol has been to determine whether the MRS choline-depression correlations found in adults also are found in younger people. In this article, using proton magnetic resonance spectroscopy (1H MRS) among depressed and normal
adolescents, we examine the correlation between orbito-frontal levels of cytosolic, choline-containing compounds and diagnostic status. This brain region was selected for study based on the emission tomography literature, which suggests a change in the orbitofrontal metabolism of depressed adults. We also examined gray and white matter
content in the voxel under study, in order to determine whether tissue content affects the concentration of the metabolite examined. Based on the adult literature, our primary hypothesis for this study was that, among adoles-cents, a depression diagnosis would be associated with elevated orbitofrontal levels of cytosolic choline-contain-ing compound. We also hypothesized that between de-pressed and control adolescents, there would be no differ-ences in the percentages of gray and white matter within the MRS voxel (Renshaw et al 1997) that could, in part, explain the alteration in cytosolic choline levels (Lundbom et al 1999; Noworolski et al 1999; Pfefferbaum et al 1999; Pouwels et al 1999).
Methods and Materials
Sample
Subjects aged 13–17 years were recruited from clinical programs and from advertisements in newspapers and other postings in the study area (although one of the control subjects was 11 and two were 12 years old). All subjects and their parent or guardian signed informed consents for the study after the procedures were fully explained. As part of a comprehensive evaluation for the larger study, each subject completed the Beck Depression Inven-tory (BDI; Beck et al 1961) and the subject’s parent or guardian completed the self-report Family History - Epidemiologic (FHE): Biological Parents and Children (Lich and Weissman, unpub-lished 1990; Rao et al 1993). Each subject also received a structured clinical interview—the Lifetime Schedule for Affec-tive Disorders and Schizophrenia for Adolescents (K-SADS-L; Orvaschel 1985; Puig-Antich et al 1980) and the Hamilton Depression Rating Scale (HAM-D; Hamilton 1960)—and a medical examination. The principal investigator (RJS), who was blind to MRS data, administered the clinical interview and medical exam.
Depressed subjects were diagnosed using the K-SADS and excluded using the same tool if they 1) had a history of DSM-IV (American Psychiatric Association 1994) bipolar disorder, pedi-atric developmental disorder, schizophrenia, obsessive– compul-sive disorder, attention-deficit/hyperactivity disorder, bulimia, anorexia, or posttraumatic stress disorder; 2) had a history of drug or alcohol abuse within 4 months of study entry; 3) had active psychotic symptoms; 4) were currently using medications known to have a significant central nervous system effect; 5) had a history of mental retardation; or 6) had a history of seizures or organic brain syndromes. Control subjects were excluded if they had a lifetime history of DSM-IV Axis I or Axis II disorder or a lifetime history of significant medical or neurological disorder. Subjects were excluded if they had metal implants or braces (because of the MRS procedure indications) or if they were uncooperative with the study protocol.
Magnetic Resonance Spectroscopy Procedure
obtained from frontal lobes. These images were used to prescribe a 3.38 cm3
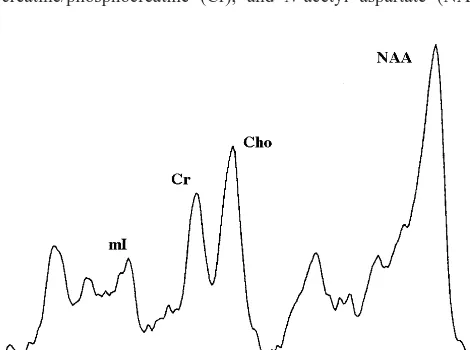
voxel (15 mm 3 15 mm 3 15 mm) in the left orbitofrontal cortex (Figure 1). Spectroscopic data were obtained using a STEAM pulse sequence; parameters were: TR 2000 msec, TE 30 msec, TM 13.6 msec, 2500 Hz spectral width, 1024 data points, 256 averages. Time domain stimulated echo was transferred offline for analysis using SA/GE software (General Electric Medical Systems, Milwaukee, WI). Data were zero-filled to 2048 data points and apodized with an exponential filter for line broadening of 1 Hz after Fourier Transformation (Figure 2). Spectral peak areas for choline-containing compounds (Cho), creatine/phosphocreatine (Cr), and N-acetyl aspartate (NAA)
were collected using the Marquardt fitting algorithm. Magnetic resonance spectroscopy metabolite levels were calculated as ratios to Cr resonance at 3.0 ppm, following a convention that minimizes errors that arise from variations in magnetic field homogeneity and tissue volume (Klunk et al 1994; Petroff et al 1998). To exclude the possibility that alterations in the Cho/Cr resonance reflected changes in the Cr resonance, ratios of Cho to the NAA resonance were also determined. Spectra were included in subsequent analyses if distinct resonances arising from NAA (2.0 ppm), Cr (3.0 ppm), and Cho (3.2 ppm) could be identified by the data analyst, who was blind to clinical information. For this study, unusable data typically resulted from an inability to obtain adequate homogeneity within the voxel because of nearby sinuses or dental appliances, as well as subject motion during data acquisition.
Morphometric Analysis of Images
Coronal images were segmented into gray and white matter using MRX, a semiautomated algorithm (Kikinis et al 1992). The full series of coronal images were transferred from the MR scanner to a Sun workstation and filtered to reduce noise. Seed points were chosen to define a range of pixel intensities for gray and white matter, following which the components of the image were divided into tissue types using a computerized algorithm. To determine the tissue composition of the MRS voxel, the previ-ously segmented image was edited further. The voxel location and its dimensions were entered and only pixels lying within the voxel were considered. A histogram was calculated producing volumetric estimates of gray matter and white matter for each voxel.
Statistical Analysis
Study data were analyzed as subject-specific descriptive data, i.e., each subject’s data record included clinical and psychiatric rating scale data linked to the MRS scan by a unique identifier number. Intention-to-treat methods were employed, with all available data included for all subjects participating in the scanning procedure and having at least sufficient baseline data to permit assignment to control or depressed subgroups.
For the primary analyses, the principal analytic method used was generalized estimating equations regression modeling (Zeger and Liang 1986). This modeling method is suitable for both binary outcomes (probit analysis) and continuous outcomes, and is tolerant of missing data in multivariate analyses, so long as the available data for any subject unbiasedly represent the subject’s circumstances in aggregate. The method permits ad-justment for covariates and robust estimation of standard errors. Where necessary, continuous measures were logarithmically transformed to achieve distributions tractable for modeling anal-yses. Interactions were checked for significance in models in which there were multiple explanatory factors. Partial residual plots were used to check for adequacy of model fit. Cumulative distribution plots were used to illustrate the correlations between continuous explanatory factors and the dichotomous (diagnosis) outcome measure.
Figure 1. Coronal magnetic resonance image demonstrating a typical location of the 3.38-cm3
orbitofrontal cortex proton magnetic resonance spectroscopy voxel.
Results
Twenty-two depressed subjects (18 female) and 43 control subjects (28 female) aged 11 to 18 years (mean 15.0 years, SD 1.7) were recruited. Ethnicity was predominantly white (83%); in addition, there were three African Amer-ican subjects, three Hispanic subjects, and five of Asian ethnicity. In the depressed group, 17 usable scans were obtained; 28 in the control group were of adequate quality. Demographic characteristics of the depressed and control subjects with usable scans are summarized in Table 1. No significant differences in demographic/history variables were found between the groups with and without usable scans. The depressed group, on average, was about 15 months older than the control group (p5.009; Table 1). By selection, the depressed group differed substantially from the control group on depression rating scales (Table 1).
Also by selection, the depressed group differed from the control group on a number of morbidity and treatment history factors. None of the control subjects were on psychotropic medications at the time of the study, whereas five of the depressed subjects were on medications (among these, there were four with usable scans; Table 1). For those depressed subjects not on psychotropic medications at the time of the scan, if they ever had taken psychotropic medications, they had been off medication for at least 3 months at the time of the scan and most of them had been off medications for much longer. Five (18%) of the control subjects were found to have a family history of affective
illness; in the depressed group, 8 (47%) had such a history (p5.036; Table 1). None of the control subjects had any psychiatric disorders; within the depression group, six had morbid psychiatric illness. Of these subjects, the co-occurring psychiatric condition for three was anxiety. Because of the manner in which the control and depressed subjects were selected, these differences in psychiatric history and treatments were expected. Clinical brain MRI examinations were within normal limits for all subjects.
As hypothesized, orbitofrontal cortex voxel Cho/Cr ratios were substantially higher, by more than 15%, in the depressed group than in the control group. This difference was statistically significant (z52.15, p5.032; Table 2) by probit analysis modeling with diagnostic category (depressed vs. control group) as the outcome measure and Cho/Cr as the explanatory factor. Gender was not corre-lated with Cho/Cr ratios, with a male–female Cho/Cr difference of less than 3% (males less than females; data not shown). Age was not correlated with Cho/Cr ratios (Spearman rank correlation 5 2.07, ns, data not shown) within the present study, although it has been reported by other investigators to be positively correlated with brain choline/creatine ratios in adults (Lundbom et al 1999; Pfefferbaum et al 1999). It should be noted, however, that the cited studies compared 20- and 30-year-old subjects with subjects in their 70s. It is possible that age effects occur later in life or that they are small enough compared to the uncertainty in the data that a large range of ages must be studied to detect age effects. We adjusted the
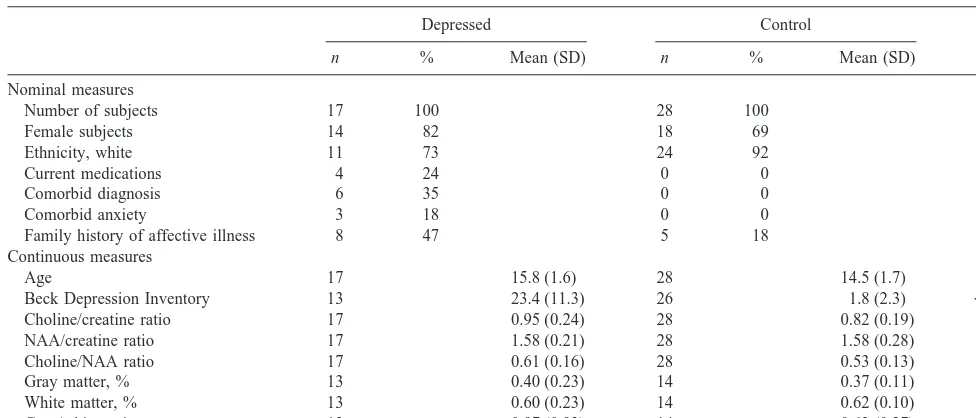
Table 1. Sample Description and Contrasts: Depressed vs. Control Groups
Depressed Control
pa
n % Mean (SD) n % Mean (SD)
Nominal measures
Number of subjects 17 100 28 100
Female subjects 14 82 18 69 .20
Ethnicity, white 11 73 24 92 .10
Current medications 4 24 0 0 .016b
Comorbid diagnosis 6 35 0 0 .002b
Comorbid anxiety 3 18 0 0 .048b
Family history of affective illness 8 47 5 18 .036
Continuous measures
Age 17 15.8 (1.6) 28 14.5 (1.7) .009
Beck Depression Inventory 13 23.4 (11.3) 26 1.8 (2.3) ,.001
Choline/creatine ratio 17 0.95 (0.24) 28 0.82 (0.19) .032
NAA/creatine ratio 17 1.58 (0.21) 28 1.58 (0.28) .90
Choline/NAA ratio 17 0.61 (0.16) 28 0.53 (0.13) .040
Gray matter, % 13 0.40 (0.23) 14 0.37 (0.11) .62
White matter, % 13 0.60 (0.23) 14 0.62 (0.10) .70
Gray/white ratio 13 0.97 (0.93) 14 0.63 (0.27) .21
NAA, N-acetyl aspartate.
aNominal measures: p values determined byx2or Fisher exact tests. Continuous measures: p values determined by linear regression modeling with robust estimation
of SEs.
bFormally, these contrasts should not be tested for statistical significance, since the control group was selected, in part, on the basis of these factors. The p values are
Cho/Cr– diagnostic group analysis by adding age as a second explanatory factor, and in this trivariate analysis, after controlling for age, the Cho/Cr factor remained significantly correlated with depression status (z5 2.40,
p 5 .017; Table 2). When Cho/NAA ratios were evalu-ated, orbitofrontal cortex voxel Cho/NAA ratios also were substantially elevated, by more than 15%, in the depressed group compared to the control group. The difference was statistically significant (z52.05, p5.040; Table 2) There was no gender difference in Cho/NAA levels (data not shown). After controlling for age, the Cho/NAA– depres-sion diagnosis correlation remained statistically significant (z52.27, p5.023; Table 2). When gender was added to models correlating diagnostic status with Cho/Cr and Cho/NAA levels, these correlations remained unchanged. Because the ethnicity distribution differed within the depressed and comparison groups (Table 1), we added ethnicity (white, yes/no) as a third explanatory factor in a third set of regression models. The Cho/Cr and Cho/NAA correlations with diagnostic status remained statistically significant after this additional adjustment (data not shown).
Several history and treatment variables were not corre-lated with the brain chemistry ratios Cho/Cr and, with one exception, Cho/NAA. For Cho/Cr, these correlations were as follows: current medications indicator (t5 1.51, p5 .14), any anxiety comorbidity (t5 20.49, p5.062), and family psychiatric history (t 5 1.08, p 5 .29). For Cho/NAA, one of these factors, any psychiatric comorbid-ity, was strongly and positively correlated with depression status (t5 2.94, p5 .005). The other three factors were not significantly correlated with Cho/NAA: current med-ications indicator (t 5 1.80, p 5 .08), any anxiety
comorbidity (t 5 0.96, p 5 .34), and family psychiatric history (t5 1.76, p5 .09).
When these four history/treatment factors were added to the regression models correlating Cho/Cr and Cho/NAA with diagnostic status, the statistically significant correla-tions of the depressed versus control subgroups with Cho/Cr and Cho/NAA were attenuated. All of these correlations, however, remained fairly strong after these adjustments, with p values in the range of p5.15 to p, .001. One exception to this generalization was Cho/Cr and comorbid anxiety, in which the Cho/Cr diagnosis p value decreased from p5 .032 to p5 .022.
When gray/white matter ratio was added as a covariate in modeling analyses associating diagnostic status with Cho/Cr ratio, the strength of the diagnosis-Cho/Cr corre-lation was increased. The same increase occurred for diagnosis and Cho/NAA correlation. For example, in the model associating diagnostic category and Cho/Cr, when gray/white matter ratio was added as a covariate, the regression coefficient was substantially increased, with the
z statistic for this coefficient being increased from 2.15
(Table 2; diagnosis and Cho/Cr) to 2.886, and in the covariate analyses, the results were substantially the same. Yet gray/white matter ratio, as a single explanatory factor, was not significantly correlated with diagnostic status (i.e., depressed vs. control) (z51.56, p5.12; data not shown), nor were percent gray or percent white matter. Also, gray/white matter ratio was not correlated with Cho/Cr ratio: r 5.09 (p 5.66, n5 27).
When depressed subjects currently taking medications (n55) were excluded from the analysis of the correlation of Cho/Cr with diagnostic status, the strength of the correlation was marginally changed, with the estimated p
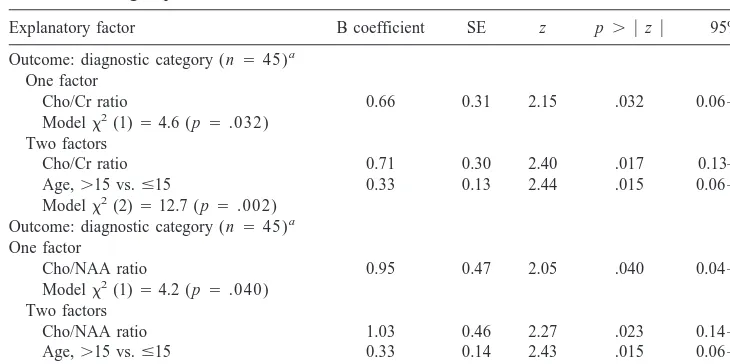
Table 2. Multivariate Regression Modeling Analyses Outcomes—Diagnostic Category: Depressed vs. Control Subgroups
Explanatory factor B coefficient SE z p. u zu 95% CI
Outcome: diagnostic category (n545)a
One factor
Cho/Cr ratio 0.66 0.31 2.15 .032 0.06 –1.297
Modelx2(1)54.6 (p5.032)
Two factors
Cho/Cr ratio 0.71 0.30 2.40 .017 0.13–1.29
Age,.15 vs.#15 0.33 0.13 2.44 .015 0.06 – 0.59
Modelx2(2)512.7 (p5.002)
Outcome: diagnostic category (n545)a
One factor
Cho/NAA ratio 0.95 0.47 2.05 .040 0.04 –1.87
Modelx2(1)54.2 (p5.040)
Two factors
Cho/NAA ratio 1.03 0.46 2.27 .023 0.14 –1.93
Age,.15 vs.#15 0.33 0.14 2.43 .015 0.06 – 0.59
Modelx2(2)511.7 (p5.003)
CI, confidence interval; Cho, choline; Cr, creatine; NAA, N-acetyl aspartate.
value being reduced from .032 to .058. Part of this reduction in p value is owing to smaller sample size. When modeling analyses correlating Cho/Cr ratio and diagnostic category with covariate adjustment for gray/white ratio were limited to subjects not on medications, the diagnosis– Cho/Cr correlation, although reduced in strength, re-mained statistically significant (p5.045).
In summary, our results are that, among the adolescents in this study, both Cho/Cr and Cho/NAA ratios were found to correlate positively and strongly with depression group status. These correlations persisted after adjustment for differences in age and ethnicity between the depressed and comparison subgroups. These correlations also remained strongly positive after adjustment for several history and treatment factors, although with such adjustment, the regression coefficients were marginally increased above conventional statistical significance levels. No differences between the depressed subjects and the control subjects were found in gray or white matter.
Discussion
We report a strong, positive correlation between depres-sion diagnosis and increased brain Cho/Cr and Cho/NAA ratios in a voxel located in the left anterior medial frontal lobe of adolescents. These choline ratios are correlated categorically with depression diagnosis. The fact that both ratios were increased in the depressed subjects provides important support for a hypothesis that depression is associated with a significant elevation in the cytosolic choline. Further, these findings do not appear to be determined by tissue content (i.e., percent gray or percent white matter) or by the effects of current antidepressant administration to a limited number of depressed subjects. These results are consistent with previous reports of abnormalities in choline levels in the brains (Charles et al 1994; Lafer et al 1994; Moore et al, in press; Renshaw and Cohen 1993; Renshaw et al 1994) and peripheral cells of adults with affective disorder (Stoll et al 1991).
Various hypotheses have been put forth regarding cho-line–affective state linkages. The first speculations regard-ing the role of choline related to the fact that choline is a precursor for the neurotransmitter acetylcholine. Janowsky et al (1972) hypothesized a balance between adrenergic and cholinergic systems, suggesting that overactivity of the cholinergic system and an associated underactivity of the adrenergic system could lead to depressive symptoms. A second hypothesis centers on the fact that choline is incorporated into two principle phospholipids in the neu-ronal membrane: phosphatidylcholine and sphingomyelin (Blusztajn and Wurtman 1983; Loffelholz et al 1989). Phosphatidylcholine is an important source of the second-messenger diacylglycerol and thus is involved in
intracel-lular signal transduction (Exton 1990, 1994; Loffelholz et al 1989; Zeisel 1993). It has been hypothesized that alterations in the concentrations of choline-containing phospholipids could lead to changes in the hydrolysis of phosphatidylcholine and subsequently alter the rate of signaling through the phosphatidylcholine system (Daw-son et al 1985). The proton MRS choline re(Daw-sonance signal reflects a pool of choline composed of acetylcholine and the byproducts of phosphatidylcholine hydrolysis (Ptd-Cho; brain concentration;21 mmol/L), phosphocholine (PC; brain concentration ; 0.57 mmol/L) and glycero-phosphocholine (GPC; brain concentration; 0.94 mmol/ L). The total pool of cytosolic choline measured by MRS is ;2.0 mmol/L. Acetylcholine represents only a portion of this amount (;0.02 mmol/L; Bluml et al 1999; Klein et al 1993). We report a change of approximately 15% in the MRS choline resonance, which represents a 0.3 mmol/L increase in cytosolic choline. Given the magnitude of this change, the MRS findings are likely the result of changes in phosphocholine and glycerophosphocholine, as opposed to alterations limited to acetylcholine synthesis and metabolism.
A third hypothesis suggests that changes in choline resonance may be related to changes in local metabolic rates required to drive the incorporation of cytosolic choline containing compounds into phospholipids (Duc et al 1997). In a study of healthy adults, Duc et al (1997) reported that local metabolic rates, as assessed by using positron emission tomography, are inversely related to the intensity of MRS choline across distinct brain regions. Indeed, it seems that although our findings show a 15% increase in choline levels in depressed subjects compared to control subjects, there is much evidence of reduced metabolism and blood flow in depressed subjects (see reviews by Kennedy et al 1997; Rogers et al 1998; Soares and Mann 1997). For example, Galynker et al (1998) found a 12.7% decrease in regional cerebral blood flow in the left orbital frontal cortex of subjects with major depressive disorder, as compared with control subjects. Baxter et al (1989) also found a 6.25% decrease in the mean glucose metabolic rate for the left dorsal and anterolateral prefrontal cortex. The connection between brain metabolism and choline levels is not clear, and future research should investigate whether alterations in either signal transduction or metabolic rates may be causally related to mood disorder or epiphenomenon of other causal factors.
pituitary–adrenal (HPA) axis hyperactivity (Nemeroff 1998). Khiat et al (1999) have reported decreases in frontal and thalamic area Cho/Cr ratio in a group of patients with Cushing’s syndrome. Gupta et al (1995) reported an increase in MRS choline resonance in a small sample of patients with congenital hypothyroidism that normalized with treatment. Bhatara et al (1998) reported decreased Cho/Cr ratios in patients with untreated Grave’s disease that normalized with treatment. It is of interest to note that these patients also had evidence of neurocognitive impair-ments consistent with prefrontal lobe dysfunction.
Given the hypothesized involvement of the prefrontal cortex in the circuit paths responsible for affect modula-tion and the integramodula-tion of thought and emomodula-tion (Mesulam 1986; Sackeim et al 1990), our results suggest alterations in the functioning of this circuitry, regardless of the underlying mechanism that alters the choline resonance. It is possible that these findings represent measurable func-tional changes that can predispose an individual to develop the cognitive and emotional changes that occur in major depressive disorder (Drevets et al 1992; Folstein et al 1991; McHugh 1989; Sackeim et al 1990; Swerdlow et al 1990).
Although the number of subjects in this study is comparable to that in many recent neuroimaging studies, we recognize that our small sample size is a limitation on the generalizability of its findings. Our findings should be replicated in order to confirm the results; however, in addition to replication, we feel that future research should proceed in at least three directions. First, it is important to discover if the Cho/Cr and Cho/NAA resonances vary in children and adolescents with response to treatment as they have been shown to do in adults, and if brain choline level could be an indicator of responsiveness to treatment. Studies by Moore et al (in press) and Charles et al (1994) indicate a possibility that an elevation in brain Cho/Cr ratios is a condition that could be changed with treatment, but this finding should be replicated in a child or adoles-cent sample before more substantive conclusions are possible.
Second, it is important to investigate the presence of Cho/Cr and Cho/NAA abnormalities in other areas of the depressed adolescent brain. For example, in contrast with this study, Renshaw et al (1997) found that in the basal ganglia, depressed subjects actually had decreased Cho/Cr ratios in comparison with control subjects. In addition, Ende et al (1997) have noted decreased hippocampal choline resonance intensities in depressed adults. This appears to be evidence that brain chemistry varies across different regions and thus warrants further investigation. Third, it is important to determine how Cho/Cr and Cho/NAA ratios change over time. In particular, through a longitudinal study of at-risk populations, it would be
interesting to see if cytosolic choline levels in the orbito-frontal cortex increase over time among any nondepressed subjects who eventually became clinically depressed.
In the context of other reports of altered metabolism in depression, this study suggests the presence of functional abnormalities in the frontal cortex of depressed adoles-cents. Further study is required to characterize the etiology of the current findings and to assess whether these findings are related to state or trait factors. It will be important for future studies to investigate whether identification of altered brain choline levels has clinical utility in diagnosis, treatment response monitoring, or the development of new treatments.
This study was supported by Grant No. 5RO1MH54695-03 from the National Institute of Mental Health, the Stanley Foundation, and the Hood Foundation.
Much appreciation is due to Arun Abraham, Veronika Cveckova, Susan Grosdov, Max Klau, and Gigi Parris for technical assistance.
References
American Psychiatric Association (1994): Diagnostic and
Sta-tistical Manual of Mental Disorders, 4th ed. Washington, DC:
American Psychiatric Association.
Barker PB, Breiter SN, Soher BJ, Chatham JC, Forder JR, Samphilipo MA, et al (1994): Quantitative proton spectros-copy of canine brain—in vivo and in vitro correlations. Magn
Reson Med 32:157–163.
Baxter LR, Schwartz JM, Phelps ME, Mazziotta JC, Guze BH, Selin CE, et al (1989): Reduction of prefrontal cortex glucose metabolism common to three types of depression. Arch Gen
Psychiatry 46:243–250.
Beck A, Ward C, Mendelson M, Mock J, Erbaugh J (1961). An inventory for measuring depression. Arch Gen Psychiatry 4:561–571.
Bhatara VS, Tripathi RP, Sankar R, Gupta A, Khushu S (1998): Frontal lobe proton magnetic-resonance spectroscopy in Graves’ disease: A pilot study. Psychoneuroendocrinology 23:605– 612.
Bluml S, Seymour KJ, Ross BD (1999): Developmental changes in choline- and ethanolamine-containing compounds mea-sured with proton-decoupled 31P MRS in in vivo human brain. Magn Reson Med 42:643– 654.
Blusztajn JK, Wurtman RJ (1983): Choline and cholinergic neurons. Science 221:614 – 620.
Bowen DM, Najlerahim A, Procter AW, Francis PT, Murphy E (1989): Circumscribed changes of the cerebral cortex in neuropsychiatric disorders of later life. Proc Natl Acad Sci
U S A 86:9504 –9508.
Charles HC, Lazeyras F, Krishnan RR, Boyko OB, Payne M, Moore D (1994): Brain choline in depression: In vivo detection of potential pharmacodynamic effects of antidepres-sant therapy using hydrogen localized spectroscopy. Prog
Neuropsychopharmacol Biol Psychiatry 18:1121–1127.
M, et al (1993): Quantitative cerebral anatomy in depression.
Arch Gen Psychiatry 50:7–16.
Dawson RM, Hemington N, Irvine RF (1985): The inhibition of diacylglycerol-stimulated intracellular phospholipases by phospholipids with a phosphocholine-containing polar group. A possible physiological role for sphingomyelin. Biochem J 230:61– 68.
Dougherty D, Rauch SL (1997): Neuroimaging and neurobiolog-ical models of depression. Harv Rev Psychiatry 5:138 –159. Drevets WC (1998): Functional neuroimaging studies of depres-sion: The anatomy of melancholia. Annu Rev Med 49:341– 361.
Drevets WC, Videen TO, Price JL, Preskorn SH, Carmichael ST, Raichle ME (1992): A functional anatomical study of unipo-lar depression. J Neurosci 12:3628 –3641.
Duc CO, Weber AH, Trabesinger AH, Meier D, Boesiger P (1997): Recycling the cholines. Int Soc Magn Reson Med 6:1210.
Ende G, Braus DF, Kuhnen J, Henn FA (1997): Proton MRSI in depressed patients undergoing electroconvulsive therapy: Is Ch increased by ECT? Proc Int Soc Magn Reson Med 2:1167. Exton JH (1990): Hormonal regulation of phosphatidylcholine breakdown. Adv Second Messenger Phosphoprotein Res 24: 152–157.
Exton JH (1994): Phosphatidylcholine breakdown and signal transduction. Biochem Biophys Acta 1212:26 – 42.
Folstein SE, Peyser CE, Starkstein SE, Folstein MF (1991): Subcortical triad of Huntington’s disease: A model for a neuropathology of depression, dementia, and dyskinesia. In: Carroll BJ, Barrett JE, editors. Psychopathology and the
Brain. New York: Raven, 65–75.
Galynker II, Cai J, Onseng F, Finestone H, Dutta E, Serseni D (1998): Hypofrontality and negative symptoms in major depressive disorder. J Nucl Med 39:608 – 612.
Gupta RK, Bhatia V, Poptani H, Gujral RB (1995): Brain metabolite changes on in vivo proton magnetic resonance spectroscopy in children with congenital hypothyroidism.
J Pediatr 126:389 –392.
Hamakawa H, Kato T, Murashita J, Kato N (1998): Quantitative proton magnetic resonance spectroscopy of the basal ganglia in patients with affective disorders. Eur Arch Psychiatry Clin
Neurosci 248:53–58.
Hamilton M (1960): A rating scale for depression. J Neurol
Neurosurg Psychiatry 23:56 – 62.
Janowsky DS, el-Yousef MK, Davis JM, Sekerke HJ (1972): A cholinergic-adrenergic hypothesis of mania and depression.
Lancet 2:632– 635.
Kennedy S, Javanmard M, Vaccarino FJ (1997): A review of functional neuroimaging in mood disorders: Positron emis-sion tomography and depresemis-sion. Can J Psychiatry 42:467– 475.
Khiat A, Bard C, Lacroix A, Rousseau J, Boulanger Y (1999): Brain metabolic alterations in Cushing’s syndrome as moni-tored by proton magnetic resonance spectroscopy. Nucl Magn
Reson Biomed 12:357–363.
Kikinis R, Shenton ME, Gerig G, Martin J, Anderson M, Metcalf D, et al (1992): Routine quantitative analysis of brain and cerebrospinal fluid spaces with MR imaging. J Magn Reson
Imaging 2:619 – 629.
Klein J, Gonzalez R, Koppen A, Loffelholz K (1993): Free choline and choline metabolites in rat brain and body fluids: Sensitive determination and implications for choline supply to the brain. Neurochem Int 22:293–300.
Klunk WE, Xu CJ, Panchalingham K, McClure RJ (1994): Analysis of magnetic resonance spectra by mole percent: Comparison to absolute units. Neurobiol Aging 15:133–140. Kumar A, Schweizer E, Jin Z, Miller D, Bilker W, Swan LL, et al (1997): Neuroanatomical substrates of late-life minor depression: A quantitative magnetic resonance imaging study. Arch Neurol 54:613– 617.
Lafer B, Renshaw PF, Sachs G, Christensen JD, Yurgelun-Todd D, Stoll AL, et al (1994): Proton MRS of the basal ganglia in bipolar disorder. In: Society of Biological Psychiatry. Phila-delphia: Society of Magnetic Resonance, 685.
Loffelholz K (1989): Receptor regulation of choline phospho-lipid hydrolysis. A novel source of diacylglylcerol and phosphatidic acid. Biochem Pharmacol 38:1543–1549. Lundbom N, Barnett A, Bonavita S, Patronas N, Rajapakse J,
Tedeschi D, et al (1999): MR image segmentation and tissue metabolite contrast in 1H spectroscopic imaging of normal and aging brain. Magn Reson Med 41:841– 845.
McHugh PR (1989): The neuropsychiatry of the basal ganglia.
Neuropsychiatry Neuropsychol Behav Neurol 2:239 –247.
Mesulam MM (1986): Frontal cortex and behavior. Ann Neurol 19:320 –325.
Miller BL, Chang L, Booth R, Ernst T, Cornford M, Nikas D, et al (1996): In vivo H-1 MRS choline— correlation with in vitro chemistry histology. Life Sci 58:1929 –1935.
Moore CM, Breeze JL, Gruber SA, Baab SM, Stoll AL, Hennen J, et al (in press): Myo-inositol, choline and mood in bipolar disorder: A proton MRSI study of the anterior cingulate cortex. Bipolar Disord.
Nemeroff CB (1998): The neurobiology of depression. Sci Am 278(6):42– 49.
Noworolski SM, Nelson SJ, Henry RG, Day MR, Wald LL, Star-Lack J, et al (1999): High spatial resolution 1H-MRSI and segmented MRI of cortical gray matter and subcortical white matter in three regions of the human brain. Magn Reson
Med 41:21–29.
Orvaschel H (1985): Psychiatric interviews suitable for use in research with children and adolescents. Psychopharmacol
Bull 21:737–745.
Petroff OAC, Ogino T, Alger JR (1988): High resolution proton magnetic resonance spectroscopy of rabbit brain: Regional metabolite levels and postmortem changes. J Neurochem 51:163–171.
Pfefferbaum A, Adalsteinsson E, Speilman D, Sullivan EV, Kim KO (1999): In vivo spectroscopic quantification of the N-acetyl moiety, creatine, and choline from large volumes of brain gray and white matter: Effects of normal aging. Magn
Reson Med 41:276 –284.
Pillay S, Yurgelun-Todd D, Bonello C, Lafer B, Fava M, Renshaw P (1997): A quantitative magnetic resonance imag-ing study of cerebral and cerebellar gray matter volume in primary unipolar major depression: Relationship to treatment response and clinical severity. Biol Psychiatry 42:79 – 84. Pouwels PJ, Brockmann K, Kruse B, Wilken B, Wick M,
brain metabolites from infancy to adulthood as detected by quantitative localized proton MRS. Pediatr Res 46:474 – 485. Puig-Antich J, Orvaschel H, Tabrizi MA, Chambers W (1980):
The Schedule for Affective Disorders and Schizophrenia for School-Aged Children-Epidemiologic Version (Kiddie-SADS-E). New York: New York State Psychiatric Institute and Yale
University School of Medicine.
Rajkowska G, Miguel-Hidalgo JJ, Wei J, Dilley G, Pittman SD, Meltzer HY, et al (1999): Morphometric evidence for neuro-nal and glial prefrontal cell pathology in major depression.
Biol Psychiatry 45:1085–1098.
Rao U, Weissman MM, Martin JA, Hammond RW (1993). Childhood depression and risk of suicide: A preliminary report of a longitudinal study. J Am Acad Child Adolesc
Psychiatry 34:21–27.
Renshaw P, Lafer B, Babb S, Fava M, Stoll A, Christensen J, et al (1997): Basal ganglia choline levels in depression and response to fluoxetine treatment: An in vivo proton magnetic resonance spectroscopy study. Biol Psychiatry 41:837– 843. Renshaw PF, Cohen BM (1993): Functional brain imaging in the
elderly. J Nucl Med 34:1101–1102.
Renshaw PF, Lafer B, Christensen JD, Stoll AL, Rothschild A, Fava M, et al (1994): Proton MRS of the basal ganglia in major depression. In: Society of Biological Psychiatry. Phil-adelphia: Society of Magnetic Resonance, 685.
Rogers MA, Bradshaw JL, Pantelis C, Phillips JG (1998): Frontostriatal deficits in unipolar major depression. Brain Res
Bull 47:297–310.
Sackeim H, Prohovnik I, Moeller J, Brown R, Apter S, Prudic J, et al (1990): Regional cerebral blood flow in mood disorders.
Arch Gen Psychiatry 47:60 –70.
Soares JC, Mann JJ (1997): The functional neuroanatomy of mood disorders. J Psychiatr Res 31:393– 432.
Steingard R, Renshaw P, Yurgelun-Todd D, Appelmans K, Lyoo I, Shorrock K, et al (1996): Structural abnormalities in brain magnetic resonance images of depressed children. J Am Acad
Child Adolesc Psychiatry 35:307–311.
Steingard RJ (in press): The neuroscience of depression in adolescence. J Affect Disord.
Stoll AL, Cohen BM, Snyder MB, Hanin I (1991): Erythrocyte choline concentration in bipolar disorder: A predictor of clinical course and medication response. Biol Psychiatry 29:1171–1180.
Swerdlow NR, Koob GF (1990): Toward a unified hypothesis of cortico-striato-pallido-thalamus function? Behav Brain Sci 13:172–177.
Zeger SL, Liang KY (1986): Longitudinal analysis for discrete and continuous outcomes. Biometrics 73:13–22.