P-ISSN: 2087-1228 E-ISSN: 2476-9053
Binus Business Review, 8(1), May 2017, 41-47
DOI: 10.21512/bbr.v8i1.1678
The Optimization of Capital Structure
in Maximizing Profit and Corporate Value
Kharisya Ayu Effendi
Management Department, Faculty of Business and Management, University of Widyatama Jln. Cikutra No.204A, Bandung 40125, Indonesia
Received: 2nd September 2016/ Revised: 2nd February 2017/ Accepted: 7th February 2017
How to Cite:Effendi, K. A. (2017). The Optimization of Capital Structure in Maximizing Profit and Corporate Value. Binus Business Review, 8(1), 41-47. http://dx.doi.org/10.21512/bbr.v8i1.1678
ABSTRACT
The purpose of this research was to determine the optimal capital structure which could maximize profits and
corporate value. The used method was quantitative descriptive analysis. Moreover, the data used was secondary data in the Jakarta Islamic Index (JII) from 2011 to 2015. The results of this research show that companies which have optimal capital structure are in line with the trade-off theory models. The capital structure is optimal if the debt levels are to a certain extent so that the corporate value will increase. However, if the debt limit passes the
certain degree, profit and corporate value will decrease. Meanwhile, pecking order theory in this research does
not conform and cannot be said to be optimal because of the low debt level describing the opposite result with the
theory as low profits.
Keywords: optimalization, capital structure, profit, corporate value
INTRODUCTION
According to Kusumajaya (2011), the aim of the establishment of a corporation was to maximize the wealth of shareholders or the owner of the company. Then, the corporate value is the market value of the equity and the debt. Thereby, the addition of the equity
to the debt of a corporation can reflect corporate value.
To maximize the corporate value, not only equity
values are considered, but the sources of finance such
as debt and the preferred stock are included (Jensen, 1976). In addition to that, the corporate value can be seen from stock price (Fama, 1978).
Maximizing shareholder wealth also means
maximizing the corporate value and profits. This is
because an indicator of investment that investors
consider before the firm goes public is the return. Therefore, profit needs to be well (Suryanto, 2014).
The companies that have survived all times focus on
the highest or maximum profits. Meanwhile, if the companies are not profit oriented, they will be crushed by the efficient companies (Stigler, 1971). Moreover, low profits will cause the takeover of the company,
and the stock price will decrease. In achieving
maximum profit and corporate value, the company can
optimize the capital structure. The capital structure is the optimal application of the mechanism on equity, long-term debt, and credit (DeMarzo & Fishman, 2007). Seeing from the meaning, capital structure is an important indicator for the company to increase
profits and the corporate value. In the capital structure,
there are policies regarding the risks and expected
profit. If the expected profit is high, it can lead to the
composition which the debt is greater than equity. This condition can result in the high risk in the companies. However, at the same time, it will also increase the corporate value. In addition, if the company reduces
the level of risk, the expected profit will also decrease. This condition is also reflected in the corporate value
decreasing.
Furthermore, the capital structure is also one
of the most complex areas of the financial decision
the structure of liabilities in the balance sheet as the
financing structure in the company. Then, Brealey et al. (2009) stated that the structure of the securities issued by the company was divided into debt and for owners. It was the same as the structure of liabilities related to equity, and long-term debt, and short-term debt. Low capital structure decisions can lead to high
cost of capital thereby reducing the Net Present Value (NPV) of the project and creating more of them cannot
be accepted. Meanwhile, effective capital structure
decisions can lower the cost of capital so that the NPV
of the project is higher and more acceptable to increase the corporate value (Gitman, 2010).
Brigham and Daves (1987) described that the optimal capital structure as a capital structure which optimized the balance between risk and return. Hence, it could maximize the corporate value of the stock. The determination of the optimal capital structure is intended to increase the shareholders’ wealth,
through the increased profit and corporate value. The
corporate value can be seen in stock prices that are
capital markets. On the contrary, profits primarily
are related to equity and total assets which can be measured by indicators such as Earning Per Shares (EPS). The optimal capital structure of the dominant paradigm used by the corporate finance is a
trade-off between cost and benefits debt (Berk, Stanton,
& Zechner, 2007). Taliaferro (2009) agreed that the optimal capital structure was based on the trade-off theory. Trade-off model is a predictive model derived from the optimal level of leverage for the portfolio of
the tax classification (Koslowsky, 2011). In contrast to
the other research, it is revealed that according to the
pecking order theory, it is the profitability growth of
the company (Jonnardi, 2016).
There are several previous researches of the capital structure. First, it was by Dewi and Wirajaya (2013) stated that capital structure had a negative effect
on the corporate value, but profitability still affected
the corporate value. Second, Wangsawinangun (2014) analyzed the optimal capital structure of PT Astra International in 2012 with the composition of 60% and 40% of equity and debt, with a Weighted Average Cost of Capital (WACC) in the smallest and largest stock value. The result was the composition of equity in 2012 was greater than the debt. However, the composition was the smallest compared to the previous year. Third, the optimal capital structure of PT. Gas Negara was 64% of equity and 36% of the debt, with8,41% of the smallest WACC as examined by Septantya, Dzulkirom, and Azizah (2015). Fourth, De Wet (2006) revealed there was the absence of absolute optimal capital structure. Fifth, Brusov, Filatova, and Orekhova (2013) concluded that the trade-off model was not the optimal capital structure. Sixth, optimal
capital structure could improve the cash flow and
have a positive impact on the solvency ratio in the research conducted by Kundakchyan and Zulfakarova (2014). Seventh, Chowdhury and Chowdhury (2010) described that maximizing the corporate value required the perfect combination of debt and equity. Moreover,
capital costs incurred should be minimized as many as possible to achieve the perfect combination. Eighth, at
the micro level, there was no significant relationship
between capital structure and corporate value, but at a macro level, the relationship was very positive as founded by Dalal (2013).
From previous researches mentioned, the
researcher finds there is a problem has not been studied
previously. It is how to determine the optimal capital
structure to generate maximum profits and corporate
value. Therefore, the purpose of this research is to
find the way to determine the optimal capital structure which can maximize profits and corporate value. The benefit of this research is that the companies know how an optimal capital structure can maximize profits
and corporate value clearly.
METHODS
The method used in this research is quantitative descriptive analysis. The data used is secondary data in the Jakarta Islamic Index (JII) from 2011 to 2015. There are 12 companies that remained consistent in the JII since 2011 to 2015. There are AALI, ASII, ASRI, INTP, ITMG, KLBF, LPKR, LSIP, SMGR,
TLKM, UNTR and UNVR. Determining the Optimal
Capital Structure, the researcher uses two theories. First, in trade-off theory, every company should set a target in a capital structuresuch as on the balance
of costs, and marginal benefits of financing with debt.
This is because it is in the position of maximizing the corporate value. Based on this theory, if the level of debt is high, it means there is an increase in the risk borne by shareholders (equity) and the expected rate of return (Brigham & Daves, 1987). Similarly, the higher the level of corporate debt to a certain extent is, the higher the corporate value will be (Modigliani & Miller, 1958). Second, it is pecking order theory as presented by Myers (1983). It describes the ratio
between profit and debt. If the companies have a high profit, in general, these companies will borrow in
small number. Moreover, the priority funding comes from internal.
There are several steps to determine the optimal
capital structure and link the profit and corporate
value for the maximum corporate value (stock price),
the maximum profit (EPS), and minimal cost of
Where, D = Total debt E = Total equity A = Total asset
Then, calculate the leverage ratio (debt ratio and debt to equity ratio/ DER). The equation is as follows:
Debt to Equity Ratio = D
(3)
E
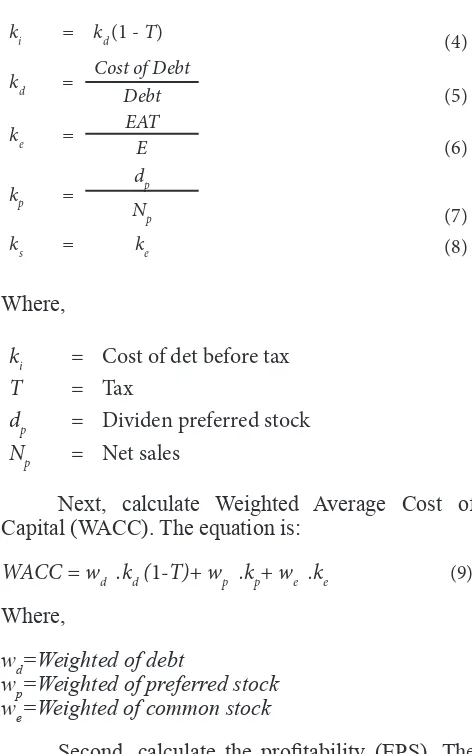
Moreover, calculate the cost of capital or cost of debt (kd), the cost of common stock (ke), the cost
dp = Dividen preferred stock
Np = Net sales
Next, calculate Weighted Average Cost of Capital (WACC). The equation is:
WACC = wd .kd (1-T)+ wp .kp+ we .ke (9)
Where,
wd=Weighted of debt
wp=Weighted of preferred stock we=Weighted of common stock
Second, calculate the profitability (EPS). The
equation is:
EPS = Earing Availabel for Common Stock
(10)
Number of Share of Common Stock
Third, see the corporate value from the stock price. Fourth, analyze the optimization of capital structure by comparing the company’s capital
structure, the smallest cost of capital, profits of the
largest and stock prices of the largest since the year 2011 - 2015. Last, use MS. Excel 2010 to calculate the
financial ratio.
RESULTS AND DISCUSSIONS
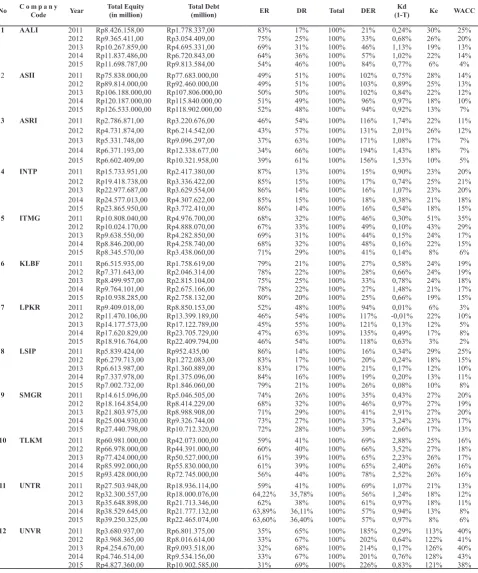
The analysis is divided into two parts. First, it is the analysis the capital structure 2011-2015. The statistical data of the capital structure on 12 companies listed in the Jakarta Islamic Index are presented in Table 1 (see appendix). It describes the composition of the debt and equity respectively of each company as well as the leverage ratio and cost of capital.
From the data in Table 1 (see appendix), there is a similar pattern. Most of the companies have increased in capital from loans from year to year. It can be said that the greater the composition of capital from the loan is, the smaller the weighted average cost of capital gets.
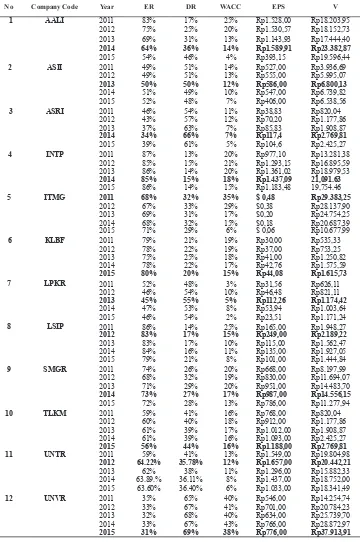
Second, the analysis is regarding optimization of capital structure. The data used is the optimal capital structure from 12 companies listed in the Jakarta Islamic Index from 2011 to 2015. Table 2 (see appendix) shows the data.
From Table 2 (see appendix), the optimal capital structure in AALI in 2014 had the composition of equity and debt capital 64% and 36% respectively. It is optimal for the minimum WACC of 14%, and the maximum EPS of Rp1.589,91. In addition, the
corporate value reflected in the share price is the
maximum of Rp23.382,82. This is consistent with the trade-off theory saying that if the debt is large, the value of the company will increase up to the maximum limit. However, if it passes the limit, the value of the company will decrease. This condition is contrary to Mayer’s statement in the pecking order theory stating that the smaller the company debt is, the greater the
profits of a company will be. In 2011, the composition
of capital derived from debt was only 17%, but EPS earned only Rp1.528,00, and the corporate value was only Rp18.203,95.
Furthermore, in ASII, the optimal capital structure in 2013 with the composition of equity and debt capital was 50% and 50%. The optimal for the minimum WACC is equal to 12% with maximum EPS of Rp586,00 and the maximum corporate value of Rp6.800,13. This situation is consistent with the trade-off theory and opposite to the pecking order theory. It is because, in 2015, the composition of capital derived from debt was only 48%. Moreover, EPS obtained only Rp406,00, and the corporate value was only Rp6.538,56.
Then, the optimal capital structure with the composition of equity and debt capital was 34% and 66% in 2014 in ASRI. The optimal for minimum WACC is equal to 7%. Furthermore, the maximum
EPS is Rp117,40, and corporate value as reflected
in the share price is up to Rp2.769,81. This result is consistent with the trade-off theory and opposite to the pecking order theory. Because in 2011, the composition of capital obtained from debt was only 54%. However, EPS obtained only Rp38,83, and the corporate value was only Rp820,04.
with the composition of equity and debt capital was 85% and 15% respectively. It is optimal for minimum WACC of 18%, the maximum EPS of Rp1.437,09.
Then, the corporate value reflected in the share price
is Rp21.091,63. Similarly, this is in line with the trade-off theory and opposite to the pecking order theory. In 2011, the composition of capital derived from debt was only 13%, but EPS obtained only Rp977,10, and the corporate value was only Rp13.281,38.
Meanwhile, in ITMG, the optimal capital structure in 2011 with the composition of equity and debt capital was 68% and 32%. WACC is said to be optimal although it is not 35% minimally for the year and is charged with high interest, it can generate maximum EPS of $0,48, and the corporate value
as reflected in the share price is the maximum of
Rp29.383,25. Hence, this condition is consistent with the trade-off theory and contrast to the pecking order theory. In 2015, the composition of capital derived from debt was only 29%, but EPS obtained only $0,06, and the corporate value was only Rp10.677,99.
Furthermore, in KLBF, the optimal capital structure in 2014 showed 80% and 20% of the composition of equity and debt capital. It is optimal for minimum WACC of 15% with maximum EPS of
Rp44,08, and the value of the company as reflected in
the share price is up to Rp1.615,73. This condition is consistent with the trade-off theory.
In LPKR 45% and 55% were the optimal capital structure in 2013 with the composition of equity and debt capital. WACC is optimal with the minimum of 5%. Moreover, the maximum EPS is Rp112,26,
and corporate value as reflected in the share price
is Rp1.174,00. This is consistent with the trade-off theory, but opposite to the pecking order theory. Since in 2011, the composition of capital derived from debt was only 48%. Then, EPS obtained was only Rp31,56, and the corporate value was only Rp626,11.
Similarly, the optimal capital structure with the composition of equity and debt capital was 83% and 17% for LSIP in 2012. It is optimal for minimum WACC of 15%, the maximum EPS of Rp249,00, and
the corporate value of Rp2.189,22 as reflected in the
share price. This is consistent with the trade-off theory and opposite to the pecking order theory. In 2011, the composition of capital obtained from debt was only 14%, EPS with Rp165,00, the corporate value with Rp1948,27.
For SMGR, the optimal capital structure in 2014 with the composition of equity and debt capital was 73% and 27% respectively. It is optimal for minimum WACC of 17%, and the maximum EPS is Rp987,00.
Then, the corporate value is Rp14.556,15 as reflected
in the share price. This is consistent with the trade-off theory but is different from pecking order theory. In 2011, the composition of capital gathered from debt was only 26%, but EPS was only Rp668,00 and the corporate value with Rp8.197,99.
Next, in TLKM optimal capital structure in 2015 with the composition of equity and debt capital was 56% and 44%. It is optimal for minimum WACC
of 16%, and the maximum EPS is Rp1.188,00. The
corporate value as reflected in the share price is
Rp2.764,81. This is consistent with the trade-off theory and opposite to the pecking order theory. In 2014, the composition of capital derived from debt was only 39%. However, EPS earned only Rp1.093,00, and the corporate value was only Rp2.425,27.
Moreover, in UNTR, the optimal capital structure in 2012 with the composition of equity and debt capital was 64% and 36%. The minimum WACC equals to 12%. The maximum EPS is Rp1.657,00,
and the corporate value as reflected in the share price
is Rp20.442,21. This is consistent with the theory of the tax and trade off stating that with large debt, the value will rise. However, it is limited to the maximum extent, if it passes the limit, the corporate value will decrease.
Last, the optimal capital structure in 2015 with the composition of equity and debt capital was 31%
and 69% for UNVR. WACC is optimal for a minimum
of 38%. Moreover, the maximum EPS is Rp776,00,
and the value of the corporate value as reflected in the
share price is Rp37.913,91. This is consistent with the trade-off theory. Unfortunately, it is different from the pecking order theory. It is because, in 2011, the composition of capital derived from debt was only 65%, but EPS and the corporate value were only Rp546,00 and Rp14.254,74 respectively.
CONCLUSIONS
From the results, the company has the optimal capital structure in accordance with the trade-off theory models according to Brigham and Daves (2007) and Modigliani and Miller (1958). They describe that the capital structure is optimal if there is a large debt to a certain extent. Then, the corporate value will also increase. However, if the debt exceeds
the limit, the profit and the corporate value will
decrease. Each company has a different composition of the capital structure. Nonetheless, there is a special concern that most of the companies surveyed describe the composition of the debt which is greater than the
equity will provide greater profits for the company
and make market value higher in companies that are offset by the minimized cost of capital. Pecking order theory in this research is not appropriate and cannot be said to be optimal. It is because the low debt illustrates
the opposite result with the theory, namely low profits.
In theory, it explains that low debt can provide the
optimal profit.
REFERENCES
Berk, J. B., Stanton, R., & Zechner, J. (2007). Human capital, bankruptcy, and capital structure source. The Journal of Finance, 65(3), 891-926. http://doi. org/10.3386/w13014
Brealey, R. A., Myers, S. C., & Marcus, A. J. (2009).
States: McGraw-Hill.
Brigham, E. F., & Daves, P. R. (1987). Intermediate financial management. The British Accounting Review, 12(3), 286-288. http://doi.org/10.1016/0890-8389(89)90100-5
Brusov, P. N., Filatova, T. V., & Orekhova, N. P. (2013). Absence of an optimal capital structure in the famous tradeoff theory! Journal of Reviews on Global Economics, 2, 94-116.
Chowdhury, A., & Chowdhury, S. P. (2010). Impact of capital structure on firm’s value: Evidence from Bangladesh. Business and Economic Horizons, 3(3), 111-122. http://doi.org/10.15208/beh.2010.32 Dalal, G. (2013). Optimal capital structure. International
Journal of Education & Management, 3(2), 233-238. De Wet, J. (2006). Determining the optimal capital
structure: A practical contemporary approach. Meditari Accountancy Research, 14(2), 1-16. http:// doi.org/10.1108/10222529200600009
DeMarzo, P. M., & Fishman, M. J. (2007). Optimal long-term financial contracting. Review of Financial Studies, 20(6), 2079-2128. http://doi.org/10.1093/ rfs/hhm031
Dewi, A. S. M., & Wirajaya, A. (2013). Pengaruh struktur modal, profitabilitas dan ukuran perusahaan pada nilai perusahaan. E-Jurnal Akuntansi Universitas Udayana, 4(2), 358-372.
Fama, E. F. (1978). The effects of a firm’s investment and financing decisions on the welfare of its security holders. The American Economic Review, 68(3), 272-284. http://doi.org/10.2307/1805260
Gitman, L. J. (2010). Principle of managerial finance: Global and Southern African perspectives. Cape Town: Pearson.
Jensen, M. C. (1976). Theory of the firm: Managerial behavior, agency costs and ownership structure. Journal of Financial Economics, 3(4), 305-360. http://doi.org/10.1016/0304-405X(76)90026-X Jonnardi. (2016). Moderating effect of monetary indicators
on the pecking order theory validity in Indonesia Stock Exchange (BEI). International Journal of
Economic, Commerce, and Management, IV(7), 1-15.
Koslowsky, D. (2011). Optimal capital structure. Retrieved from http://ssrn.com/abstract=1787836
Kundakchyan, R. M., & Zulfakarova, L. F. (2014). Current issues of optimal capital structure based on forecasting financial performance of the company. Life Science Journal, 11(6s), 368-371.
Kusumajaya, D. K. O. (2011). Pengaruh struktur modal dan
pertumbuhan perusahaan terhadap profitabilitas
dan nilai perusahaan pada perusahaan manufaktur di bursa efek Indonesia (Unpublished Thesis). Universitas Udayana, Denpasar.
Modigliani, F., & Miller, M. H. (1958). The cost of capital, corporate finance and the theory of investment. The American Economic Review, XLVIII(June), 261-297. Myers, S. C. (1983). The capital structure puzzle revisited.
The Review of Financial Studies, 39(3), 575-592. http://doi.org/10.1093/rfs/8.4.1185
Ross, S. A., Westerfield, R., & Jordan, B. D. (2008).
Fundamentals of corporate finance. Boston: Irwin
McGraw-Hill.
Septantya, A., Dzulkirom, M., & Azizah, D. F. (2015). Penentuan struktur modal yang optimal dalam rangka meningkatkan nilai saham perusahaan (Studi pada PT. Perusahaan Gas Negara (Persero) Tbk,). Jurnal Administrasi Bisnis, 29(1), 10-18.
Stigler, G. J. (1971). The theory of economic regulation. The Bell Journal of Economic and Management Science, 2(1), 3-21.
Suryanto, T. (2014). Manajemen laba pada Bank Syariah di Indonesia: Peran komite. KINERJA: Journal of Business and Economics, 18(1), 90-100.
Table 1 Capital Structure
No C o m p a n y Code Year Total Equity (in million)
Total Debt
(million) ER DR Total DER
Kd
(1-T) Ke WACC
1 AALI 2011 Rp8.426.158,00 Rp1.778.337,00 83% 17% 100% 21% 0,24% 30% 25% 2012 Rp9.365.411,00 Rp3.054.409,00 75% 25% 100% 33% 0,68% 26% 20% 2013 Rp10.267.859,00 Rp4.695.331,00 69% 31% 100% 46% 1,13% 19% 13% 2014 Rp11.837.486,00 Rp6.720.843,00 64% 36% 100% 57% 1,02% 22% 14% 2015 Rp11.698.787,00 Rp9.813.584,00 54% 46% 100% 84% 0,77% 6% 4%
2 ASII 2011 Rp75.838.000,00 Rp77.683.000,00 49% 51% 100% 102% 0,75% 28% 14% 2012 Rp89.814.000,00 Rp92.460.000,00 49% 51% 100% 103% 0,89% 25% 13% 2013 Rp106.188.000,00 Rp107.806.000,00 50% 50% 100% 102% 0,84% 22% 12% 2014 Rp120.187.000,00 Rp115.840.000,00 51% 49% 100% 96% 0,97% 18% 10% 2015 Rp126.533.000,00 Rp118.902.000,00 52% 48% 100% 94% 0,92% 13% 7%
3 ASRI 2011 Rp2.786.871,00 Rp3.220.676,00 46% 54% 100% 116% 1,74% 22% 11% 2012 Rp4.731.874,00 Rp6.214.542,00 43% 57% 100% 131% 2,01% 26% 12% 2013 Rp5.331.748,00 Rp9.096.297,00 37% 63% 100% 171% 1,08% 17% 7% 2014 Rp6.371.193,00 Rp12.338.677,00 34% 66% 100% 194% 1,43% 18% 7% 2015 Rp6.602.409,00 Rp10.321.958,00 39% 61% 100% 156% 1,53% 10% 5%
4 INTP 2011 Rp15.733.951,00 Rp2.417.380,00 87% 13% 100% 15% 0,90% 23% 20% 2012 Rp19.418.738,00 Rp3.336.422,00 85% 15% 100% 17% 0,74% 25% 21% 2013 Rp22.977.687,00 Rp3.629.554,00 86% 14% 100% 16% 1,07% 23% 20% 2014 Rp24.577.013,00 Rp4.307.622,00 85% 15% 100% 18% 0,38% 21% 18% 2015 Rp23.865.950,00 Rp3.772.410,00 86% 14% 100% 16% 0,54% 18% 15%
5 ITMG 2011 Rp10.808.040,00 Rp4.976.700,00 68% 32% 100% 46% 0,30% 51% 35% 2012 Rp10.024.170,00 Rp4.888.070,00 67% 33% 100% 49% 0,10% 43% 29% 2013 Rp9.638.550,00 Rp4.282.850,00 69% 31% 100% 44% 0,15% 24% 17% 2014 Rp8.846.200,00 Rp4.258.740,00 68% 32% 100% 48% 0,16% 22% 15% 2015 Rp8.345.570,00 Rp3.438.060,00 71% 29% 100% 41% 0,14% 8% 6%
6 KLBF 2011 Rp6.515.935,00 Rp1.758.619,00 79% 21% 100% 27% 0,58% 24% 19% 2012 Rp7.371.643,00 Rp2.046.314,00 78% 22% 100% 28% 0,66% 24% 19% 2013 Rp8.499.957,00 Rp2.815.104,00 75% 25% 100% 33% 0,78% 24% 18% 2014 Rp9.764.101,00 Rp2.675.166,00 78% 22% 100% 27% 1,48% 21% 17% 2015 Rp10.938.285,00 Rp2.758.132,00 80% 20% 100% 25% 0,66% 19% 15%
7 LPKR 2011 Rp9.409.018,00 Rp8.850.153,00 52% 48% 100% 94% 0,01% 6% 3% 2012 Rp11.470.106,00 Rp13.399.189,00 46% 54% 100% 117% -0,01% 22% 10% 2013 Rp14.177.573,00 Rp17.122.789,00 45% 55% 100% 121% 0,13% 12% 5% 2014 Rp17.620.829,00 Rp23.705.729,00 47% 63% 109% 135% 0,49% 17% 8% 2015 Rp18.916.764,00 Rp22.409.794,00 46% 54% 100% 118% 0,63% 3% 2%
8 LSIP 2011 Rp5.839.424,00 Rp952.435,00 86% 14% 100% 16% 0,34% 29% 25% 2012 Rp6.279.713,00 Rp1.272.083,00 83% 17% 100% 20% 0,24% 18% 15% 2013 Rp6.613.987,00 Rp1.360.889,00 83% 17% 100% 21% 0,17% 12% 10% 2014 Rp7.337.978,00 Rp1.375.096,00 84% 16% 100% 19% 0,20% 13% 11% 2015 Rp7.002.732,00 Rp1.846.060,00 79% 21% 100% 26% 0,08% 10% 8%
9 SMGR 2011 Rp14.615.096,00 Rp5.046.505,00 74% 26% 100% 35% 0,43% 27% 20% 2012 Rp18.164.854,00 Rp8.414.229,00 68% 32% 100% 46% 0,97% 27% 19% 2013 Rp21.803.975,00 Rp8.988.908,00 71% 29% 100% 41% 2,91% 27% 20% 2014 Rp25.004.930,00 Rp9.326.744,00 73% 27% 100% 37% 3,24% 23% 17% 2015 Rp27.440.798,00 Rp10.712.320,00 72% 28% 100% 39% 2,66% 17% 13%
10 TLKM 2011 Rp60.981.000,00 Rp42.073.000,00 59% 41% 100% 69% 2,88% 25% 16% 2012 Rp66.978.000,00 Rp44.391.000,00 60% 40% 100% 66% 3,52% 27% 18% 2013 Rp77.424.000,00 Rp50.527.000,00 61% 39% 100% 65% 2,23% 26% 17% 2014 Rp85.992.000,00 Rp55.830.000,00 61% 39% 100% 65% 2,40% 26% 16% 2015 Rp93.428.000,00 Rp72.745.000,00 56% 44% 100% 78% 2,52% 26% 16%
11 UNTR 2011 Rp27.503.948,00 Rp18.936.114,00 59% 41% 100% 69% 1,07% 21% 13% 2012 Rp32.300.557,00 Rp18.000.076,00 64,22% 35,78% 100% 56% 1,24% 18% 12% 2013 Rp35.648.898,00 Rp21.713.346,00 62% 38% 100% 61% 0,97% 18% 11% 2014 Rp38.529.645,00 Rp21.777.132,00 63,89% 36,11% 100% 57% 0,94% 13% 8% 2015 Rp39.250.325,00 Rp22.465.074,00 63,60% 36,40% 100% 57% 0,97% 8% 6%
12 UNVR 2011 Rp3.680.937,00 Rp6.801.375,00 35% 65% 100% 185% 0,29% 113% 40% 2012 Rp3.968.365,00 Rp8.016.614,00 33% 67% 100% 202% 0,64% 122% 41% 2013 Rp4.254.670,00 Rp9.093.518,00 32% 68% 100% 214% 0,17% 126% 40% 2014 Rp4.746.514,00 Rp9.534.156,00 33% 67% 100% 201% 0,76% 128% 43% 2015 Rp4.827.360,00 Rp10.902.585,00 31% 69% 100% 226% 0,83% 121% 38%
(Sources: financial statement 2011 – 2015 from idx.co.id)
Tabel 2 Optimal Capital Structure
No Company Code Year ER DR WACC EPS V
1 AALI 2011 83% 17% 25% Rp1.528,00 Rp18.203,95 2012 75% 25% 20% Rp1.530,57 Rp18.152,73 2013 69% 31% 13% Rp1.143,93 Rp17.444,40
2014 64% 36% 14% Rp1.589,91 Rp23.382,87
2015 54% 46% 4% Rp393,15 Rp19.596,44
2 ASII 2011 49% 51% 14% Rp527,00 Rp3.936,69 2012 49% 51% 13% Rp555,00 Rp5.995,07
2013 50% 50% 12% Rp586,00 Rp6.800,13
2014 51% 49% 10% Rp547,00 Rp6.739,82 2015 52% 48% 7% Rp406,00 Rp6.538,56
3 ASRI 2011 46% 54% 11% Rp38,83 Rp820,04 2012 43% 57% 12% Rp70,20 Rp1.177,86 2013 37% 63% 7% Rp85,83 Rp1.908,87
2014 34% 66% 7% Rp117,4 Rp2.769,81
2015 39% 61% 5% Rp104,6 Rp2.425,27
4 INTP 2011 87% 13% 20% Rp977,10 Rp13.281,38 2012 85% 15% 21% Rp1.293,15 Rp16.895,59 2013 86% 14% 20% Rp1.361,02 Rp18.979,53
2014 85% 15% 18% Rp1.437,09 21,091.63
2015 86% 14% 15% Rp1.183,48 19,754.46
5 ITMG 2011 68% 32% 35% $ 0,48 Rp29.383,25
2012 67% 33% 29% $0,38 Rp28.137,90 2013 69% 31% 17% $0,20 Rp24.754,25 2014 68% 32% 15% $0,18 Rp20.687,39 2015 71% 29% 6% $ 0,06 Rp10.677,99
6 KLBF 2011 79% 21% 19% Rp30,00 Rp535,33 2012 78% 22% 19% Rp37,00 Rp753,25 2013 75% 25% 18% Rp41,00 Rp1.250,82 2014 78% 22% 17% Rp42,76 Rp1.575,59
2015 80% 20% 15% Rp44,08 Rp1.615,73
7 LPKR 2011 52% 48% 3% Rp31,56 Rp626,11 2012 46% 54% 10% Rp46,48 Rp821,11
2013 45% 55% 5% Rp112,26 Rp1.174,42
2014 47% 53% 8% Rp53,94 Rp1.003,64 2015 46% 54% 2% Rp23,51 Rp1.171,24
8 LSIP 2011 86% 14% 25% Rp165,00 Rp1.948,27
2012 83% 17% 15% Rp249,00 Rp2.189,22
2013 83% 17% 10% Rp115,00 Rp1.562,47 2014 84% 16% 11% Rp135,00 Rp1.927,05 2015 79% 21% 8% Rp101,00 Rp1.444,84
9 SMGR 2011 74% 26% 20% Rp668,00 Rp8.197,99 2012 68% 32% 19% Rp830,00 Rp11.694,07 2013 71% 29% 20% Rp951,00 Rp14.483,70
2014 73% 27% 17% Rp987,00 Rp14.556,15
2015 72% 28% 13% Rp786,00 Rp11.277,94
10 TLKM 2011 59% 41% 16% Rp768,00 Rp820,04 2012 60% 40% 18% Rp912,00 Rp1.177,86 2013 61% 39% 17% Rp1.012,00 Rp1.908,87 2014 61% 39% 16% Rp1.093,00 Rp2.425,27
2015 56% 44% 16% Rp1.188,00 Rp2.769,81
11 UNTR 2011 59% 41% 13% Rp1.549,00 Rp19.804,98
2012 64.22% 35.78% 12% Rp1.657,00 Rp20.442,21
2013 62% 38% 11% Rp1.296,00 Rp15.882,33 2014 63.89.% 36.11% 8% Rp1.437,00 Rp18.752,00 2015 63.60% 36.40% 6% Rp1.033,00 Rp18.341,49
12 UNVR 2011 35% 65% 40% Rp546,00 Rp14.254,74 2012 33% 67% 41% Rp701,00 Rp20.784,23 2013 32% 68% 40% Rp634,00 Rp25.739,70 2014 33% 67% 43% Rp766,00 Rp28.872,97
2015 31% 69% 38% Rp776,00 Rp37.913,91