International Journal of Applied Business and Economic Research
ISSN : 0972-7302
available at http: www.serialsjournals.com
© Serials Publications Pvt. Ltd.
Volume 15 • Number 19 (Part-II) • 2017
An Analysis of the Determinants of Capital Structure and their
Influence on Firm Value
(A Case Study on Manufacturing Companies Investors in Southeast Asia)
Isfenti Sadalia
1, Saroha Simanjuntak
2and Novi Andrani Butar-Butar
2 1 Faculty of Economics University of Sumatra Utara2 University of Sumatra Utara
Abstract: This study used determinant variables of capital structure. The determinant variables of capital structure are profitability, asset tangibility, growth rate, firm size, non-debt tax shield as independent variables, capital structure as intervening variable and company value as dependent variable. The five variables were used to measure company value directly and also indirectly through capital structure in manufacturing companies in Southeast Asia represented by Indonesia, Malaysia, Singapore, Philippines and Thailand. This study used 211 companies as secondary data and used Eviews application as testing tool. The results of the study indicate that partially in Indonesia, none of the independent variables significantly affect capital structure but growth rate has significant positive effect on firm value. In Malaysia, profitability has significant negative effect on capital structure; firm size has significant positive effect on capital structure; profitability has significant positive effect on firm value; non-debt tax shield has significant negative effect on firm value. In Singapore, firm size has positive and significant impact on capital structure and firm size also has significant positive effect on firm value. In Philippines, asset tangibility has positive effect on capital structure but none of the independent variables affect company value. In Thailand, profitability has significant negative effect on capital structure; firm size has positive effect on capital structure; non-debt tax shield has significant negative effect on company value.
Keywords: profitability, asset tangibility, growth rate, firm size, non-debt tax shield, capital structure, and firm value.
1. INTRODUCTION
if the increase is characterized by a high rate of return on investment to shareholders. In general, company value can be measured by several aspects, one of which is market price of company shares. The market price of company shares reflects overall investor assessment on any equity held. Stock market prices also show central assessment of all market participants; stock market prices act as a barometer of performance of company management. While company value at several manufacturing companies has decreased every year.
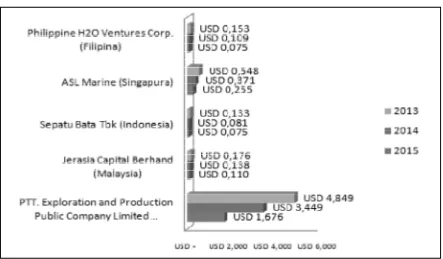
The condition of company, which has dropped the last 3 years can be described as follows:
Figure 1: Diagram of Stock Price of Manufacturing Companies in several countries in Southeast Asia from 2013 to 2015
Figure 1 shows that the value of several manufacturing companies has impaired in Southeast Asia, which represented by five countries, Philippines, Malaysia, Indonesia, Singapore and Thailand. This indicates that there are problems in terms of maintaining company value in Southeast Asia. The factors that affect company value are capital structure policy started since Modigliani and Miller (1958) published the issue of capital structure and it has been one of the topics that interest the academics globally. Capital structure to increase company value is one of the factors that may affect the value of company so that the success of managing its capital structure is very important. Meanwhile, according to earlier researchers, there are several factors that determine capital structure such as profitability, asset tangibility (FATA), growth rate, company size and non-debt tax shield (NDTS). To see these, which are the factors that decide capital structure in manufacturing companies in Southeast Asia, it can be displayed in the following table.
that concluded that profitability has a positive effect on capital structure while (Huang and Song, 2006) concluded that profitability has negative effect on capital structure. When viewed from asset tangibility, there are also different results of research done by (Um, 2001) that concluded that asset tangibility or real asset has positive effect on the capital structure (debt) while (Booth et. al., 2001) concluded that asset tangibility or real assets has negative effect on capital structure (debt).
Regarding growth rate variable, there are different research results between (Booth et. al., 2001, khaddafi et al. 2014) that concluded that growth rate has positive effect on capital structure (debt) while (Chung, 1993) concluded that growth rate has negative effect on capital structure (debt). When viewed from company size, there are also different research results between (Huang & Song, 2006) that concluded that company size has positive effect on capital structure (debt) while (Bevan & Danbolt, 2002) concluded that there is negative relationship between short-term debt and company size. The fifth variable of non-debt tax shield, there are also differences between the results of research by (Moh’d et. al., 1988) that concluded that NDTS has positive effect on capital structure while (Zou and Xiao, 2006) concluded that NDTS has no effect on capital structure.
2. LITERATURE REVIEW 2.1. Firm Value
The value of the company is an investor perception of the company, which often associated with stock prices. High stock prices create value. Companies are also high. According to the company’s main purpose is the theory of the firm to maximize wealth or enterprise value (value of the firm) (Salvatore, 2005).
(Damodaran, 2006) also explains that the objective function in corporate finance is to maximize corporate value that is associated with three company financial decisions, which are investment, financing and dividend decisions. The wealth measures of shareholder focus on company stock performance and try to determine how much wealth increase from one period to next period based on dividends received (Bacidore et. al., 1997).
( ) ( 1)
' OS P D CA
Tobin s Q
Total Asset
Where: OS = Outstanding Share
P = Stock Price D = Total Debt I = Total Inventory CA = Current Assets TA = Total Assets
2.2. Capital Structure
DER is a ratio used to value debt and equity by comparing the entire debt and the entire equity (Kashmir, 2012). According to Mardiyati, et.al, (2012), the debt policy is a company policy on how much a company uses debt financing. There are several theories about debt financing with relation to company value:
1. Theory of Capital Structure from Miller and Modligiani is a theory of modern capital structure known as the theory of MM (1958) that was published in an article entitled “The Cost of Capital, Corporate Finance and The Theory of Investment” in which the article is the most influential financial article ever written by Brigham and Daves (2004)
2. The agency theory/trade-off theory states that capital structure observed is the result of a trade off for tax benefit from the rising of agency cost because of debt ratio approaching critical levels. 3. The pecking order theory asserts that managers have better information on investment opportunities faced by company compared to outside investors (asymmetric information) and managers act in the best interests of shareholders. The pecking order theory shows preference in internal funding sources with consideration of asymmetric information.
4. The signaling model of financial structure assumes the existence of asymmetric information between managers and investors but managers use costly information to distinguish their company with the weaker competitors.
Based on the theory of capital structure described above, the next stage will describe some important factors that should be considered:
( ) Total Olang 100% Debt to Equity Ratio DER
Total Ekuilas
2.3. Profitability (ROA)
Profitability as a benchmark in determining alternative financing, but a way to assess profitability of a company depends on income and assets distributed that is net profit after tax (net income) derived from company operations divided by total assets. Companies that have high profitability will attract investors. Thus, profitability can affect firm value (Soliha and Taswan, 2002; Heikal et al, 2014).
Profitability ratio measured by Return on Assets (ROA) is a measurement of overall company ability in making a profit with the total amount of assets available in the company. Profitability variable as a proxy for Return on Assets (ROA) can affect capital structure and company value, as measured by ratio scale and the amount is expressed in percentage (%), or can be manually calculated with the following formula:
( ) Laba bersih setelah pajak 100% Return on Assets ROA
Total Aktiva
2.4. Asset Tangibility (FATA)
expected to have lower risk of failure and this allows the use of more debt. Several studies in developing countries, such as Um (2001) in Korea found that there is a positive relationship between real assets and debts.
Asset tangibility is one of the most important factors in regard to decisions on capital structure because the number of fixed asset can be pledged as collateral to creditor (Joni and Lina, 2010). The indicators used in this study for asset tangibility variable is fixed assets divided by total assets.
100% Fixed Asset
Asset Tangibility
Total Asset
2.5. Growth Rate
According to Sheikh and Wang (2011), company growth could affect company capital structure. Companies that are increasing growth period show that their funding sources are from debt. However, the phenomena of decreasing sales growth of food and beverages company, the funding sources are likely to remain using debt. Company growth is measured by using sales growth against previous year total sales. According to research by Um (2001), growing companies will be under pressure to finance investment chance in excess of retained earnings in the company, so that in accordance with the pecking order theory, in this case, the company is pleased to use debt rather than equity or in this case the retained earnings. This growth rate can be measured by how many total current assets minus last year total assets divided by last year total assets multiplied by one hundred percent, which is formulated as follows:
1 100%
1 Total Aktiva t Total Aktiva t Tingkat Pertumbuban
Total Aktiva t
2.6. Company Size
The size of company describes the large or small of a company represented by total sales, total assets and average level of sales (Seftianne, 2011). A large company has a larger and wider access to obtain external sources of financing, so to obtain a loan would be easier because it is said that a large company has a greater chance of winning competition and lasting in the industry. The advantage of large company is the size of the company can determine the level of ease to obtain funds from capital market, the company size determines the bargaining power in financial contracts, and there is the possibility that the influence of scale in cost and return make a bigger company can earn more profit (Sawir, 2004). In this study, the researchers used a measuring instrument to measure the company size by using natural logarithm of total assets (Ln. Total Assets).
Ukuran Perusahaan (Size) = Ln. (Total Aset).
2.7. Non-Debt Tax Shield
higher debt tax shields will degrade the company debt level if profits are gained. In this study, non-debt tax shield is a division between total cost of depreciation and amortization and total assets and it can be formulated as follows:
100% Total Biaya Depresiasi dan Amortisasi
Non Debt Tax Shield
Total Aktiva
2.8. Hypothesis
The hypothesis in this study can be explained as follows:
With the ratio of capital structure determinants, which are profitability, asset tangibility, growth rate, firm size, and non-debt tax shield, it makes manufacturing companies to be more careful in managing company capital structure because a little mistake will influence the decision to invest. So, company has its own strategy in managing which capital structure should be considered by countries in Southeast Asia.
H1: There are differences in the effect of profitability, asset tangibility, growth rate, firm size, and non-debt tax shield on capital structure in Southeast Asian countries.
Each company must have a level of difficulty in managing company value to remain stable. In this case, the company businesses are grouped into its location. Indonesia, Malaysia, Philippines, Thailand, and Singapore certainly have a different way of using the ratio of capital structure to maintain company stability. H2: There are differences in the effect of profitability, asset tangibility, growth rate, firm size,
non-debt tax shield and capital structure on company value in Southeast Asian countries.
3. METHODOLOGY 3.1. Research Design
This research is an explanatory research study to test hypotheses about how the effect of profitability, asset tangibility, growth rate, firm size, non-debt tax shield and capital structure in different country. This research was conducted to obtain answers to the hypothesis of the research problems, so that the cause of the problem and how to resolve those problems become clear.
3.2. Sampling
Based on pre-defined criteria, the number of manufacturing companies listed on the Stock Exchange of each country in Southeast Asia in the Financial of Commodity Exchange that has met the population criteria is about 211 companies. This study used a saturated sample (census) using panel data analysis unit or data pooling with the observation period of 3 years from 2013 to 2015 and N = 211 companies so that the number of observations was 633 cases.
3.3. Research Method
4. DATA ANALYSIS AND RESULTS 4.1. Descriptive Statistics
Based on the analysis of descriptive statistics, it illustrates the average value, maximum value, minimum value, standard deviation, and variable observations number of profitability, asset tangibility, growth rate, firm size, capital structure and company value as follows:
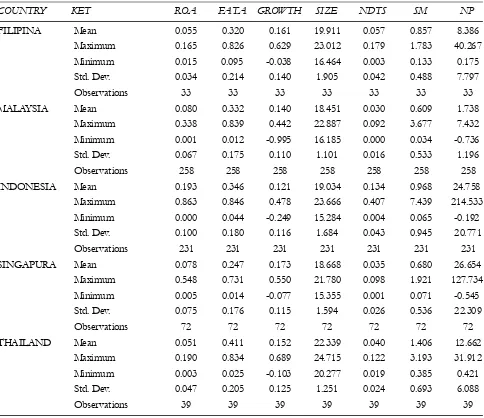
Table 1
Descriptive Statistics of profitability, asset tangibility, growth rate, firm size, Non-Debt Tax Shield, Capital Structure, Company Value
COUNTRY KET ROA FATA GROWTH SIZE NDTS SM NP
FILIPINA Mean 0.055 0.320 0.161 19.911 0.057 0.857 8.386 Maximum 0.165 0.826 0.629 23.012 0.179 1.783 40.267 Minimum 0.015 0.095 -0.038 16.464 0.003 0.133 0.175 Std. Dev. 0.034 0.214 0.140 1.905 0.042 0.488 7.797
Observations 33 33 33 33 33 33 33
MALAYSIA Mean 0.080 0.332 0.140 18.451 0.030 0.609 1.738 Maximum 0.338 0.839 0.442 22.887 0.092 3.677 7.432 Minimum 0.001 0.012 -0.995 16.185 0.000 0.034 -0.736 Std. Dev. 0.067 0.175 0.110 1.101 0.016 0.533 1.196 Observations 258 258 258 258 258 258 258 INDONESIA Mean 0.193 0.346 0.121 19.034 0.134 0.968 24.758
Maximum 0.863 0.846 0.478 23.666 0.407 7.439 214.533 Minimum 0.000 0.044 -0.249 15.284 0.004 0.065 -0.192 Std. Dev. 0.100 0.180 0.116 1.684 0.043 0.945 20.771 Observations 231 231 231 231 231 231 231 SINGAPURA Mean 0.078 0.247 0.173 18.668 0.035 0.680 26.654
Maximum 0.548 0.731 0.550 21.780 0.098 1.921 127.734 Minimum 0.005 0.014 -0.077 15.355 0.001 0.071 -0.545 Std. Dev. 0.075 0.176 0.115 1.594 0.026 0.536 22.309
Observations 72 72 72 72 72 72 72
THAILAND Mean 0.051 0.411 0.152 22.339 0.040 1.406 12.662 Maximum 0.190 0.834 0.689 24.715 0.122 3.193 31.912 Minimum 0.003 0.025 -0.103 20.277 0.019 0.385 0.421 Std. Dev. 0.047 0.205 0.125 1.251 0.024 0.693 6.088
Observations 39 39 39 39 39 39 39
Source: Data processed by Eviews 7 Software (2016)
ratio in each country in Southeast Asia can be seen from the maximum and minimum values. Table 1 also shows that the manufacturing company of the five countries that have the highest profitability value is the company of Surya Toto Indonesia (Indonesia) and the lowest profitability is the company of Star Petrochem Tbk (Indonesia). Company that has the highest ratio value of asset tangibility is the company of Roda Vivatex Tbk (Indonesia) and the lowest is the company of YTL Land & Development Berhand (Malaysia). Company that has the highest growth rate ratio is the company of Banpu Public Company Limited (Thailand) and the lowest was Boilermech Holding Berhand (Malaysia).
Company that has the highest ratio of firm size is PTT Public Company Limited (Thailand) while the lowest is Inter-Delta Tbk (Indonesia). Company that has the highest ratio of non-debt tax shield is Akasha Wira International Tbk (Indonesia) and the lowest is YTL Land & Development Berhand (Malaysia). Company that has the highest ratio of capital structure is Jembo Cable Company Tbk (Indonesia) while the lowest is Jasa Kita Berhand (Malaysia). Company that has the highest ratio of company value is Indopoly Swakarsa Industry Tbk (Indonesia) and the lowest is Xingquan Int Sports Holdings Lmd (Malaysia).
4.2. Results on the Relationship between Factors.
To determine the different effect of profitability, asset tangibility, growth rate, firm size and non-debt tax shield on capital structure, it can be seen in the processing results in the following table:
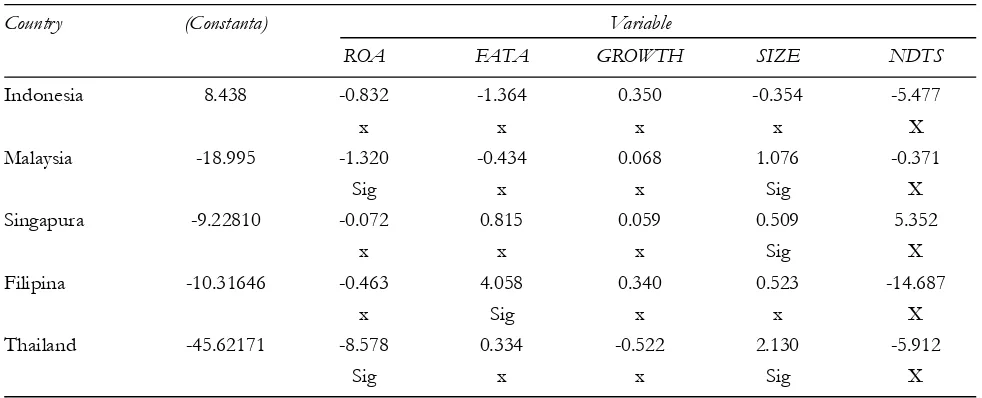
Table 2
Significance Partial Test of Each Country on Capital Structure
Country (Constanta) Variable
ROA FATA GROWTH SIZE NDTS
Indonesia 8.438 -0.832 -1.364 0.350 -0.354 -5.477
x x x x X
Malaysia -18.995 -1.320 -0.434 0.068 1.076 -0.371
Sig x x Sig X
Singapura -9.22810 -0.072 0.815 0.059 0.509 5.352
x x x Sig X
Filipina -10.31646 -0.463 4.058 0.340 0.523 -14.687
x Sig x x X
Thailand -45.62171 -8.578 0.334 -0.522 2.130 -5.912
Sig x x Sig X
Source: Research, Data processed (2016)
In Malaysia and Thailand, profitability has partial significant negative effect on capital structure. This shows that manufacturing companies in Malaysia and Thailand, its profitability could negatively affect capital structure, which means that the larger the profit of a company, the more debt will be covered. With large retained earnings, company will be more than happy to use retained earnings before using debt. This is in accordance with the pecking order theory, which suggests that managers prefer using first financing of retained earnings, then debt and then sale of new shares. Bevan & Danbolt (2002) state that the higher profit of a company, the greater internal funds so that the use of debt should be reduced.
In Philippines, asset tangibility has partial positive and significant impact on capital structure. This shows that in Philippines, manufacturing companies obtain debt funding faster if it has a large fixed assets. This is because the larger the fixed assets of a company, it will be able to convince creditors (banks) to provide large amounts of debt. If company fails to meet its obligations, then the assets will be seized by creditors to pay their obligations but the company can be saved from bankruptcy. Myers (1984) states that the issuance of debt secured by the assets will reduce asymmetric information with regard to financing costs.
In Malaysia, Singapore and Thailand firm size has partial significant positive effect on capital structure. It shows that it is very easy for big company to get debt in Malaysia, Singapore and Thailand. Baven & Danbolt (2002) also found that large size companies tend to use more debt because they are considered ‘too big to fail’ so that they have good access to capital markets. The variables of growth rate and non-debt tax shield are not able to influence capital structure in the five countries in this research. It shows that big or small debt of a company is not affected by the increase in company assets and its tax savings.
To determine the different effect in profitability, asset tangibility, growth rate, firm size, non-debt tax shield and capital structure on company value, it can be seen in the processing results in the following table:
Table 3
Partial Significance Test in Each Country on Company Value
Country Variable
(Constanta) ROA FATA GROWTH SIZE NDTS Capital Structure Indonesia 145.759 2.361 -3.895 9.384 -7.344 7.131 -0.534
x x Sig x x x
Malaysia 0.024 0.098 0.028 0.006 -0.548 -0.028 -0.001
Sig x x x Sig x
Singapura 1192.212 -4.392 -6.470 -9.157 -63.952 303.374 0.377
x x x Sig x x
Filipina 49.27766 -14.793 -63.597 5.440 -1.696 351.504 -5.679
x x x x x x
Thailand 51.58479 4.276 12.409 0.793 -2.059 -189.766 -0.490
x x x x Sig x
Source: Data processed by Eviews 7 Software (2016)
(2007) adds that high profitability shows good prospects for companies that responded positively by investors and has impact on increasing company value.
In Indonesia, growth rate has partial significant positive effect on firm value. This shows that in Indonesia the increase in assets will be influential to the increase in firm value. Company growth can also result in changes in firm value such as high growth rate, good company image in the eyes of investors and increase in firm value.
In Singapore, firm size has partial significant negative effect on company value. This shows that the larger the manufacturing companies in Singapore, the less the value of company. This suggests that investors who invest in manufacturing companies in Singapore are the type that avoids risk. Because the larger the company, the larger the capital that will be spent to invest. This will have a huge risk if one day the company goes bankrupt.
In Malaysia and Thailand, non-debt tax shield has partial negative effect on company value. This suggests that tax savings will decrease company value in the eyes of investors. Asset tangibility and capital structure are unable to influence company value in the five countries in this research. This shows that the large or small company value (stock price) is not affected by large or small increase in fixed assets and amount of debt owned by company.
4.3. Determination Results of Capital Structure Test
To see how much influence of profitability, asset tangibility, growth rate, firm size, non-debt tax shield on capital structure of each country in Southeast Asia, it will be shown in the following table:
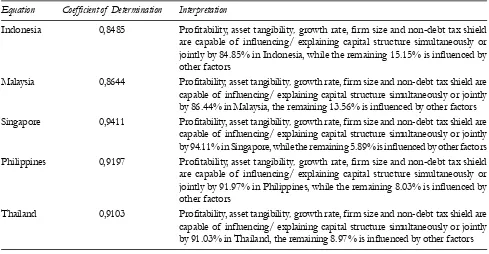
Table 4
Coefficient of Determination for the Influence of Profitability, Asset Tangibility, Growth Rate, Firm Size, Non-Debt Tax Shield on Capital Structure
Equation Coefficient of Determination Interpretation
Indonesia 0,8485 Profitability, asset tangibility, growth rate, firm size and non-debt tax shield are capable of influencing/ explaining capital structure simultaneously or jointly by 84.85% in Indonesia, while the remaining 15.15% is influenced by other factors
Malaysia 0,8644 Profitability, asset tangibility, growth rate, firm size and non-debt tax shield are capable of influencing/ explaining capital structure simultaneously or jointly by 86.44% in Malaysia, the remaining 13.56% is influenced by other factors Singapore 0,9411 Profitability, asset tangibility, growth rate, firm size and non-debt tax shield are
capable of influencing/ explaining capital structure simultaneously or jointly by 94.11% in Singapore, while the remaining 5.89% is influenced by other factors Philippines 0,9197 Profitability, asset tangibility, growth rate, firm size and non-debt tax shield are capable of influencing/ explaining capital structure simultaneously or jointly by 91.97% in Philippines, while the remaining 8.03% is influenced by other factors
Table 4 shows how big the influence of the variable of profitability, asset tangibility, growth rate, firm size and non-debt tax shield that are capable of influencing/explaining the capital structure of each country. The most powerful influence is in Singapore and the weakest is in Indonesia.
4.4. Determinations Result of Capital Structure Test
To see how much influence of profitability, asset tangibility, growth rate, firm size, non-debt tax shield on capital structure of each country in Southeast Asia, it will be shown in the following table:
Table 5
The Coefficient of Determination for the Influence of Profitability, Asset Tangibility, Growth Rate, Firm Size, Non-Debt Tax Shield, Capital Structure on Company Value
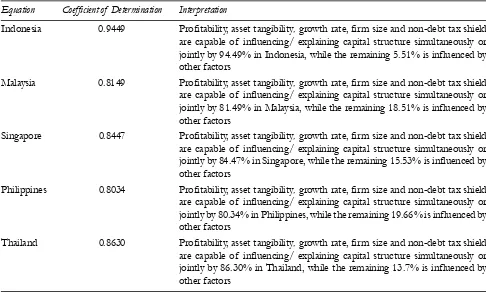
Equation Coefficient of Determination Interpretation
Indonesia 0.9449 Profitability, asset tangibility, growth rate, firm size and non-debt tax shield are capable of influencing/ explaining capital structure simultaneously or jointly by 94.49% in Indonesia, while the remaining 5.51% is influenced by other factors
Malaysia 0.8149 Profitability, asset tangibility, growth rate, firm size and non-debt tax shield are capable of influencing/ explaining capital structure simultaneously or jointly by 81.49% in Malaysia, while the remaining 18.51% is influenced by other factors
Singapore 0.8447 Profitability, asset tangibility, growth rate, firm size and non-debt tax shield are capable of influencing/ explaining capital structure simultaneously or jointly by 84.47% in Singapore, while the remaining 15.53% is influenced by other factors
Philippines 0.8034 Profitability, asset tangibility, growth rate, firm size and non-debt tax shield are capable of influencing/ explaining capital structure simultaneously or jointly by 80.34% in Philippines, while the remaining 19.66% is influenced by other factors
Thailand 0.8630 Profitability, asset tangibility, growth rate, firm size and non-debt tax shield are capable of influencing/ explaining capital structure simultaneously or jointly by 86.30% in Thailand, while the remaining 13.7% is influenced by other factors
Source: Processed from eviews results (2016)
Table 4 shows how big the influence of the variable of profitability, asset tangibility, growth rate, firm size and non-debt tax shield and capital structure that are capable of influencing/explaining the value of companies in each country. The most powerful influence is in Indonesia and the weakest is in Philippines.
5. CONCLUSIONS AND RECOMMENDATIONS
Partially, there are differences in the effect of profitability, asset tangibility, growth rate, firm size, non-debt tax shield on capital structure of manufacturing companies in countries in Southeast Asia.
In Indonesia, partially, there are no variables that affect company value. Growth rate has positive significant effect on firm value. In Malaysia, partially, profitability and firm size have significant effect on capital structure. Profitability and non-debt tax shield have significant effect on company value. In Singapore, partially, firm size significantly influences capital structure and company value. In Philippines, partially, asset tangibility has significant effect on capital structure but none of the variables influence company value in Philippines. Thailand, partially, profitability and firm size have significant effect on capital structure. Non-debt tax shield has significant effect on company value.
The next researchers should use more indicators compared to this research. Other determinant variables of capital structure can be added such as liquidity, business risk, dividend policy and currency exchange rate if the study is in more than one country.
REFERENCES
Abor, Joshua. (2007), Debt policy and performance of SMEs: Evidence from Ghanaian and South African firms. Journal of Risk Finance. Vol. 8 No. 4: 364-379.
Bacidore, J. M., Boquist, J. A., Milbourn, T. T and Thakor, A. V. (1997), The Search for the Best Financial Performance Measure. Financial Analysts Journal. Vol. 53 No. 3: 11-20.
Bevan, Alan and Danbolt, Jo. (2007), Capital Structure and Its Determinants in the UK: A Decompositional Analysis. Journal Applied Financial Economics. Vol12 No. 3: 159-170.
Booth, Laurence., Aivazian, Varouj., Demirguc-Kunt, Asli and Maksimovic, Vojislav. (2001), Capital Structures in Developing Countries. Journal of Finance. Vol. 56 No. 1: 87-130.
Brigham, Eugene F. and Daves, Philip R. (2004), Intermediate Financial Management, 8 th Edition. South-Western: Thomson. Chung, Kee. H. (1993), Asset Characteristics and Corporate Debt Policy: An Empirical Test. Journal of Business Finance and
Accounting. Vol. 20 No. 1: 83-98.
Damodaran, A. (2001), Corporate Finance: Theory and Practice (2 ed.). New York: Wiley.
Heikal Mohd, Khaddafi Muammar, Ummah Ainatul (2014), “Influence Analysis of Return on Assets (ROA), Return on Equity (ROE), Net Profit Margin (NPM), Debt To Equity Ratio (DER), and current ratio (CR), Against Corporate Profit Growth In Automotive In Indonesia Stock Exchange” International Journal of Academic Research in Business and Social Sciences December 2014, Vol. 4, No. 12 ISSN: 2222-6990.
Huang, Guihai and Song, Frank. M. (2006), The Determinants of Capital Structure: Evidence from China. China Economic Review. Vol. 7 No. 7: 14-36.
Huang, Samuel. G. H. and Song, Frank. M. (2002), The Determinants of Capital Structure: Evidence from China. HIEBS (Hong Kong Institute of Economics and Business Strategy) Working Paper. The University of Hongkong, Pokfulam Road. Hongkong.
Joni dan Lina. (2010), Faktor-faktor yang Mempengaruhi Struktur Modal. Jurnal Bisnis dan Akuntansi. Vol. 12 No. 2: 81-96. Kasmir. (2012), Analisis Laporan Keuangan. Jakarta: Raja Grafindo Persada.
Khaddafi Muammar, Fatma Ade, Amalia Khaira and Rahmanta. (2014), “The Effect of Earnings Aggressiveness, Earning Smoothing on Return of Stock”Journal of Economics and Behavioral Studies. Vol 6, No.6. June 2014. ISSN.2220.6140. Mardiyati, Umi., Ahmad, Gatot Nazir dan Putri, Ria. (2012), Pengaruh Kebijakan Dividen, Kebijakan Hutang Dan Profitabilitas Terhadap Nilai Perusahaan Manufaktur Yang Terdaftar Di Bursa Efek Indonesia (BEI) Periode 2005-2010. Jurnal Riset Manajemen Sains Indonesia (JRMSI). Vol. 3 No. 1: 1-17.
Moh’d, Mahmoud A. Larry G. Perry., and James N. Rimbey. (1998), The Impact of Ownership Structure On Corporate Debt Policy: a Time-Series Cross-Sectional Analysis. The Financial Review. Vol. 33 No. 3: 85-98.
Muhajir dan Triyono. (2010), Faktor-Faktor yang Memepengaruhi Struktur Modal Perusahaan Manufaktur pada Bursa Efek Indonesia Periode 2005-2009. Jurnal Bisnis dan Akuntansi. Vol.7 No. 1: 1-19.
Myer, S. C and Nicholas S. M. (1984), Corporate Financing and Investment Decisions When Firms Have Information That Investors Do Not Have. Journal of Financial Economics. Vol. 13 No. 1: 187-221.
Sawir, Agnes. (2004), Kebijakan Pendanaan dan Resrukturisasi Perusahaan. Jakarta: PT. Gramedia Pustaka Utama.
Seftianne dan Handayani, Ratih (2011), Faktor-Faktor Yang Mempengaruhi Struktur Modal Pada Perusahaan Publik Sektor Manufaktur. Jurnal Bisnis dan Akuntansi. Vol. 13 No. 1: 39-56.
Sheikh, N.A., dan Zongjun, W. (2011), Determinants of Capital Structure An Empirical Study of Firms in Manufacturing Industry of Pakistan. Journal of Managerial Finance. Vol. 37 No. 2: 117–133.
Soliha, Euis dan Taswan. (2002), Pengaruh Kebijakan Hutang terhadap Nilai Perusahaan serta Beberapa Faktor yang Mempengaruhinya. Jurnal Bisnis dan Ekonomi. Vol. 9 No. 2: 149-163.
Sujoko dan Ugy Soebiantoro. (2007), Pengaruh Struktur Kepemilikan Saham, Leverage, Faktor intern dan Faktor Ekstern terhadap Nilai Perusahaan. Dalam Jurnal Manajemen dan Kewirausahaan Vol. 9 No. 1: 41-48.
Um, Times. (2001), Determination of Capital Structure and Prediction of Bankruptcy in Korea. Thesis. Cornell University. Korea.
Wild, John J., Subramanyam, K.R., Halsey, Robert F.(2005), Financial Statement Analysis- Analisis Laporan Keuangan.Edisi 8.
Jakarta: SalembaEmpat.