Jurnal Administrasi Bisnis (JAB)|Vol. 57 No. 1 April 2018| administrasibisnis.studentjournal.ub.ac.id
22
THE INFLUENCE OF CAPITAL STRUCTURE AND PROFITABILITY ON
FIRMS’ VALUE
(Study at Property, Real Estate, and Building Construction Sector Listed in Indonesia
Stock Exchange during the Periods of 2014-2016)
Qurrata A’yun Suhadak
Faculty of Administrative Science Brawijaya University
Malang
Email : [email protected]
АBSTRАK
Penelitian ini dilakukan mengingat pentingnya penentuan struktur modal dan profitabilitas dalam menjaga nilai perusahaan untuk mengirimkan sinyal positif pada investor, dan sebagai bahan pertimbangan investor untuk berinvestasi pada suatu perusahaan. Nilai perusahaan merupakan faktor penting yang diperhatikan oleh manager, mengingat nilai perusahaan merupakan hal pertama yang akan dilihat dari suatu perusahaan. Penelitian ini dilakukan pada sektor property, real estate, dan building constraction yang terdaftar di Bursa Efek Indonesia (BEI) periode 2014-2016, mengingat tingginya minat investor terhadap sektor ini, dan juga karena sektor ini merupakan sektor yang dapat mencerminkan perekonomian nasional. Hasil penelitian ini menunjukkan bahwa terdapat pengaruh yang signifikan, dengan arah negatif dari struktur modal terhadap profitabilitas. Hal ini menunjukkan bahwa, semakin besar tingkat struktur modal, maka semakin kecil tingkat profitabilitas yang dimiliki oleh perusahaan, begitu pula sebaliknya. Selanjutnya, hasil penelitian ini menunjukkan bahwa tidak ada pengaruh signifikan antara profitabilitas terhadap nilai perusahaan, begitu pula dengan struktur modal, penelitian ini juga menunjukkan bahwa tidak ada pengaruh signifikan antara struktur modal terhadap nilai perusahaan. Hal ini menunjukkan bahwa nilai perusahaan untuk sektor
property, real estate, dan building constraction pada periode penelitian tidak dipengaruhi oleh struktur modal dan profitabilitas.
Kаtа Kunci: Struktur Modal, Profitabilitas, Nilai Perusahaan
ABSTRACT
This research is conducted according to the importance of capital structure policy and profitability in
managing firms’ value in order to send positive signal to investors, also as a consideration for investors before investing in certain company. Firms’ value is an important factor that should be managed by managers, considering firms’ value is the first factor that will be seen from a company. This research is conducted in property, real estate, and building constraction sector listed in Indonesia Stock Exchage (IDX) during the periods of 2014-2016, considering high demand of this sector, and also this sector depicts the scale of national economy. The result of this research shows that there is a significant influence with negative direction of capital structure on profitability. This result shows that the greater capital structure, the lower profitability, vice versa. The result of this research also shows that there is no significant influence
of profitability on firms’ value, so does the capital structure. There is no significant influence of capital structure on firms’ value. According to this result, firms’ value of property, real estate, and building
constraction sector listed in Indonesia Stock Exchange during the periods of 2014-2016 is not influenced by capital structure and profitability.
Jurnal Administrasi Bisnis (JAB)|Vol. 56 No. 1 Maret 2018| administrasibisnis.studentjournal.ub.ac.id
23 INTRODUCTION
Firms’ value is a reflection of company’s achievement as an indicator of shareholders’ trust over company since company exist. In support, (Fibriyanto, 2015 : 2) stated that firms’ value is a perception of shareholders over company, which mostly indicated by stock price and company’s profitability. Therefore, firms’ value is an indicator of company’s capability to manage the resources, thus company can attract investors. It also depict company’s ability on resulting profit for shareholders.
Companies measure firms’ value through several ratios which depict its value, in this research, author attemps to depict firms’ value based on two indicators, which are closing price and Tobin’s Q. The reason author choose closing price as an indicator is closing price is the reflection of investor’s demand upon firm’s stock. With this statement, investors who are profit oriented will invest in a company which has high value thus they can get a high profit. High value in this case comes from company’s management to operates its capital to gain profit as high as posible.
Firms’ value can be measured by several indicators, in this research, firms’ value will be measured by closing price and Tobin’s Q. The reason author choose closing price is that closing price reflects investors’ point of view on firms’ value. Since closing price is influenced by trading demand, then higher closing price shows higher demand of investors, which indicates the good respons from investor. As conclusion, closing price reflected the operation of a company which related to debt and firm’s capital (Ningtyas, 2014 : 3).
Company manages operation needs through capital and funding optimization, both internal or external capital. Company gets internal capital from personal assets or retained earning (equity). External capital is derived from creditors and investors. “The mixture of debt and equity is called capital structure” (Brigham and Daves, 2007 : 508).
A firm’s optimal capital structure is defined as the structure that would maximize its stock price. Firms generally study the situation, reach a conclutsion as to the optimal structure, and then set a target capital structure. The mix of debt,
preferred stock, and common equity with which the firm plans to raise capital is called target capital structure. (Brigham & Houston, 2007 : 437)
In this research, author attemps to measure capital structure through Debt to Assets ratio (DAR) and Debt to Equity ratio (DER). The DAR and DER used in this research is that these indicators describe the comparison between debt and personal assets (can be equity or assets in general). This ratio describe how a company able to guarantee its debt through its capital.
Modigliani and Miller (MM) Theory argue that in some cases of profit optimization, companies may prefer debt rather than equity due to tax deductability. In contrast, Trade-off theory stated that hight debt of company will decrease company’s capital structure and its profitability. “Profitability is the reflection of the net result of all financing policies and operating decision” (Brigham and Houston, 2007 : 112). This shows that it is important for companies to maintain the sustainability of its profitability to show the good governance of company’s operation. Profitability is one of the factor which influence the firm’s value. Company tends to maintain its profit as high as posible to get a high firm’s value as well.
The indicators of profitability in this research are Return on Assets (ROA), Return on Equity (ROE), and Net Profit Margin (NPM). The reason these ratios are choosen is that Return on Assets (ROA) depicts the comparison between company’s earning and its asset. Return on Equity (ROE) which compare company’s earning and its equity shows the ability of company to manage its equity. Net Profit Margin (NPM) depicts the comparison between company’s earning and its sales. The explenations above describe that those indicators depicts the companies’ performance to operate capital, so those indicators are right to measure profitability because it shows the description on how companies manage its capital.
Jurnal Administrasi Bisnis (JAB)|Vol. 56 No. 1 Maret 2018| administrasibisnis.studentjournal.ub.ac.id
24 constraction sector. This sector has more stable
trading demand compare to others as well has good respons from investors due to closing prices and trading volume of this sector.
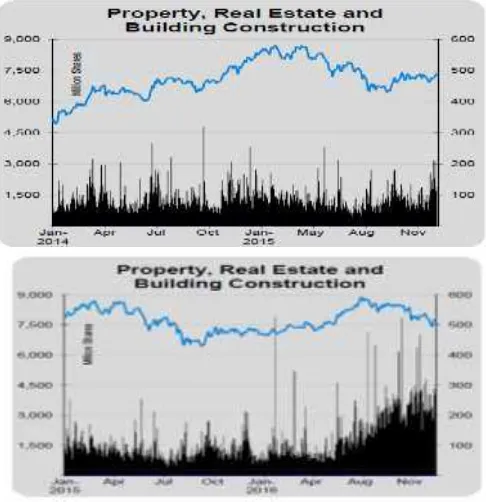
Wicaksono in Putra (2014 : 2) stated that the additional benefit that investors get from investing in property, real estate, and building construction companies is that this sector provides a chance to invest in small amount of capital, keep favorable, and one of the source of passive income. On the other hand, property, real estate, and building constraction sector depicts the national economic rate, since this sector concern in physical building and assets of the nation. This statement shows that beside depicts current development condition of a nation, property, real estate, and building construction companies also provides good insight of investment due to well firm’s value. Supporting this argument, statistics of annual trading property, real estate, and building construction companies also show good demand of its stock that can be seen in figure 1.
Figure 1 : Property, Real Estate, and Building
Construction trading movements
2014-2016
Source : Indonesia Stock Exchange (www.idx.co.id)
Figure above shows that property, real estate, and building constraction sector has good volume of trading, proved by the statistic is showing its shares consistently increase yearly. It shows that this sector has high demand. Supporting this figure, this sector also achieved the 4th place of the highest traving volume according to Jakarta Composite Index and Sectoral Indices Movements showing by the figure below.
Figure 2 : Jakarta Composite Index and Sectoral Indices Movements 2015-2016.
Source : Indonesia Stock Exchange (www.idx.co.id)
Figure above explained that property, real estate, and building construction achieved the 4th place of trading volume under trade, service and investment sectors, consumer goods sectors, and finance sectors. This figure shows that property, real estate, and building construction contribute to the volume of trading in Indonesia Stock Exhange with total amount 18,17%. It means that this sector contributes to trading volume of Indonesia Stock Exchange, and showing that this sector is one of the sector that has high trading demand.
This sector currently is one of the most important sector for economy rates of a nation. This sector can be an indicator to analyze current condition of national economy due to this sector concern in physical building and assets of a nation. It means that the increasing demand for property, real estate, and building construction sector, the greater development in a country. It means that property, real estate, and building constraction companies have big power to indicate whether or not a nation has good development.
LITERATURE REVIEW Capital Structure
Capital structure is the mixture between debt and assets owned by companies. Capital structure can be measured through several indicators. This research measures capital structure through two indicators, which are debt to assets ratio (DAR) and debt to equity ratio (DER), because both ratios shows the ability of company to guarantee its debt through its assets.
1) Debt to Total Assets Ratio (DAR)
Jurnal Administrasi Bisnis (JAB)|Vol. 56 No. 1 Maret 2018| administrasibisnis.studentjournal.ub.ac.id
25 Source : Syamsuddin (2013 : 54)
2) Debt to Equity Ratio (X2 : DER)
Debt to equity ratio measures the rate of use of company’s debt compare to its equity. This ratio shows company’s ability to guarantee its debt by its equity.
Source : Syamsuddin (2013 : 54) Profitability
Profitability is the ability of companies to generate profit from its assets. Profitability can be measured by several ratios. This research measures profitability through return on assets (ROA), return on equity (ROE), and net profit margin (NPM).
1) Return on Assets (ROA)
Return on assets is a measurement of company’s ability in general to generate profit according to total assets of company. ROA is measured by comparing net profit of company over its total assets.
Source : Syamsuddin (2013 : 63) 2) Return on Equity (Y1,2 : ROE)
Return on equity is measured by comparing company’s net profit over its equity (Van Horne and Wachowiz, 2010 : 225). This ratio shows company’s ability on generating profit according to its equity.
Source : Syamsuddin (2013 : 65) 3) Net Profit Margin (Y1,3 : NPM)
Net profit margin measures company’s ability to generate net profit on particular level of sales. NPM is measured by comparing company’s net profit after tax over its sales.
Source : Syamsuddin (2013 : 73)
Firms’ Value
Firms’ value is the parameter of company’s performance, reflecting the companies achievement as indicator of shareholders’ trust over companies. This research measures firms’ value through closing price and Tobin’s Q.
1) Closing Price (Y2,1 : CP)
Closing price defines as latest stock price at the end of trading. Closing price is increased as well the demand of stock, thus it shows the volume of trading of particular company.
2) Tobin’s Q Ratio (Y2,2: Tobin’s Q)
Tobin’s Q ratio is the best ratio to give information of firm’s value due to it provides company valuation from market point of view since Tobin’s Q ratio include all important factors related to debt and firm’s capital. The formula of Tobin’s Q ratio as follows :
Souce : Ningtyas (2014)
Hypotheses
Figure 3. Research Hypotheses
H1 : Capital structure has an influence on profitability.
H2 : Profitability has an influence on firms’ value. H3 : Capital Structure has an influence on firms’
value.
RESEARCH METHOD
Research type used in this research is an explanatory with quantitative approach. The location of this research is conducted on official website of Indonesian Stock Exchange, which
www.idx.co.id. This location is chosen because it provides valid data through several information such as financial data including financial ratio of firms which is needed by author to conduct this research. Population in this research are property, real estate, and building construction companies
H3
H2
H1
DAR = Total Assets x Total Debt %
DER = Total DebtEquity x %
ROA = Earning After Tax
Total Assets x %
ROE = Earning After TaxTotal Equity x %
NPM = Earning After TaxNet Sales x %
� �� ′� � = �� +
��
Profitability Y1
Firms’ Value
Y2
Capital Structure
Jurnal Administrasi Bisnis (JAB)|Vol. 56 No. 1 Maret 2018| administrasibisnis.studentjournal.ub.ac.id
26 listed in Indonesia Stock Echange during the
periods of 2013-2015. The reason why author chooses this sector as the population due to this sector depict the economy level and development of a nation. The amount of population in this research are 63 companies and the amount of samples in this research ard 13.
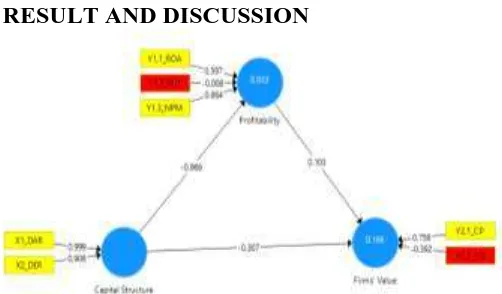
RESULT AND DISCUSSION
Figure 4 : PLS Path Model before bootstraping (Outer Loading)
Source : Result processed by author (2017) \
Table 1 : Result of Indicators testing
Original
Sample
t Statistics
P Values X1_DAR ->
Capital Structure 0.999 15.885 0.000
X2_DER ->
Capital Structure 0.906 14.420 0.000
Y1,1_ROA ->
Profitability 0.597 3.848 0.000
Y1,2_ROE ->
Profitability -0.008 0.037 0.971
Y1,3_NPM ->
Profitability 0.864 10.496 0.000
Y2,1_CP ->
Firms' Value 0.758 1.351 0.177
Y2,2_TQ ->
Firms' Value -0.392 0.569 0.569
Source : Data Proccessed by Author (2017)
Figure 5 : Outer Loading Exclude nonsignificant indicators
Source : Data processed by author (2017)
Table 2 : Inner Loading Result
Original
Sample
t Statistics
P Values
Description
Capital Structure ->
Firms' Value -0.204 0.619 0.536*
Insignificant
Capital Structure ->
Profitability -0.855 22.147 0.000
Significant
Profitability ->
Firms' Value 0.140 0.350 0.726*
Insignificant
Source : Data Proccessed by author (2017)
Table 3 : Result of R Square calculation
R Square
Firms' Value 0.110 Profitability 0.731
Source : Data Proccessed by author (2017)
Predictive-relevance (Q2) value obtained by the formula :
Q2 = 1- (1-R12)(1-R22)...(1-Rp2) Q2 = 1- (1-0,110)(1-0,731) Q2 = 1 – 0,23941
Q2 = 0,76059
The calculation result shows the predictive-relevance (Q2) value of 0,76059 or 76,059% so that the model has the relevant predictive value. The predictive-relevance value (Q2) indicated that the diversity of data obtained by the model is 76,059% or in other words the information contained in the data of 76,059% can be explained by the model. The remaining 23,941% is explained by other variables that have not been contained in the model and error.
The Influence of Capital Structure on Profitability
The indicators of capital structure which are reliable to measure this variable are debt to assets ratio and debt to equity ratio. The dominant indicator of capital structure is debt to assets ratio. Since companies tend to guarantee its debt through assets, which also shows the reliability of its assets, whereas investors tend to believe on companies which have big amount of assets to guarantee its debt, thus no wonder that debt to assets ratio become the dominant indicators of capital structure.
Jurnal Administrasi Bisnis (JAB)|Vol. 56 No. 1 Maret 2018| administrasibisnis.studentjournal.ub.ac.id
27 profit generated by companies. In the situation of
company that has big amount of debt, companies have to pay bigger debt’s interest, in contrast, the lower amount of debt will give company exclusive benefit which lower debt’s interest that can generate more profit since there is a less interest to pay. On the other hand, the increasing capital structure will increase financial risk for the company since company has responsibility to pay interest and installments to creditors. This result is supported by Safitri (2014) which showed that capital structure has negative significant influence on profitability. This research also support pecking order theory which argues that there is a negative relationship between profit and debt. However, this result does not support Christi, et al. (2015) in which found that partially, debt to assets ratio has positive significant influence on profitability.
The Influence of Profitability on Firms’ Value The indicators of profitability which are reliable to measure this variable are return on assets, return on equity, and net profit margin. The dominant indicator of profitability is Net Profit Margin. Net Profit Margin shows net earning after interest and tax against the volume of sales. It shows the margin of net income of the companies which also the first thing that being seen by investor.
This research shows the result that there is an insignificant influence of profitability on firms’ value. It shows that the greater or the lower firms’ value is not influenced by its profitability. This condition happens due to current investors are no longer influenced by profit of company, otherwise investors observe the closing price as the first factor to invest. This condition is supported by the result of outer loading, that closing price has the most significant influence on firms’ value. It indicated that the influencing factor of firms’ value is determined but closing price, therefore the higher and the lower firms’ value is influenced by the higher or the lower closing price. The reason why closing price currently being the first factor for investor to invest is that the higher closing price shows the higher trading volume of particular company, which give positive signal to investors that the company is favorable to be invested. This result supports Cahyanto (2014) which found that partially, profitability which is measured by ROI and EPS has no significant effect on firms’ value which is measured by Tobin’s Q ratio. However, this result does not support Safitri (2014) which found that profitability has significant and positive
influence on firms’ value. This result also does not support Fibriyanto (2015) which found that profitability partially has significant positive influence on firms’ value.
The Influence of Capital Structure on Firms’ Value
The indicators of capital structure which are reliable to measure this variable are debt to assets ratio and debt to equity ratio. The dominant indicator of capital structure is debt to assets ratio. Since companies tend to guarantee its debt through assets, which also shows the reliability of its assets, whereas investors tend to believe on companies which have big amount of assets to guarantee its debt, thus no wonder that debt to assets ratio become the dominant indicators of capital structure.
This research shows that capital structure has insignifficant effect on firms’ value. It means that the higher or lower firms’ value is not influenced by capital structure. This result support net operating income approach that explained that capital structure has no influence on firms’ value. (Sudana, 2009 in Parhusip, 2016) argued that net operating income approach explained that regardless the amount of debt used by the company in the expenditure of the company, the value of the firm does not change. This result also supports Windyaningrum (2017) which found that partially, debt ratio has no significant influence on stock price. However, this result does not support Safitri (2014) which found that capital structure has significant and negative influence on firms’ value.
CONCLUSION AND SUGGESTION Conclusion
Jurnal Administrasi Bisnis (JAB)|Vol. 56 No. 1 Maret 2018| administrasibisnis.studentjournal.ub.ac.id
28 influenced by profitability. This situation
occurs because investors currently observe firms’ value through its closing price, therefore higher or lower profit is no longer being the factor that is seen by investors. This result supports Cahyanto (2014) which found that partially, profitability which is measured by ROI and EPS has no significant effect on firms’ value which is measured by Tobin’s Q ratio. However, this result does not support Safitri (2014) which found that profitability has significant and positive influence on firms’ value. This result also does not support Fibriyanto (2015) which found that profitability partially has significant positive influence on firms’ value.
3. There is no significant influence of capital structure on firms’ value. This situation occurs because most of investors would be valuing the closing price of companies compared to the debt of companies. This result support net operating income approach that explained that regardless the amount of debt used by the company in the expenditure of the company, the value of the firm does not change. This result also supports Windyaningrum (2017) which found that partially, debt ratio has no significant influence on stock price. However, this result does not support Safitri (2014) which found that capital structure has significant and negative influence on firms’ value.
Suggestion
1. For companies
In order to increase the firms’ value of company, managers should pay more attention on decisions in order to increase closing price. As seen in the research’s result, closing price has significant influence as an indicator of firms’ value. This result can be used by managers to increase profitability through maintaining capital structure. In order to generate higher profit, managers should pay more attention on decisions of capital structure. This research showed that the higher debt will decrease profitability, thus companies should consider to decrease debt in order to increase profitability.
2. For investors
Since capital structure and profitability has no significant influence on firms’ value, investors
should pay more attention on companies’ performance before invest in partuicular companies. Investors are recomended to study the company’s performance before deciding to invest in company. For investors who are profit oriented, which seen the profitability as the first factor before investing in certain company, investor should pay more attention on companies’ capital structure because the higher and lower profitability will be influenced on its capital structure. For investors who are value oriented, which seen firms’ value as the first factor before investing, investor should pay more attention on the stability of closing price because closing price is the indicator that influences firms’ value. 3. For the next researcher
There are actually a lot of variables that can be used to measure capital structure, profitability, and firms’ value. However, this research is limited to use certain indicators as a measurement and only limited to the period of 2014 – 2016. For the next researcher who want to study about capital structure, profitability, and firms value, author highly encourage to add some others variables in order to make the research more valuable and contributive. Further more, the next researchers are recomended to add a longer study periods to produce better research results.
REFERENCE
Brigham, F Eugene, and Daves, P Phillip. 2007.
Intermediate Financial Management.
9th Edition. Manson : Thomson South Western
Brigham, F Eugene, and Ehrhardt, C Michael. 2009. Financial Management. 13rd Edition. South Western : South Western Cengage Learning
Brigham, F Eugene, and Houston, F Joel. 2007.
Fundamental of Financial Management. 11th Edition. Manson : Thomson South Western
Cahyanto, Setiawan Ari, Et al. 2014. Pengaruh Struktur Modal dan Profitabilitas Terhadap Nilai Perusahaan. Jurnal Administrasi Bisnis (JAB) Vol. 11 No.
1 Juni 2014
Jurnal Administrasi Bisnis (JAB)|Vol. 56 No. 1 Maret 2018| administrasibisnis.studentjournal.ub.ac.id
29 Companies (Evidence From India). The
USV Annals of Economics and Public Administration Journal. Vol. 13 Issue 17. Fibriyanto, Danang, Et al. 2015. Analisis Pengaruh
Struktur Modal terhadap Nilai Perusahaan Property dan Real Estate Yang Listing di Bursa Efek Indonesia Tahun 2009-2011. Jurnal Administrasi Bisnis (JAB) Vol. 27 No. 2 Oct 2015 Horne, James C. Van and Wachowicz, M John Jr.
2010. Fundamental of Financial Management Prinsip-Prinsip Manajemen Keuangan. 12th Edition. Jakarta : Salemba Empat
Indonesia Stock Exchange. 2017. [On-Line]. Accessed via www.idx.co.id during periods of September 2017
Ningtyas, L Kilat, Et al. 2014. Pengaruh Good Corporate Governance Terhadap Nilai Perusahaan. Jurnal Administrasi Bisnis (JAB) Vol. 17 No. 1 Des 2014.
Parhusip, Hara Agum, Et al. 2016. Pengaruh Struktur Modal dan Profitabilitas terhadap Nilai Perusahaan. Jurnal Administrasi Bisnis (JAB) Vol. 37 No. 2 Agustus 2016 Putra, Yoga Pratama, Et al. 2014. Pengaruh Return on Investment, Return on Equity, Net Profit Margin, dan Earning Per Share Terhadap Harga Penutupan Saham Perusahaan. Jurnal Administrasi Bisnis (JAB) Vol. 8 No. 2 Maret 2014
Riyanto, Bambang. 2010. Dasar-dasar pembelajaran perusahaan.Yogyakarta :
BPFE
Safitri, Okyana Nur. 2014. The Influence of Capital Structure and Profitability On Firms’ Value. Jurnal Administrasi Bisnis
(JAB) Vol 13 No. 2 Agustus 2014
Syamsuddin, Lukman. 2013. Manajemen Keuangan Perusahaan. 12th Edition.