49
In this chapter, the writer presented the data which had been collected from the research in the field of study. The data are the description data of pre test score of experimental and control class, the description data of pre-test score of experimental and control class, testing of normality and homogeneity (normality test and testing homogeneity), result of data analysis, and discussion.
A.Data Presentation
This section describes the obtained data of the Effects of Using Multiple-Choice Test to the Students Scores in Learning vocabulary.
1. The Description Data of Pre-Test Score
The students’ pre test scores is distributed in the following table in
order to analyze the students’ knowledge beforee conducting the
treatment.
Based on KKM (Minimum Standard Scores of English subject of SMPMuhammadiyah Palangka Raya, the minimum mastery criterion (KKM) in English course is 70.
The qualifications of range score Range Score Classification
90-100 Excellent 80-89 Very Good
70-79 Good
60-69 Enough
Table 4.1 Pre test score of experimental and control group
Experiment Group Control Group
Code Score Correct
Answer Classification Code Score
Correct
Answer Classification
E-01 83 25 Very Good C-01 33 10 Poor
E-02 70 21 Good C-02 43 13 Poor
E-03 80 24 Very Good C-03 43 13 Poor
E-04 83 25 Very Good C-04 63 19 Enough
E-05 73 22 Good C-05 63 19 Enough
E-07 73 22 Good C-07 73 22 Good
E-08 46 14 Poor C-08 56 17 Poor
E-09 80 24 Very Good C-09 50 15 Poor
E-10 53 16 Poor C-10 56 17 Poor
E-11 70 21 Good C-11 50 15 Poor
E-12 80 24 Very Good C-12 53 16 Poor
E-13 83 25 Very Good C-13 60 18 Enough
E-14 86 26 Very Good C-14 63 19 Enough
E-15 53 16 Poor C-15 56 17 Poor
E-16 63 19 Enough C-16 60 18 Enough
E-17 73 24 Good C-17 60 18 Enough
E-18 90 27 Excellent C-18 60 18 Enough
E-19 73 22 Good C-19 56 17 Poor
E-20 83 25 Very Good C-20 63 19 Enough
E-21 63 19 Enough
E-22 83 25 Very Good
E-23 53 16 Poor
E-24 93 28 Excellent
Total 1773
73,88 46 93
Total 1137
56,85 33 73
Average Average
Lowest Score Lowest Score
Higher Score Higher Score
The table above shows us the comparison of pre-test score achieved by experimental and control group students, both class’ achievement are at most the same level. It can be seen that from the students’ score. The highest score is 93 and the lowest score is 46,
The highest score (H) : 93 The lowest score (L) : 46
The range of score (R) = H−L + 1 = 93−46 + 1
= 47 + 1
= 48
Interval of temporary (I) = R
K =
48 5 = 9.6
The highest score is 73 and the lowest score is 33 control group. It meant that the experimental and cintrol group have most the same level in level in learning multiple choice items by descriptive text before giving the treatment.
The highest score (H) : 73 The lowest score (L) : 33
The range of score (R) = H−L + 1 = 73−33 + 1
= 40 + 1
= 41
Interval of temporary (I) = R
K =
41 5 = 8.2
The distribution of students’ pretest score of experiment group can
Then, the distribution of students’ pre-test score of control group can also be seen in the following figure 4.2.
Figure 4.2. the students’ predicate in pre-test score of control group
2. The description Data of Post-Test Score
The students’ scores are distributed in the following table in order to analyze the students’ knowledge after conducting the treatment.
Based on KKM (Minimum Standard Scores of English subject of SMP Muhammadiyah Palangka Raya, the minimum mastery criterion (KKM) in English course is 70.
The qualifications of range score Range Score Classification
90-100 Excellent 80-89 Very Good
70-79 Good
60-69 Enough
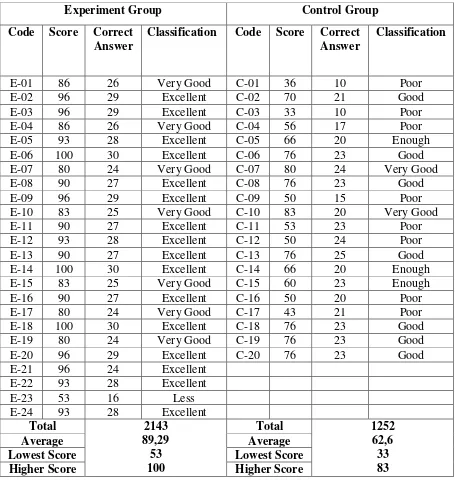
Table 4.2 Post-test of experimental and control group
Experiment Group Control Group
Code Score Correct Answer
Classification Code Score Correct Answer
Classification
E-01 86 26 Very Good C-01 36 10 Poor
E-02 96 29 Excellent C-02 70 21 Good
E-03 96 29 Excellent C-03 33 10 Poor
E-04 86 26 Very Good C-04 56 17 Poor
E-05 93 28 Excellent C-05 66 20 Enough
E-06 100 30 Excellent C-06 76 23 Good
E-07 80 24 Very Good C-07 80 24 Very Good
E-08 90 27 Excellent C-08 76 23 Good
E-09 96 29 Excellent C-09 50 15 Poor
E-10 83 25 Very Good C-10 83 20 Very Good
E-11 90 27 Excellent C-11 53 23 Poor
E-12 93 28 Excellent C-12 50 24 Poor
E-13 90 27 Excellent C-13 76 25 Good
E-14 100 30 Excellent C-14 66 20 Enough
E-15 83 25 Very Good C-15 60 23 Enough
E-16 90 27 Excellent C-16 50 20 Poor
E-17 80 24 Very Good C-17 43 21 Poor
E-18 100 30 Excellent C-18 76 23 Good
E-19 80 24 Very Good C-19 76 23 Good
E-20 96 29 Excellent C-20 76 23 Good
E-21 96 24 Excellent
E-22 93 28 Excellent
E-23 53 16 Less
E-24 93 28 Excellent
Total 2143
89,29 53 100
Total 1252
62,6 33 83
Average Average
Lowest Score Lowest Score
Higher Score Higher Score
The table above shows us the comparison of post-test score achieved by experimental and control group students, both classes’
students’ score. The highest score is 100 and the lowest score is 53,
experimental.
The highest score (H) : 100 The lowest score (L) : 53
The range of score (R) = H−L + 1 = 100−53 + 1
= 47 + 1
= 48
Interval of temporary (I) = R
K =
48 5 = 9.6
The highest score is 83 and the lowest score is 33 control group. It meant that the experimental and control group have different level in learning multiple choice test by descriptive text after getting the treatment. The highest score (H) : 83
The lowest score (L) : 33
The range of score (R) = H−L + 1 = 83−33 + 1
= 50 + 1
= 51
Interval of temporary (I) = R
K =
51
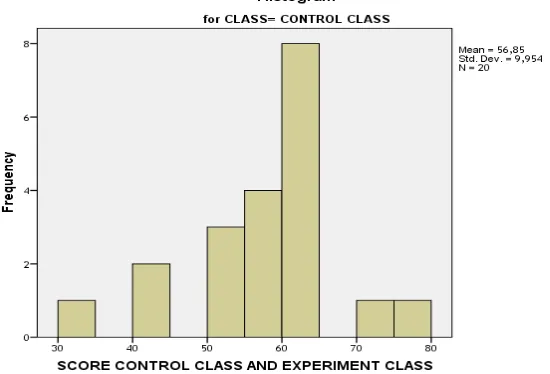
The distribution of students’ post-test score of experiment group can also be seen in the following figure 4.2
Histogram
For group = experimental
The distribution of students’ post-test score of control group can also be seen in the following figure 4.3.
B.Testing of Normality and Homogeneity 1. Normality Test
The testing of normality test used SPSS 20.0 program. It is divided into two parts, testing of normality of pre test and post-test both experimental and control group.
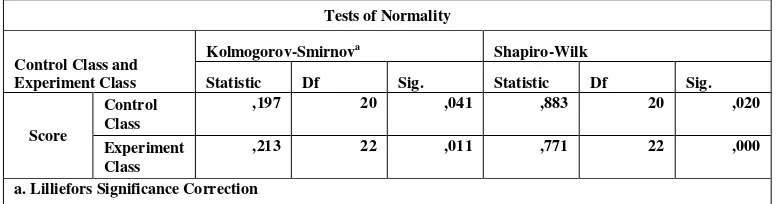
Table 4.2 Testing normality of post-test experimental and control group Tests of Normality
Control Class and Experiment Class
Kolmogorov-Smirnova Shapiro-Wilk
Statistic Df Sig. Statistic Df Sig.
Score
Control Class
,197 20 ,041 ,883 20 ,020
Experiment Class
,213 22 ,011 ,771 22 ,000
a. Lilliefors Significance Correction
The table shows the result of test of normality calculation using SPSS 20.0 program.
To know the normality of data, the formula can be seen as follows: If the number of sample. > 50 = Kolmogorov-Smirnov If the number of sample. < 50 = Shapiro –Wilk
Based on the number of data the writer was 42 < 50, so to analyzed normality data the writer used Shapiro-Wilk. The next step, the writer analyzed normality of data by using formula as follows:
If significance > 0,05 = data is normal distribution If significance < 0,05 = data is noot normal significance
that the data is normal distribution for control class and experiment class is not normal distribution.
2. Testing Homogeneity
Testing homogeneity used SPSS 10.0 program. The result of testing homogeneity of post-test of experimental and control group can be seen on the table 4.4.
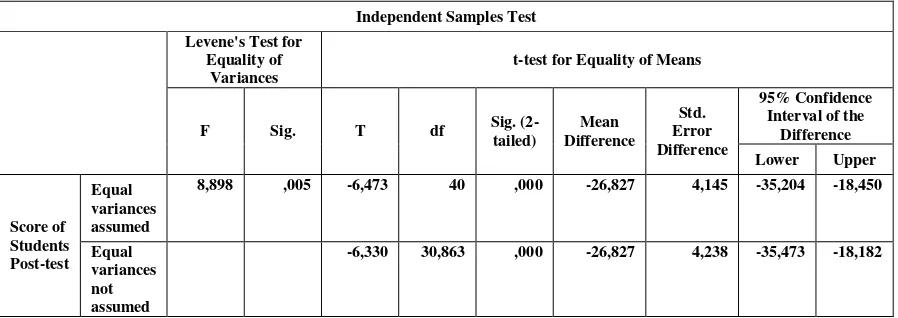
The table 4.4. Testing Homogeneity and Independent samples test of Post-Test of Experiment and Control Group
Independent Samples Test
Levene's Test for Equality of
Variances
t-test for Equality of Means
F Sig. T df Sig.
(2-tailed)
Mean Difference
Std. Error Difference
95% Confidence Interval of the
Difference Lower Upper
Score of Students Post-test
Equal variances assumed
8,898 ,005 -6,473 40 ,000 -26,827 4,145 -35,204 -18,450
Equal variances not assumed
-6,330 30,863 ,000 -26,827 4,238 -35,473 -18,182
The table shows the result of Homogenity test calculation using SPSS 20.0 program. To know the Homogenity of data, the formula can be seen as follows:
If Sig. > 0,01 = Equal variances assumed or Homogenity distribution.
C.The Result of Data Analysis
1. Descriptive Calculation of Data Analysis
An analysis of descriptive calculation of data analysis used SPSS 20.0 program to show mean, median, standart deviation, ranges and variances it is showed on table 4.7. and 4.8.
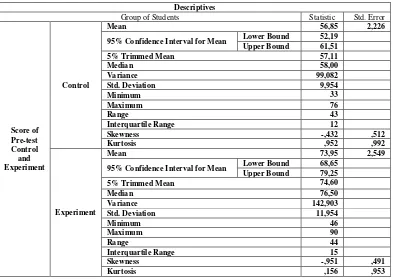
Table 4.5. Descriptive Calculation of data analysis of pre-test of control and experiment group.
Descriptives
Group of Students Statistic Std. Error
Score of Pre-test Control and Experiment
Control
Mean 56,85 2,226
95% Confidence Interval for Mean Lower Bound 52,19 Upper Bound 61,51
5% Trimmed Mean 57,11
Median 58,00
Variance 99,082
Std. Deviation 9,954
Minimum 33
Maximum 76
Range 43
Interquartile Range 12
Skewness -,432 ,512
Kurtosis ,952 ,992
Experiment
Mean 73,95 2,549
95% Confidence Interval for Mean Lower Bound 68,65 Upper Bound 79,25
5% Trimmed Mean 74,60
Median 76,50
Variance 142,903
Std. Deviation 11,954
Minimum 46
Maximum 90
Range 44
Interquartile Range 15
Skewness -,951 ,491
Kurtosis ,156 ,953
analysis of pre-test of experimental group. The result of mean calculation is 73,95, the result of median calculation is 76,50 and the result of ranges calculation is 44. The result of standard deviation is 11,954. The result of standard error of mean calculation is 2,549.
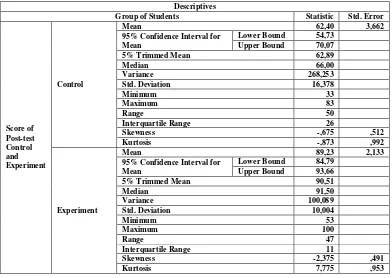
Table 4.6. Descriptive Calculation of data analysis of post-test of control and experiment group.
Descriptives
Group of Students Statistic Std. Error
Score of Post-test Control and Experiment Control
Mean 62,40 3,662
95% Confidence Interval for Mean
Lower Bound 54,73 Upper Bound 70,07
5% Trimmed Mean 62,89
Median 66,00
Variance 268,253
Std. Deviation 16,378
Minimum 33
Maximum 83
Range 50
Interquartile Range 26
Skewness -,675 ,512
Kurtosis -,873 ,992
Experiment
Mean 89,23 2,133
95% Confidence Interval for Mean
Lower Bound 84,79 Upper Bound 93,66
5% Trimmed Mean 90,51
Median 91,50
Variance 100,089
Std. Deviation 10,004
Minimum 53
Maximum 100
Range 47
Interquartile Range 11
Skewness -2,375 ,491
Kurtosis 7,775 ,953
of median calculation is 91,50 and the result of ranges calculation is 47 . the result of standart deviation is 10,004. The result of standard error of mean calculation is 2,133.
2. Testing Hypothesis Using Calculation of T-Test used SPSS 20.0 Program.
The last step on data analysis was testing hypothesis using calculation of T-test used SPSS 20.0 program.
Table 4.6. Testing Hypothesis Using Calculation of T-test used SPSS 20.0 program.
Independent Samples Test
Levene's Test for Equality of
Variances
t-test for Equality of Means
F Sig. T df Sig.
(2-tailed)
Mean Difference
Std. Error Difference
95% Confidence Interval of the
Difference Lower Upper
Score of Students Post-test
Equal variances assumed
8,898 ,005 -6,473 40 ,000 -26,827 4,145 -35,204 -18,450
Equal variances not assumed
-6,330 30,863 ,000 -26,827 4,238 -35,473 -18,182
The table above shows score on “T” on equal variances assumed is 6,330
with sig. (.000) two tailed. To know the testing hypothesis of data used SPSS 20.0 program, the formula can be seen as follows:
Ho : If score sig. (2-tailed) > 0,05 it means Ho was accepted and Ha was rejected.
Based on the data above, significant probability (sig. 2-tailed) is 0,000. The result is 000 < 0,05, it means Ha was accepted and Ho is rejected. From the result of testing hypothesis using calculation of t-test, it is shows that multiple-choice test is effective to the students’ scores in learning vocabulary of the Eighth Grade students of SMP Muhammadiyah Palangka Raya.
D.Discussion
The result of analysis shows that there is significant effect of using multiple-choice test to the students’ scores in learning vocabulary for the eighth grade students at SMP Muhammadiyah Palangka Raya.
The aim of the test is to know the students’ scores in reading descriptive and recount text by using multiple choice test as the media for the eight grade student of SMP Muhammadiyah palangka Raya.
In the pretest, the average scores of the experimental group and the control group were 73.88 and 56.85.
teaching descriptive and recount text to the experimental group the writer used multiple choice test as the media where in the control group, the writer taught the students by using the cloze test.
The test could prove that teaching reading descriptive and recount text using multiple choice test as the media to the eight grade students of SMP Muhammadiyah Palangka Raya was more effective.
Those are the result of post-test for experimental group and control group of students of SMP Muhammadiyah. Based on the writer’s result and