THE ANALYSIS OF SUPPLY CHAIN RISK
ON READY TO DRINK (RTD) PRODUCT
USING HOUSE OF RISK METHOD
Silvya Ratri Nugraheni.1), Rahmi Yuniarti2), Ratih Ardia Sari3) Department of Industrial Engineering, Universitas Brawijaya
Mayjen Haryono St. 167, Malang 65145, Indonesia
E-mail: [email protected]), [email protected]2), [email protected]3)
Abstract.
PT SGB is one of the companies that produce Ready To Drink (RTD) beverage as its product and its demand have increased every each year. The company’s supply chain process which starts from material ordering, materials storage management, production process, finished good storing, and delivering tocustomers. All those processes belong to company’s supply chain stream and it is mapped as the element of
Supply Chain Operation Reference (SCOR). From that complex processes, there were found supply chain risk as the problem. Risks that found in supply chain flow should be solved based on risk priority order. The method that used for analizing the risk is House of Risk (HOR), consist of two phases. The objective of the first phase of HOR is knowing the risk priority that should be mitigated based on the Aggregate Risk Potential (ARP) score, and the second phase of HOR are generating some preventive strategies then choose the most effective strategy that suitable to be implemented. Meanwhile, the Pareto chart is used to determine the choosen priority risk to be mitigated. There are 63 identified risk events based on SCOR elements, 43 identified risk agents, and 15 recommended preventive strategies according to the most effective sequence of strategies that applied in the company.
Key words: House of Risk (HOR), SCOR, Supply Chain Risk Management, Pareto, Supply Chain
Management
1. Introduction
Ready to drink (RTD) is term, which
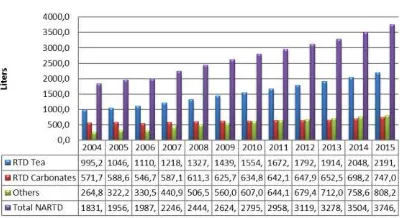
used to define a type of beverage in a special packaging that can be consumed directly without having to be processed. RTD is drink that includes in food and beverage group business as an industry that was not deterred by crisis. Even in 2008 when economy was weakening due to global crisis, food and beverage business was still survive and increased by 14.9%, according to data of food and beverage industry growth by Statistic Indonesia [1]. Moreover, RTD also experienced an increase in demand every year as shown at Figure 1.
PT Suntory Garuda Beverage (SGB) is one of companies that concerned in RTD, that packaging or RTD was divided into cup packaging and PET (Polyethylene
Terephthalate) packaging. PT SGB ordered two
categories of material, they were Raw Material (RM) and Packaging Material (PM).
* Corresponding author. Email : [email protected] Published online at http://Jemis.ub.ac.id
Copyright ©2017 JTI UB Publishing. All Rights Reserved
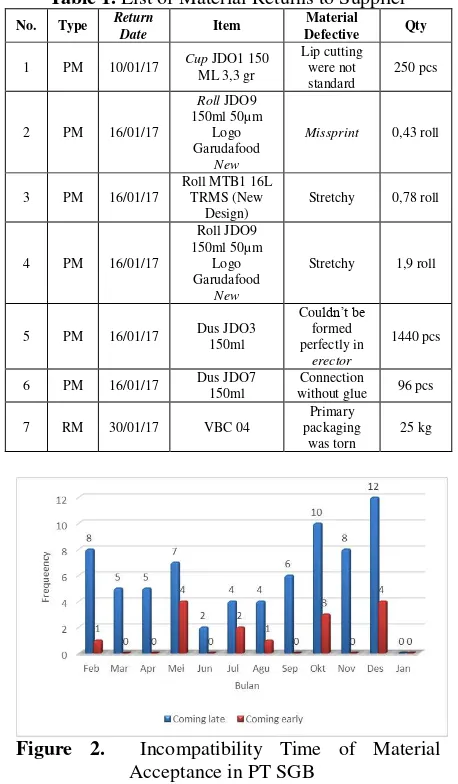
When made an order of material, there was incompatibility as shown at Table 1.
Figure 1. Assumption of RTD level growth
Site this Article As ……….
Table 1. List of Material Returns to Supplier
No. Type Return
Stretchy 0,78 roll
4 PM 16/01/17 Acceptance in PT SGB
Product of RTD beverage would be send according to customer demand by using a company fleet, shipping services, and also by using distributor company of Garuda, that was PT. Sinar Niaga Sejahtera (SNS). If there was return of RTD product because the product had damaged when shipping to customer, the company would re-send the product to customer at the following shipping schedule. Product return would cause harm to company and also affected the running of supply chain process. Product return of RTD product could be seen at Table 2. This risk management would be conducted at RTD product type of cup, Item Code Accepted (box) Refused (box)
Depo: caused of un-specification material in production, then defect during production process, and defective product when transfer time of goods to finished product warehouse.
Figure 3. Comparison Chart of RTD defective Number in January 2017
Supply chain management is method or integrative approach that used to manage the flow of product, flow of information and flow of money intregatedly. The flows involved the parties from upstream to downstream that consisting of supplier, factory, distribution network and logistics services [2]. In a process, there was always risk arised, so were risks along the flow of supply chain activity in PT SGB. Risk was probability of loss and its implication that affect to individual and organization [3]. To handle existing risk, required a clear structure of Supply Chain Risk Management (SCRM), start from identifying risk on each activity according to Supply Chain Operation Reference (SCOR) which consisted of 5 elements, they were plan, source, make, deliver, and return. Arising risk from such activity would be triggered by the risk agent, then would be designed mitigation strategy in order to manage the risk well and fixed business system of PT SGB.
Mode and Effect Analysis (FMEA) and House of Quality (HOQ) methods to develop a framework for risk management. HOQ method in product designing changed function into tool in strategi designing of risk mitigation that known as HOR [4]. HOR consisted of two phases, they were HOR phase 1 dan HOR phase 2. This research aimed to identify risk, cause of risk, and strategy to handle risk that accordance with the condition of company.
2. Research Methods
Type of research that used in this study was descriptive research. Final result of this study could be used as input and consideration matter for the management to handle the risk in supply chain management of company and affected to fluency of supply chain flow of company.
2.1 Research Steps
Steps in conducting research were Study of Literature, Preliminary Survey, Identification and Determine of Research Problem, Determination of Research Goal, Data Collection, and Conclussion and Suggestion. It starts with study of literature that conducted to learn about theory and knowledge, which relate to problem that match with object under study. Secondly, preliminary survey that aimed to obtain as much as possible that relate to research topic and identify the problem in company. Steps that had to be conducted after preliminary survey were identification and determined of research problem against activity in supply chain flow of RTD product in PT SGB and defined any problems that might arise. After determining of research goal, then determining framework that used in processing and analyzing data. Data that used in this research was primary data and secondary data.
Primary data in this research was obtained from observation, interview, discussion, and questionnaire. The observation/ survey method collected data about the implementation of supply chain in PT SGB through complete assessment of real condition company. The interview method conducted to obtain data and information about implementation of Supply Chain Risk Management in PT SGB. The discussion method conducted to help identifying risk factors and determining cause of risk,
determining correlation value between HOR 1 and HOR 2, and also assessment of difficulty level of implementing handling strategy in company, and questionary method conducted when giving assessment of severity value and occurrence against supply chain risk of company.
Secondary data that used was a brief history and profile of PT SGB, vision and mission, and also organization structure of PT SGB, variation of RTD product that produced, returned data RM and PM from and to supplier, and incompibility data of delivery schedule of RM and PM, and also finished product inspection.
The following step after data collection was data processing and discussion in this research explained as mapping activity of company supply chain, this stage was stage that describing activity by identifying parties that involved in supply chain activity in PT SGB. Followed by Risk identification and Cause of Risk, this stage identifying the risk that would be handled by using element from supply chain, that was SCOR consisted of plan, source, make, delivery, and return. After identifying the risk, then identifying the cause of risk. The next step is Analysis and Risk Evaluation. In this stage identified the score of severity and occurrence of risk, correlation between the risk event and risk agent. Risk evaluation conducted to determine the risk that required handling by using House of Risk (HOR) method phase 1. Input for HOR phase 1 were risk event, risk agent, severity value, occurrence, and correlation. Then, from HOR phase 1 would obtain the value of Aggregate Risk Potential (ARP) from each risk agent. To determine risk agent which had to be immediately mitigated, used Pareto diagram to know the highest cause of risk on each occurrence [5].
Site this Article As ………. suggestion in statement for company in order to do systematic action to minimize risk on supply chain flow of RTD product.
3. Result and Discussion
In this section would be explained the result and discussion of research.
3.1 Mapping of Supply ChainActivity
Mapping of supply chain activity was conducted based on five elements in Supply Chain Operation Reference (SCOR) they were Plan, Source, Make, Deliver and Return, and summarized in Table 3.
Table 3. Mapping of Supply Chain Activity of RTD Product based on SCOR element
Element No Activity Plan 1. Making schedule of weekly production plan
2. Forecasting demand
3. Material inventory planning
4. Procurement planning of material needs
Source 1. Acceptance of RM and PM from supplier
2. Checking RM and PM that accepted from supplier
3. Storing RM and PM in material warehouse
4. Management stock of RM and PM in material
warehouse
5. Distribution of RM and PM to production section
Make 1. Processing production of RTD (cup line)
2. Controlling against production process
Deliver 1. Storing finished product until distributed
2. Inspection against RTD product
3. Distributing RTD to customer
a. Company fleet
b. PT SNS (Sinar Niaga Sejahtera)
c. Expedition
Return 1. Maetrial return (RM/PM) from supplier
2. Return of defect RTD product from customer
3. Re-send RTD product to customer
3.2 The 1st Phase of House of Risk
HOR phase 1 was started by identifying risk event and severity assessment. Followed by identifying risk agent and occurrence assessment, and also identifying of correlation between risk event and risk agent. The following were identification result of risk event and risk agent in supply chain flow based on SCOR element as shown in Appendix 1.
Based on identification result, there was found 63 risk events and 43 risk agents. After knowing risk event and risk agent, assessed severity and occurrence by company parties and continued with discussion to determine correlation between risk event and risk agent of supply chain. Correlation assessment based on
scoring scale 0 (had no correlation), 1 (weak correlation), 3 (medium correlation), 9 (strong correlation). Table of HOR 1 could be seen at Appendix 2.
The following step is calculating Aggregate Risk Potential (ARP) value, used as reference and input to determine priority of risk agent which need to be handled first that given preventive action against risk agent. After calculating all of ARP value, then ARP value sorted descending (from the biggest value into smallest value). The following is ARP value ranking that presented in Table 4.
Based on ARP ranking, the highest ARP
value in risk agent “human error” is 1521,952
and the lowest ARP value in risk agent “limited of RTD product safety stock that available” that
is 4,762. Then, ARP ranking would be analyzed by using Pareto Chart. Pareto Chart aimed to determine the priority risk agent to be handled for the occurrence of the risk caused. Based on Pareto chart, selected risk agent is 80:20. 20% from total number of risk agent that contributed almost 80% against total ARP value caused by nine risk agents. The following is Pareto Chart of ARP ranking that shown in Figure 4.
3.3 The 2nd Phaseof House of Risk
The next stage was determining several actions that considered effective for reducing probability of cause of risk. Steps in working on HOR phase 2 were cause of risk election, management strategy determination, proposal of management strategy, correlation between management strategy and cause of risk,
Table 4. Ranking of ARP
specification quality of material) 1012,574
Pr3 ARP33 No checking in final delivery 789,198
Pr4
ARP11
Un-specified work instruction and
retrieval of material 413,517
Pr5 ARP19 Planning of machine maintenance
was not done routinely
370,483
Pr6 ARP12 Lack of control over supplier 358,241
Pr7 ARP1 Sudden production machine was
damaged
339,228
Pr8 ARP17 Environmental condition of material
storeage was uncondusive
293,028
Pr9 ARP20 Repairment of production machine
was not optimal yet
247,042
Pr10 ARP5 Lack of coordination between parts 243,000
Pr11 ARP25 Product was knocked during transfer
process
212,555
Pr12 ARP6 Unevenly information distribution
between part
209,411
Pr13 ARP42 Lack of company fleet 168,948
Pr14 ARP13 Fleet didn’t pay attention to
environmental condition of vehicle
Rank Code Cause of Risk ARP
Pr15 ARP41 Limited fleet capacity 135,000
Pr16 ARP23 Producion machine worked
un-optimally
129,765
Pr17 ARP24 Cup-sealing process was not perfect 116,275
Pr18 ARP31 Inappropriate pallet using (reverse) 109,381
Pr19 ARP28 Labelling machine (IJP) worked
un-optimally
108,000
Pr20 ARP8 Un-stable traffic condition 94,065
Pr21 ARP4 Sudden demand changed from central
company
91,559
Pr22 ARP27 Asroll was not rolled properly on
machine
83,549
Pr23 ARP29 Production plan didn’t run ccording
to schedule
62,471
Pr24 ARP16 Location of material storage in
warehouse was ineffective
54,775
Pr25 ARP2 Lack of RM to process production 52,034
Pr26 ARP3 Lack of PM to process production 45,456
Pr27 ARP9 Lack of coordination withsupplier 45,357
Pr28 ARP36 No checking in delivering finished
product by company fleet
33,877
Pr29 ARP43 RTD returned product was broken 33,156
Pr30 ARP35 There was fault storage in transport
fleet
32,469
Pr31 ARP34 Finished product in FG warehouse
was not effective
31,061
Pr32 ARP30 There was expanding inspection,
indeed overall inspection
30,826
Pr33 ARP18 Expired Date label was not seen
clearly
29,595
Pr34 ARP21 Overloading in using of production
machine
27,896
Pr35 ARP32 Un-optimally inspection process of
material
25,960
Pr36 ARP7 Parameter in determining the
purchase of material was inappropriate
22,679
Pr37 ARP15 The division of human resource was
uneven
22,386
Pr38 ARP26 Contamination of iron from
production machine
21,604
Pr39 ARP14 Weather problem 19,049
Pr40 ARP37 Fleet damage 12,000
Pr41 ARP39 Expedition transportation of fleet was
damage
11,761
Pr42 ARP38 Lack of coordination with supplier 9,906
Pr43 ARP40 Limited safety stock of RTD product
that available calculation of Effectiveness To Difficulty (ETD) value by considering Degree of Difficulty value [6].
Management strategy considered according to Pareto principle that selected 9 risks and handled by 15 management strategies. Management strategy that recommended could reduce occurrence in supply chain of company as presented in Table 5-6.
Table 5. Management Strategy of Risk Agent No. Risk Agent Management Strategy Code
1. Human error Training periodically PA1
Applying reward system as
work PA2
Briefing routinely every day at the beginning and the end of working hours
PA3
2. Incompibility of
material quality with the specifications desired by company
Supplier election had to be
conducted more selectively PA4
Reviewing contract with
supplier PA5
3 No checking in
final delivery
Adding the task of BOF section that aimed to check product before distributed
PA6
Updating the “work
instruction” of storage and retrieval material and supervising its implementation
PA7
Making mandatory sign board
in material warehouse PA8
Making maintenance report PA9
Scheduling preventive
Making contract with supplier PA12
7. Sudden production
machine was damaged
Preparing emergency
maintenance action PA13
8. Environmental storage to keep quality of material
After making management strategy of supply chain risk in PT SGB that discussed in previous point, the next stage was making assessment of correlation between recommended management strategy and each potentially risk agents. Correlation assessment conducted as correlation on HOR phase 1.
After making assessment of correlation, the next stage was calculating Total
Effectiveness (TEk) value and making
assessment of Degree of Difficulty (Dk) from
each proposal management strategy. Assessment of Degree of Difficulty (Dk) that
Site this Article As ……….
by company according to scale in Table 7.
Table 7. Scoring Scale of Degree of Difficulty
Level Degree of Difficulty (Dk) Explanation
3 Low Easy to apply
4 Medium Rather difficult to apply 5 High Difficult to apply
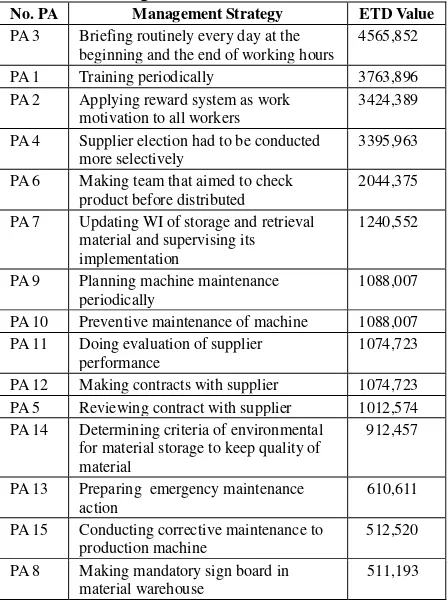
After calculating Total Effectiveness (TEk) and assessment of Degree of Difficulty (Dk), then calculating ratio of Effectiveness to Difficulty (ETD) from management strategy that had been proposed. Calculation of ETD aimed to determine ranking and priority of each management strategy. Then, ETD value was sorted descending as presented in Table 8.
Table 8. Ranking of ETD Value
No. PA Management Strategy ETD Value
PA 3 Briefing routinely every day at the beginning and the end of working hours
4565,852
PA 1 Training periodically 3763,896
PA 2 Applying reward system as work motivation to all workers
3424,389
PA 4 Supplier election had to be conducted more selectively
3395,963
PA 6 Making team that aimed to check product before distributed
2044,375
PA 7 Updating WI of storage and retrieval material and supervising its implementation
1240,552
PA 9 Planning machine maintenance periodically
1088,007
PA 10 Preventive maintenance of machine 1088,007 PA 11 Doing evaluation of supplier
performance
1074,723
PA 12 Making contracts with supplier 1074,723 PA 5 Reviewing contract with supplier 1012,574 PA 14 Determining criteria of environmental
for material storage to keep quality of material
912,457
PA 13 Preparing emergency maintenance action
610,611
PA 15 Conducting corrective maintenance to production machine
512,520
PA 8 Making mandatory sign board in material warehouse
511,193
Preventive action by periodical training (PA1) could be conducted to handle human error risk agent. Training Needs Analysis (TNA) was needed to know training need in each particulary job in company.
Preventive action by applying reward system as motivation to all workers (PA2) was strategy that offered to reduce the occurrence of human error. Giving reward as motivation to all workers increased spirit, motivation and
reduced inaccuracy and mistake during doing their job. During conducting briefing, there should be report as documentation and daily journal that could be used as activity control.
Preventive action by electing supplier selectively (PA4) used for handling material quality was not appropriate with specification desired by company risk agent. Method that used for determining the best supplier was using scoring for some criteria that wanted by company. Supplier scoring was using Analytical Hierarchy Process (AHP) method.
Reviewing contract with supplier (PA5) was preventive action that conducted in order to decrease risk of material quality that was appropriate with specification desired by company. Resulted output from reviewing contract was evaluation of supplier if there was something that inappropriate with contract.
Preventive action by task adding of Back off Factory (BOF) that aimed to check product berfore distributed (PA6) was decreasing risk because there was no final checking before delivering product. Checking and controlling product during loading and transferring to expedition was conducted by BOF team leader and staff.
Preventive action by updating work instruction (WI) of storing and retrieving of material and supervising in implementation (PA7) was handling strategy that recommended to decrease the risk agent because of WI. It was related with risk event of retrieval of material that was not accordance with FIFO principle for PM and FEFO for RM, and evaluation of supplier in material arrival.
about retrieval of material.
Preventive action for planning of machine maintenance was not done routinely by making report of maintenance (PA9). Maintenance was not conducted according to schedule, so that should be needed of control for machine to make sure that it was already maintened.
Preventive action for planning of machine maintenance was not done routinely was scheduling of preventive maintenance for production machine (PA10). Preventive Maintenance was an observe sistemaically that accompanied with technical-economical analysis to ensure functioning of production equipment. Preventive maintenance aimed for achieveing a level of production equipment maintenance in order to get product quality optimally.
Preventive action by reviewing supplier performance (PA11) was strategy to handle of lack of supplier control. Evaluation of supplier performance aimed to increase suppier performance and can be used in considering alternative supplier. This system would increase supplier performance.
Preventive action by making contract with supplier (PA12) was recommended to reduce the risk that caused by lack of supplier control. Lack of control would be influenced against problems that arised. Cooperation contract would make company had a right to hold accountable from supplier if there was something inappropriate in contract.
Preventive action for sudden production machine was damaged risk agent was by preparing emergency maintenance. Emergency maintenance included in unplanned maintenance. That method was repairing tools that damaged.
Preventive action PA14 was for handling un-condusive condition of material storage environmental that affected to quality of material. Several factors that caused damage or lose were chemical reaction, microorganism, insect, rats, and used of un-properly container. Bad condition of material that caused by environmental influence and human error.
Corrective maintenance of machine strategy (PA15) was strategy that handle risk agent of un-optimally machine repaired. Corrective maintenance was maintenance that
conducted by identifying cause of damage and followed by repairing machine or production equipment.
Ranking above was strategy that appropriate to apply by company which had been assessed by level ratio of effectiveness by considering its difficulty if that strategy was applied in company. That strategy was strategy that could reduce the value of the highest risk of company and could increase fluency of supply chain flow in company. Table of HOR phase 2 could be seen at Appendix 3.
4. Conclusion
Conclusion from research about risk analysis of supply chain flow in Ready To Drink (RTD) product, that conducted in PT SGB which focused on supply chain flow of RTD product in cup packaging, obtained these following conclusions.
1. Risk arising from supply chain flow of RTD product in cup packaging of di PT Suntory Beverage, was identified according to Supply Chain Operations Reference (SCOR) element that consisted of Plan that were 4 risk events, Source
that were 18 risk events, Make that was 15 risk events, Deliver that were 19 risk event, Return that were 7 risk events. So, the number of risk events identified in supply chain flow were 63 risk events. 2. Every risk event triggered by risk agent.
Risk agent identified from occurrence of risk event in supply chain flow of RTD product in cup packaging were 43 risk agents.
Site this Article As ……….
condition of material storage was uncondusive, repairment of production machine was not optimal yet.
4. Repairments that given to 9 risk agents were 15 preventive action. Ranking of management strategy based on the highest ETD value until the lowest values were routinely briefing every day at the beginning and the end of working hours, training periodically, applying reward system as work motivation to all workers, supplier election had to be conducted more selectively, making team that aimed to check product before distributed, updating the “work
instruction” of storage and retrieval material and supervising its implementation, planning machine maintenance periodically, preventive maintenance of machine, doing evaluation of supplier performance, making contracts with supplier, reviewing contract with supplier, determining criteria of environmental for material storage to keep quality of material, preparing emergency maintenance action, conducting corrective maintenance to production machine, making mandatory sign board in material warehouse.
REFERENCES
[1] Palupi, Dyah Hasto. (2009). Pertarungan Elegan merebut 500 T. Swa, 04/XXV. Halaman 30.
[2] Pujawan, I. N. & ER., M. (2010). Supply
Chain Management. Surabaya: Guna
Widya.
[3] Anggara, R. A. (2009). Implementation of Risk Management Framework in Supply Chain: A Tale from a Biofuel Company in Indonesia. Manchester
Business School Research Paper.
[4] Pujawan, I. N. & Geraldine L. H. (2009). House of Risk: A Model For Proactive Supply Chain Risk Management. Supply
Chain Management Reasearch Paper.
[5] Bahrami, M., Bazzaz, D. H. & Sajjadi, S.
M. (2012). Innovation and Improvements In Project Implementation and Management: Using FMEA Technique.
Procedia-Social and Behavioral Sciences
41.
[6] Milati, S.D. (2014). Analisis Risiko pada Supply Chain Pembuatan Filter Rokok (Studi Kasus: PT. Filtrona Indonesia, Surabaya). Jurnal Rekayasa dan
Appendix 1. Identification of Risk Agent from Each Risk Event
Risk Event Risk Agent
E1 Sudden changes in production plan • Sudden production machine was damaged
• Lack of RM for processing production
• Lack of PM for processing production
• Sudden changed in demand from central company
E2 There was mistake in determining number of demand • Sudden changed in demand from central company
• Lack of coordination between parts
• Unevenly information distribution between part
E3 Planning in determining safety stock was inappropriate
E4 Material warehouse capcity planning was inappropriate • Parameters in determining purchase of material was
• Lack of coordination between parts
• Unevenly information distribution between part
E5 Material delivery from supplier was delay • Un-stable traffic condition
• Lack of coordination with supplier
E6 The arrival of material delivery come earlier than scheduled
E7 Evaluation of supplier performance was not conducted for
environmental assessment when receiveing material
• Human error
• Un-specified work instruction and retrieval of material
E8 Inappropriate quantity of RM that received • Human error
• Lack of control over supplier
E9 Inappropriate quantity of PM that received • Human error
• Lack of control over supplier
E10 Inappropriate type of RM received with the ordered one • Human error
• Lack of control over supplier
E11 Inappropriate type of PM received with the ordered one • Human error
• Lack of control over supplier
E12 Inappropriate specification of RM received with the ordered
one
• Human error
• Lack of control over supplier
• Fleet didn’t pay attention to the environmental condition of vehicle
E13 Inappropriate specification of PM received with the ordered
one
• Human error
• Lack of control over supplier
• Fleet didn’t pay attention to the environmental condition of vehicle
E14 Contaminated material during delivering process • Fleet didn’t pay attention to the environmental condition of vehicle
• Weather problem
E15 Limited QC number for inspecting material • The division of human resource was uneven
E16 RM was expired in warehouse • Lack of coordination between parts
• The division of human resource was uneven
E17 A fire occurred because RM reacted with chemical element • Location of material storage in warehouse was ineffective
• Human error
• Un-specified work instruction and retrieval of material
E18 PM was damaged because of environmental problem in
storage
• Uncondusive condition of environmental storage
E19 Differences in RM number that recorded with RM stock in
warehouse
• Lack of coordination between parts
• Unevenly information distribution between part
• Un-specified work instruction and retrieval of material
• Human error
E20 Differences in PM number that recorded with PM stock in
warehouse
E21 Retrieval of RM was not according to FEFO principle • Expired Date label was not seen clearly
• Un-specified work instruction and retrieval of material
• Human error
• Location of maerial storage in warehose was ineffective
E22 Retrieval of PM was not according to FIFO principle
E23 Stop of production process in certain production line • Sudden production machine was damaged
• Planning of machine maintenance was not done routinely
• Un-optimally maintenance of production machine
• Un-optimally inspection process of material
E24 High production machine downtime
E25 Carton cup couldn’t open during production process • Material quality was not appropriate with specification desired by company
• Production machine worked un-optimaly
• Un-condusive condition of material storage environmental
E26 Leakage on packaging of RTD product • Cup-saealing process wasn’t perfect
• Product was knocked during transfer process
• Production machine worked un-optimally
• Condition of environmental storage was un-condusive
E27 Missed in entering straw into carton cup • Human error
E28 Damage of packaging box of RTD product • Human error
• Material quality was not appropriate with specification desired by company
• Cup-saealing process wasn’t perfect
• Product was knocked during transfer process
• Condition of environmental storage was un-condusive
E29 Decreasing quality of RTD product during production
process
• Sudden production machine was damaged
• Contamination of iron from production machine
• Production machine worked un-optimally
• Human error
E30 Lip cup of product was cut • Production machine worked un-optimally
• Planning of machine maintenance was not done routinely
• Un-optimally maintenance of production machine
• Material quality was not appropriate with specification desired by company
Site this Article As ……….
• Human error
• Material quality was not appropriate with specification desired by company
E32 RTD product was contaminated with strange things • Human error
• Contamination of iron from production machine
• Asroll was not rolled properly on machine
E33 Decreasing of machine performancy • Planning of machine maintenance was not done routinely
• Un-optimally maintenance of production machine
E34 Found some un-labelled “expired” in cup packaging • Labelling (IJP) machine worked un-optimally
• Planning of machine maintenance was not done routinely
E35 Delay in production process • Production planning wasn’t run as had been scheduled
• Lack of RM for production process
• Lack of PM for production process
• Sudden changed in demand from central company
• Human error
E36 Decreasing number of production • Sudden production machine was damaged
• Human error
• There was expanding inspection, indeed overall inspection
• Material quality was not appropriate with specification desired by company
E37 Lack of machine maintenance and production tool • Planning of machine maintenance was not done routinely
• Un-optimally maintenance of production machine
E38 RTD product was broken when arranging in the rack • Inappropriate in using pallet
• Human error
E39 Satack of boxes were not perfectly arranged on pallet • Material quality was not appropriate with specification desired by company
E40 Un-availability of pallet when product ready to be stored • Production planning wasn’t run as had been scheduled
• Lack of coordination between parts
• Unevenly information distribution between part
E41 Found of defect in RTD product before being distributed • Un-optimally inspection process
• Human error
• Material quality was not appropriate with specification desired by company
E42 Limited QC number for inspecting finished produc • The division of human resource was uneven
E43 There was mistake in delivery for product number to
customer
• Human error
• No checking in final delivery
• Location of material storage in warehouse was ineffective
• There was mistake in storing product in transportation (fleet)
E44 There was mistake in delivery for type of product to customer
E45 There was mistake in delivery for specification of product to
customer through fleet
•
E46 Product delivery didn’t match to the specified address • Human error
E47 Package damage during shiiping • There was mistake in storing product in transportation (fleet) Human error
• Material quality was not appropriate with specification desired by company
• No checking in final delivery of finished product
E48 Delay in delivery product to customer • There was expanding inspection, indeed overall inspection
• Damage fleet
• Condition of traffic was un-stable
E49 There was mistake in delivery for number of product to
customer through PT SNS
• Human error
• No checking in final delivery of finished product
• Finished product in FG warehouse was not effective
• There was mistake in storing product in transportation (fleet)
E50 There was mistake in delivery for type of product to customer
through PT SNS
E51 There was mistake in delivery for specification of product to
customer through PT SNS
E52 Delay in distribution product to PT SNS • There was expanding inspection, indeed overall inspection
E52 Delay in distribution product to PT SNS • Production planning wasn’t run as had been scheduled
E53 There was mistake in delivery for number of product to
customer through expedition
• Human error
• No checking in final delivery
• Location of material storage in warehouse was ineffective
• There was mistake in storing product in transportation (fleet)
E54 There was mistake in delivery for type of product to customer
through expedition
E55 There was mistake in delivery for specification of product to
customer through expedition
E56 Delay of expedition in delivering product to customer • Condition of traffic was un-stable
• Damage transportation of expedition
• Production planning wasn’t run as had been scheduled
E57 Returned inappropriate specification of RM to supplier • Material quality was not appropriate with specification desired by company
• Lack of coordination withsupplier
• Lack of control oversupplier
E58 Returned inappropriate specification of PM to supplier
E59 Returned inappropriate type of RM to supplier
E60 Returned inappropriate type of PM to supplier • Fleet didn’t pay attention to environmental condition of vehicle
E61 Delayed in handling product returned to customer • Limited safety stock of RTD product that available
• Production planning wasn’t run as had been scheduled
• Damage transportation (fleet)
• Condition of traffic was un-stable
E62 Lack of fleet number to re-send substtitution product to
customer
• Limited of fleet capacity
• Lack of fleet number in company
A1 A2 A3 A4 A5 A6 A7 A8 A9 A10 A11 A12 A13 A14 A15 A16 A17 A18 A19 A20 A21 A22 A23 A24 A25 A26 A27 A28 A29 A30 A31 A32 A33 A34 A35 A36 A37 A38 A39 A40 A41 A42 A43 Step 1 Step 2 Step 3
Element (SCOR)
Risk event
Severity (S)
A1 A2 A3 A4 A5 A6 A7 A8 A9 A10 A11 A12 A13 A14 A15 A16 A17 A18 A19 A20 A21 A22 A23 A24 A25 A26 A27 A28 A29 A30 A31 A32 A33 A34 A35 A36 A37 A38 A39 A40 A41 A42 A43
E1 5.313 E1 3 3 3 3
E2 4.000 E2 3 1 1
E3 4.642 E3 3 1 1
E4 3.302 E4 3 3 3
E5 2.289 E5 3 3
E6 2.289 E6 3 3
E7 3.302 E7 9 3
E8 4.932 E8 3 3
E9 5.646 E9 3 3
E10 1.000 E10 3 3
E11 1.000 E11 3 3
E12 5.646 E12 1 3 3
E13 2.289 E13 1 3 3
E14 1.587 E14 9 3
E15 1.587 E15 3
E16 2.000 E16 3 3
E17 1.260 E17 9 1 3
E18 3.915 E18 9
E19 3.634 E19 3 3 3 9
E20 3.634 E20 3 3 3 9
E21 4.932 E21 3 3 1 3
E22 4.000 E22 3 3 1
E23 3.302 E23 3 1 1 1
E24 5.000 E24 3 3 3 1
E25 3.302 E25 1 9 9
E26 5.646 E26 1 1 3 3
E27 2.289 E27 9
E28 6.316 E28 1 3 3 1 3
E29 5.000 E29 3 1 3 3
E30 6.316 E30 1 1 9 1
E31 3.302 E31 1 3 3
E32 6.604 E32 1 1 3
E33 4.309 E33 9 9
E34 3.634 E34 1 9
E35 3.915 E35 1 1 1 1 3
E36 4.000 E36 3 1 1 1
E37 6.316 E37 3 3
E38 5.313 E38 3 1 3
E39 4.000 E39 1 3
E40 2.000 E40 3 3 3
E41 3.302 E41 1 3 3
E42 1.260 E42 3
E43 1.000 E43 3 9 1 1
E44 1.587 E44 3 9 1 1
E45 3.634 E45 3 9 1 1
E46 1.000 E46 9
E47 5.646 E47 1 1 3 3
E48 1.000 E48 3 3 3
E49 1.000 E49 3 9 1 1
E50 1.000 E50 3 9 1 1
E51 4.309 E51 3 9 1 1
E52 1.587 E52 3 3
E53 1.000 E53 3 9 1 1
E54 1.000 E54 3 9 1 1
E55 1.000 E55 3 9 1 1
E56 1.260 E56 3 3 3
E57 2.621 E57 1 3 1
E58 2.000 E58 1 3 1
E59 1.260 E59 1 3 1
E60 2.621 E60 1
E61 1.000 E61 3 1 3 3
E62 3.000 E62 9 9
E63 2.621 E63 3
5.000 2.621 2.289 2.000 4.642 4.000 2.289 4.000 3.302 5.646 4.000 5.313 4.000 4.000 2.621 4.309 4.642 2.000 4.309 3.000 2.000 6.649 2.289 5.000 4.642 1.000 4.217 3.302 2.289 2.621 3.915 2.621 5.646 2.000 1.000 2.000 2.000 2.621 2.000 1.587 5.000 6.257 4.217
ARP1 ARP2 ARP3 ARP4 ARP5 ARP6 ARP7 ARP8 ARP9 ARP10 ARP11 ARP12 ARP13 ARP14 ARP15 ARP16 ARP17 ARP18 ARP19 ARP20 ARP21 ARP22 ARP23 ARP24 ARP25 ARP26 ARP27 ARP28 ARP29 ARP30 ARP31 ARP32 ARP33 ARP34 ARP35 ARP36 ARP37 ARP38 ARP39 ARP40 ARP41 ARP42 ARP43
339.228 52.034 45.456 91.559 243.000 209.411 22.679 94.065 45.357 1521.951413.517 358.241 162.857 19.049 22.386 54.775 293.028 29.595 370.483 247.042 27.896 1012.574 129.765 116.275 212.555 21.604 83.549 108.000 62.471 30.826 109.381 25.960 789.198 31.061 32.469 33.877 12.000 9.906 11.761 4.762 135.000 168.94833.156
Pr 7 Pr 25 Pr 26 Pr 14 Pr 11 Pr 12 Pr 35 Pr 22 Pr 32 Pr 1 Pr 4 Pr 8 Pr 15 Pr 41 Pr 37 Pr 33 Pr 9 Pr 30 Pr 5 Pr 6 Pr 31 Pr 2 Pr 10 Pr 23 Pr 13 Pr 24 Pr 27 Pr 16 Pr 19 Pr 34 Pr 18 Pr 36 Pr 3 Pr 29 Pr 17 Pr 28 Pr 39 Pr 42 Pr 40 Pr 43 Pr 20 Pr 21 Pr 38
Step 7 Determine Risk Priority Index (Pj) Source
Make
Deliver
Return
Step 5 Occurance (O) Plan
Step 4 Risk Agent
Step 6
Site this Article As ……….
Appendix 3
. 2
ndPhase of HOR
Risk Agent
Preventive Action
PA 1 PA 2 PA 3 PA 4 PA 5 PA 6 PA 7 PA 8 PA 9 PA 10 PA 11 PA 12 PA 13 PA 14 PA 15 ARP
A1 9 9 9 1521,951
A2 9 3 1 1012,574
A3 9 789,198
A4 1 9 3 413,517
A5 9 9 370,483
A6 1 3 3 9 9 358,241
A7 1 3 3 9 1 339,228
A8 1 9 293,028
A9 1 9 247,042
Total Effectiveness (TEk)
15055,585 13697,557 13697,557 10187,888 3037,722 8177,501 3721,655 1533,580 4352,030 4352,030 3224,168 3224,168 3053,055 3649,829 2562,602
Degree of Difficulty (Dk)
4 4 3 3 3 4 3 3 4 4 3 3 5 4 5
Effectiveness to Difficulty (ETD)
3763,896 3424,389 4565,852 3395,963 1012,574 2044,375 1240,552 511,193 1088,007 1088,007 1074,723 1074,723 610,611 912,457 512,520