9
ADSORPTION RATE CONSTANTS OF EOSIN IN HUMIN
Anshar, A.M.,a1 Santosa. S.J.,b and Sudiono. S.,b a
Chemistry Department, Faculty of Mathematics and Natural Science Hasanuddin Univ. Makassar 902541 bChemistry Department, Faculty of Mathematics and Natural Science Gadjah Mada Univ. Yogyakarta 90254
ABSTRAK
Eosin merupakan salah satu bahan pewarna yang banyak digunakan dalam industri dan berpotensi untuk menyeb abkan terjadinya pencemaran pada lingkungan perairan. Metode penanganan pencemaran eosin yang digunakan pada penelitian ini adalah metode adsorpsi menggunakan fraksi humin dari tanah gambut yang berasal dari kalim antan. Data yang diperoleh pada penelitian ini menunjukkan bahwa adsopsi humin yang dihasilkan dari pencucia n menggunakan HCl/HF terhadap eosin optimum pada pH 4 dengan waktu kontak 60 menit dan laju adsorpsi se besar 8,4 x 10⁻³min-1.
Kata Kunci : Adsorpsi, eosin, humin, gambut.
ABSTRACT
Eosin is one of the dyes commonly used in the industry and has the potential to cause pollution of the water environment. The Eosin pollution treatment methods used in this study was the adsorption method using humin fraction obtained from the peat land comes from Kalimantan. From the research data showed that the adsorption of eosin in humin result of washing with HCl / HF optimum at pH 4 and a contact time of 60 minutes with the adsorption-order rate was 8,4 x 10⁻³min-1
Key Words : adsorption, eosin, humic, peat
Introduction
The development of industry in Indonesia has grown rapidly. A wide range of industries established to meet the needs of the community in various fields. One kind of industry that have been developing is industry that uses dye to produce products such as cellulose fiber dyeing, silk, wool, nylon and leather in textile industry (Razae, et al, 2008) then it can cause side effects such as an increase the quantity of waste substances color. Increase of the quantity from waste substances color is needs to be watch because the release of
1
dye into the environment such as rivers (Rahmawati, 2011), the lake and the other will cause harmful pollution and become a source of nuisance aquatic life that require serious treatment efforts. From many existing pollutants that have been presented, eosin dye was quite dangerous to human health (Hamdaoui and Chiha, 2006) which was often used in industries other than methylene blue (Ansar, 2014).
Chitosan-10 Bentonite (Muna, 2014), Electrochemical (marlena, 2012), a combination of activated carbon method and photo catalysis (Riyani and Setyaningtyasnamun, 2011) but the method has not been able to provide optimal results. It was necessary to find another method that could solve the problem of pollution of the dye to the water environment without having to incur huge costs and with used materials that available in nature. One method that used to adsorb dye organic waste particular was used humin which is one of the fractions of humic compounds.
The existence of humic materials dispersed in the environment, in all lands, waters and sediments in layers of earth (Gaffeey, et al, 1996). According to Aiken, et al (1985) there was three major fraction of humic compounds that could be distinguished by their solubility:
1. Humin was the fraction of humic substances that was not soluble in water at all pH values.
2. Humic acid was a fraction of humic substances that was not soluble in water under acidic conditions but soluble at high pH.
3. Fulvic acid was the fraction of humic acid compounds that could dissolved at various pH values.
In environment, humin was largest fraction of humic compounds and relatively easy to got (Stevenson, 1994). Research conducted by Ishiwatari (1985) in some lakes in Japan gave results of 17% humic acid, fulvic acid 11% and 67% humin. Although humic acid and fulvic acid ware also influence but humin fraction played an important role because of eosin would interact with organic matter and minerals contained in humin. Based on the idea that humin could be seen as a macromolecular polyelectrolytes insoluble in acidic or
alkaline and have a main group -COOH and -OH (phenolic) (Kaled, H,, and and Fawy H., A., 2011) so that humin could interact to form a bond with eosin.
Various studies on the interaction of humin with a number of contaminants have been conducted by several experts, especially organic contaminants, such as poliaromatis hydrocarbons (PAHs) and poliklorobifenil (BCBS) which takes place relatively quickly and in some cases irreversible. In this research, we studied the interaction between humin with eosin as an organic compound whose presence in aquatic environments as waste dye
Research Method
Tool and Materials
The research tool used pH paper, filter paper outstanding, filter paper Whatmant 42, UV-vis spectrometer Hitachi 150-20, infrared spectrometer Shimadzu FTIR-820IPC, shaker, karbolit furnace, appliance titration, pH meter Orion 290A models, sieves, scales digital, dark plastic bottle, flask with various sizes, porcelain bowls, glass tools in Physics Chemistry Lab. and Inorganic Lab. Of Gadjah Mada University
Materials used peat from Pontianak and chemicals compound such as eosin, sodium hydroxide (NaOH) 0.1 M, hydrochloric acid (HCl) 37.5%, hydrochloric acid (HCl) 0.1 M, fluoride acid (HF) 0, 3 M, barium hydroxide (BaOH.8H2O), calcium acetate (Ca (CH3COO)2), hydrochloric acid 0.5% (E merck), N2 gas (PT Samator Gas), CO2-free distillate water and distilled water
Work Procedures
11 humin Isolated by the extraction method used 0.1 M NaOH for 24 hours in a nitrogen atmosphere conditions. To removed inorganic materials such as silica, clay and metal used mixed solution of 0.1 M HCl and 0.3 M HF.
2. Procedure for the determination of ash content in humin
Fifty milligrams neutral humin and humin with purification used HCl / HF put into the porcelain cup and then heated in a furnace (furnace) at a temperature of 750oC for 4 hours. Initial sample weight before and after heated noted. Each sample was carried out with 3 times the measurement (triple).
3. Determination of the quantitative composition of the COOH group and -OH phenolics.
The content of humin quantitative composition performed in this research was total acidity and content of carboxylate groups. -OH phenolic group was determined by calculated the difference between the total acidity and the content of the -COOH group.
3.1 Determination of total acidity content
One hundred milligrams of humin put in a 100 mL flask and add 20 ml of saturated Ba(OH)2 while flowing nitrogen gas. After flowing nitrogen gas, flask was closed and shaken for 24 hours at room temperature. Simultaneously performed well against the blank solution that was containing only 20 ml of saturated Ba(OH)2. The formed suspension was filtered by Whatman filter paper 42 and the residue rinsed with CO2 -free water destital. The filtrate and wash water were mix and then titrated potentiometrically with 0,5 M HCl solution standard to pH 8,4.
Total acidity (cmol / kg) determined by the equation:
( 𝑉𝑏 − 𝑉𝑠 ) 𝑥 𝑁 𝑥 105 𝑐𝑚𝑜𝑙/𝑘𝑔
𝑚𝑖𝑙𝑙𝑖𝑔𝑟𝑎𝑚 𝑠𝑎𝑚𝑝𝑒𝑙
with:
Vb = Volume of standard solution of acid used for the blank titration
Vs = Volume of standard solution of acid used for titration of the sample N = Normality of standard solution of acid
3.2 Determination of carboxylate groups
One hundred milligrams of humin put in a 100 mL flask and then added a solution of 10 mL of Mg(CH3COO)2 0,5 M and 40 mL of CO2-free water distillate. Simultaneously also prepared blanks was containing only 10 ml of Mg(CH3COO)2 0.5 M and 40 mL CO2-free distilled water then shaken for 24 hours at room temperature. The formed suspension was filtered by Whatman filter paper 42. The residue washed with CO2-free water distillate. The filtrate and wash water were mix and then titrated potentiometrically with 0.1 M NaOH standard solution to pH 9.8. The experiments carried out with two repetitions.
The content of the carboxylic group is determined by the equation:
( 𝑉𝑏 − 𝑉𝑠 ) 𝑥 𝑁 𝑥 105 𝑐𝑚𝑜𝑙/𝑘𝑔
𝑚𝑖𝑙𝑙𝑖𝑔𝑟𝑎𝑚 𝑠𝑎𝑚𝑝𝑒𝑙
with:
Vb = Volume of standard alkaline solution used for titration of the blank
Vs = Volume of standard alkaline solution used for titration of the sample N = Normality of standard alkaline
12 3.3 Determination of -OH phenolic
groups
-OH Phenolic group represents the difference of the total acidity with a -COOH group content so that the content of phenolic OH group can be determined by the equation:
-OH Phenolic = The difference between the total acidity and the -COOH group
4. Determination of optimum pH from eosin adsorption on humin.
fiftyn milligrams humin was interaction with 25 ml of eosin solution with a concentration 10 mg/L, the concentration resulted from the dilution of the initial solution with concentration 100 mg/L. The pH was adjusted by the addition of HCl or NaOH to get the initial pH value of 2,0; 4,0; 6,0; 8,0; 10,0; 12,0; and 14,0. The solution that had been regulated pH shaken for 120 minutes and allowed to stand for 24 hours to reach equilibrium. After the interaction, the filtrate and the precipitate separated by filtered. The obtained filtrate analyzed by UV-vis spectrophotometer.
5. Determination of the maximum adsorption time
fiftyn milligrams of 50 milligrams humin was interaction with 25 ml of eosin solution with concentration 10 mg/L. Mixture of eosin and humin shaken in optimum adsorption pH with variations time of 2, 4, 6, 8, 10, 12, 15, 30, 60, 90, 120, 150, 180, 210, 240 minutes. After shake, filtrate and precipitate separated by filtered. The obtained filtrate analyzed by UV-vis spectrophotometer to determaine eosine concentration
6. Determination of humin adsorption rate
Graphed eosin adsorpted (mol/L) vs. contact time (minutes) was made after known the optimum time of humin adsorption. Furthermore, determine the absorption rate of humin used equations that created by Santosa (Anshar, 2014). Humin adsorption rate on the organic compounds we know by made the plot:
A A A
C C C
0
ln
Vs
A C
t
The equation result generated linear relationship with slope = K1A and intercept = KA.
Results and discussion
1. Humin Characterization
13
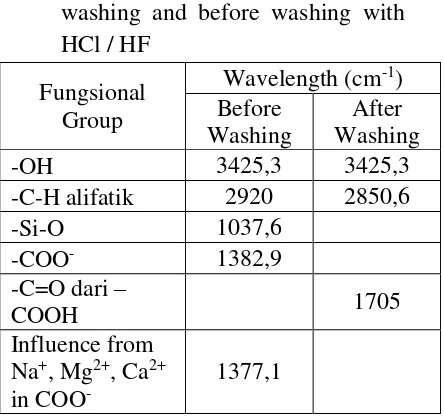
Infrared spectra humin before washing and after washing with HCl/HF showed significant differences as shown in Table 1. Washing process used acid solution (HCl / HF) was cause the release of metals that interact with a group -COO- on humin, this happens because the bond between metal ions with Cl- and F- stronger than the bond between the metal with -COO- group. -COO- Group due to release of metal and then interacted with H+ to form -COOH group after humin washed with acid (HCl/HF). Metals release process and the spectral data as discussed earlier, could also been seen from the changes in ash content, this was due to the ash content had closely
related to mineral deposits. More high the mineral content, the higher ash content. Results of the determination of the ash content of humin without washing and the washing HF / HCl are shown in Table 2. Table 2. The humin ash content without
washing, washing with aquades and the washing HCl / HF
Washing Steped ash content(%, b/b) isolated humin performed using potentiometric titration method. This data is needed to determine how many functional
groups that exist in humin especially -COOH group and -OH phenolics that can
serve as the active sites of metal adsorption.
Table 3. Comparison of content of total acidity, carboxylic groups, and phenolic hydroxyl groups in humin
Functional
2. Humin Interaction with eosin
14
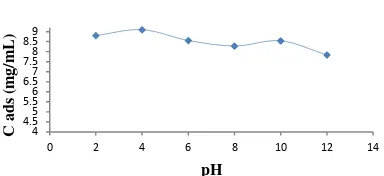
Figure 2. Relations beetwen pH and adsorbted eosin concentration.
Initial concentration of eosin was 10 ppm, solution volume 25 ml, humin weight 50 mg, time interaction was 120 minutes. The optimum adsorption humin against eosin occurred at pH 4. The interaction that occurs in acidic conditions the possibility of an interaction involving hydrogen bonds.
This was because the group -COONa and -ONa group of eosin. If the process of
dissolution under acidic conditions would hopefully lead to the release of Na+ ions carboxyl ions resulting humin negatively charged compounds.
After pH 4, an increase in pH will cause a reduction of H+ in solution. So with increasing pH will cause a decrease in the amount of eosin which teradsorp. Decrease the amount of eosin which teradsorp also due to the alkaline conditions will form OH- ions and at a pH of about 9.0 phenolic hydroxy group at humin also began dissociated and negatively charged compounds which produce large. The existence of dissociation of the phenolic
hydroxy groups are increasingly making it difficult eosin teradsorp so in this study
Optimization of adsorption contact time humin against eosin
After knowing the pH optimum for adsorption, the next parameter determined was the optimum contact time between humin with eosin, eosin initial concentration was 10 ppm, a solution of 25 ml volume, weight humin 50 mg, and pH 4. After interaction between eosin and humin the optimum time adsoption obtained when the contact time was 60 minutes at intervals of contact time between 30 minutes until 240 minutes. The results obtained indicate that after 60 minutes of adsorption by humin compounds have experienced saturation and reach equilibrium as shown in Figure 4. This becaused by existing functional groups on the surface of humin has interacted with eosin resulting entirely incapable humin again to tie eosin compound.
Figure 4. Relations beetwen time and the amount of the eosin adsobrted.
Rate constants of Reaction
15 From time optimization of data between humin with eosin, the magnitude of the reaction rate constant (k) can be calculated by making the curve ln (Co / Ct) / Ct opponent t / Ct as in equation
The reaction rate constant (k) was the value of the slope of the curve. Plot the relationship between ln (Co/Ct)/Ct Vs t/Ct for adsorption of eosin can be seen in Figure 5
Figure 5. Graph of the relationship between ln (Ct/Co)/Ct Vs t/Ct from the adsorption of eosin in humin with 10 mg eosin, the initial solution concentration was 10 ppm, the solution volume was 25 mL,
Based on the researce results obtained we can be prepared following conclusions: 1. Characterization of humin using infrared
spectroscopically, showed that prior to leaching with HCl / HF contained absorption peaks at wave numbers around 1382.9 cm-1 derived from stalling anionic -COO- but after washing with HCl / HF absorption was got weaker. Besides appearing on the new absorption peak wave numbers 1705.0 cm-1
generated by the C = O stretching vibration of the -COOH group.
2. In this research, the content of phenolic OH at humin amounted 343.5 cmol/kg higher than the carboxylic group at 210 cmol/ kg.
3. Adsorption humin against eosin optimum at pH 4 with optimum contact time was 60 minutes
4. The reaction rate constants for eosin amounted 8,4x 10⁻³ min-1
References
Aiken. G. R., McKnight, D. M., Wershaw,
R.L., dan Mac Charty. P, 1985 ”An
Introduction to Humic Substances in Soil, Sediment and Water; Geochemistry, Isolations and Characterization”, John Wiley and
Sons, New York
Ansar, AM, Santosa, SJ, and Sudiono, S., 2014, Study of Adsorption from methylene blue In Humin, Proceedings of the National Seminar Geophysics, 189-193.
Gaffey, S. J., Marley, N. A., dan Clark, S. B., 1996, Humic and Fulvic Acid and Organic Colloidal Matterial in Environmental ( in Gaffney, J. S.,et.al., 1996, Humic and Fulvic Acid ; Isolation, structure and Environmental Role)
American Chemical society., Washington Humic Substances in Lake Sediments ( in Aiken. G. R., McKnight, D. M., Wershaw, R.L., dan Mac Charty. P,
1985 ”An Introduction to Humic
Substances in Soi, Sediment and Water; Geochemistry, Isolations and
Grafik Ln (Co/Ct)/Ct lawan t/Ct
16
Characterization”), John Wiley and
Sons, New York
Kaled. H,, dan and Fawy H., A., 2011 , Effect of Different Levels of Humic Acids on the Nutrient Content, Plant Growth, and Soil Properties under Conditions of Salinity, Soil & Water Res., 6, (1): 21–29
Lawakka, I., 2005, Reactive Red Adsorption-1 Shell Activated Carbon By Walnuts As a function of time and the amount of adsorbent, unpublished thesis, Department of Chemistry, Science Faculty, University of Hasanuddin, Makassar.
Mahatmanti, FW, and Sumarni, W., 2003, Thermodynamic Study of Absorption Dye Indicator Methyl Orange (MO) In Air By Adsorbent Chitosan Solution, JSKA.Vol.VI.No.2.
Marlena, B., Mukimin, A., Susanti, E., 2012, decolorize Reactive Dyes In Textile Industry Waste Water In Electrochemistry, Journal of Industrial Pollution Prevention Technology Research, Vol.2 (2).
una, N., 2014, Adsopsi Dyes Melacite Green (MG) by Composite Chitosan Bentonite, Thesis, Department of Chemistry, Faculty of Science and Technology, State Islamic University of Sunan Kalidjaga, Yogyakarta
Prasetyo. A.E., Kurniawan.I., Hartono. SB, Ismadji.S., 2005, Adsorption of Dyes From Synthetic Wastewater Using Activated Sludge, proceedings, The 4th National Conference: Design and Application of Technology
Rahmayati, D., 2011, Effects of Industrial Activity Against Water quality Diwak In Semarang District Bergas and Pemcemaran River Water Control
Efforts, Thesis, S2, Diponegoro University, Semarang
Riyani, K., and Setyaningtyas, T., Effect of Activated Carbon photodegradation Activity Against Dyes In Textile Industry Wastewater Using TiO2 Photocatalyst, Molecules, Vol. 6. No. 2, 113-122
Saleh, N., 2004, Study of Interaction between Humin with Cu (II) and Cr (II) in the Medium Air, S2 Thesis, University of Gadjah Mada, Yogyakarta Stevenson, FJ, 1994, Humus Chemistry, Genesis, Composition, Reactions, John Wiley and Sons, New York