For your convenience Apress has placed some of the front
matter material after the index. Please use the Bookmarks
Contents at a Glance
Foreword ...
xv
About the Author ...
xvii
About the Technical Reviewer ... xix
Acknowledgments ... xxi
Introduction ... xxiii
Chapter 1: What Can Go Wrong
■
...1
Chapter 2: Guided Tour of the Development Process
■
...9
Chapter 3: Initial Requirements and Use Cases
■
...25
Chapter 4: Learning from the Data Model
■
...43
Chapter 5: Developing a Data Model
■
...59
Chapter 6: Generalization and Specialization
■
...75
Chapter 7: From Data Model to Relational Database Design
■
...93
Chapter 8: Normalization
■
...113
Chapter 9: More on Keys and Constraints
■
...129
Chapter 10: Query Basics
■
...141
Chapter 11: User Interface
■
...157
Chapter 12: Other Implementations
■
...169
Appendix
■
...189
Introduction
Everyone keeps data. Big organizations spend millions to look after their payroll, customer, and transaction data. The penalties for getting it wrong are severe: businesses may collapse, shareholders and customers lose money, and for many organizations (airlines, health boards, energy companies), it is not exaggerating to say that even personal safety may be put at risk. And then there are the lawsuits. The problems in successfully designing, installing, and maintaining such large databases are the subject of numerous books on data management and software engineering. However, many small databases are used within large organizations and also for small businesses, clubs, and private concerns. When these go wrong, it doesn’t make the front page of the papers; but the costs, often hidden, can be just as serious.
Where do we find these smaller electronic databases? Sports clubs will have membership information and match results; small businesses might maintain their own customer data. Within large organizations, there will also be a number of small projects to maintain data information that isn’t easily or conveniently managed by the large system–wide databases. Researchers may keep their own experiment and survey results; groups will want to manage their own rosters or keep track of equipment; departments may keep their own detailed accounts and submit just a summary to the organization’s financial software.
Most of these small databases are set up by end users. These are people whose main job is something other than that of a computer professional. They will typically be scientists, administrators, technicians, accountants, or teachers, and many will have only modest skills when it comes to spreadsheet or database software.
The resulting databases often do not live up to expectations. Time and energy is expended to set up a few tables in a database product such as Microsoft Access, or in setting up a spreadsheet in a product such as Excel. Even more time is spent collecting and keying in data. But invariably (often within a short time frame) there is a problem producing what seems to be a quite simple report or query. Often this is because the way the tables have been set up makes the required result very awkward, if not impossible, to achieve.
Getting It Wrong
A database that does not fulfill expectations becomes a costly exercise in more ways than one. We clearly have the cost of the time and effort expended on setting up an unsatisfactory application. However, a much more serious problem is the inability to make the best use of valuable data. This is especially so for research data. Scientific and social researchers may spend considerable money and many years designing experiments, hiring assistants, and collecting and analyzing data, but often very little thought goes into storing it in an appropriately designed database. Unfortunately, some quite simple mistakes in design can mean that much of the potential information is lost. The immediate objective may be satisfied, but unforeseen uses of the data may be seriously compromised. Next year’s grant opportunities are lost.
■ INTRODUCTION
Problems with a database are not necessarily caused by a lack of knowledge about the database product itself (though this will eventually become a constraint) but are often the result of having chosen the wrong attributes to group together in a particular table. This comes about for two main reasons:
The creator does not have a clear idea of what information the database is meant to be delivering in the short and medium term
The creator does not have a clear model of the different classes of data and their relationships to each other This book describes techniques for gaining a precise understanding of what a problem is about, how to develop a conceptual model of the data involved, and how to translate that model into a database design. You’ll learn to design better databases. You’ll avoid the cost of “getting it wrong.”
Create a Data Model
The chasm between having a basic idea of what your database needs to be able to do and designing the
appropriate tables is bridged by having a clear data model. Data modeling involves thinking very carefully about the different sets or classes of data needed for a particular problem.
Here is a very simple textbook example: a small business might have customers, products, and orders. We need to record a customer’s name. That clearly belongs with our set of customer data. What about address? Now, does that mean the customer’s contact address (in which case it belongs to the customer data) or where we are shipping the order (in which case it belongs with information about the order)? What about discount rate? Does that belong with the customer (some are gold card customers), or the product (dinner sets are on special at the moment), or the order (20% off orders over $400.00), or none of the above, or all of the above, or does it depend on the boss’s mood?
Getting the correct answers to these questions is obviously vital if you are going to provide a useful database for yourself or your client. It is no good heading up a column in your spreadsheet “Discount” before you have a very precise understanding of exactly what a discount means in the context of the current problem. Data modeling– diagrams provide very precise and easy–to–interpret documentation for answers to questions such as those just posed. Even more importantly, the process of constructing a data model leads you to ask the questions in the first place. It is this, more than anything else, that makes data modeling such a useful tool.
The data models we will be looking at in this book are small. They may represent small problems in their entirety, but more likely they will be small parts of larger problems. The emphasis will be on looking very carefully at the relationships between a few classes of data and getting the detail right. This means using the first attempts at the model to form questions for the user, to find the exceptions (before they find you), and then to make some pragmatic decisions about how much of the detail is necessary to make a useful database. Without a good data model, any database is pretty much doomed before it is started.
Data models are often represented visually using some sort of diagram. Diagrams allow you to take in a large amount of information at a glance, giving you the ability to quickly get the gist of a database design without having to read a lot of text. We will be using the class diagram notation from UML to represent our data models, but many other notations are equally useful.
Database Implementation
Once you have a data model that supports your use cases (and all the other details that you have discovered along the way), you know how big your problem is and the type of detail it will involve. You now have a good foundation for designing a suitable application and undertaking the implementation.
■ INTRODUCTION
The translation from data model to database design is fairly straightforward; however, the actual
implementation is not quite so simple. A great deal of work is necessary to ensure that the database is convenient for the eventual user. This will mean designing a user interface with a clear logic, good input facilities, the ability to quickly find data for editing or deleting, adaptable and accurate querying and reporting features, the ability to import and export data, and good maintenance facilities such as backup and archiving. Do not underestimate the time and expertise necessary to complete a useful application even for the smallest database! Considerations such as user interface, maintenance, archiving, and such are outside the scope of this work but are well covered in numerous books on specific database products and texts on interface design.
Objective of This Book
Setting up a database even for a small problem can be a big job (if you do it properly). This book is primarily for beginners or those people who want to set up a small, single–user database. The ideas are applicable to larger, multiuser projects, but there are considerable additional problems that you will encounter there. We do not look at problems to do with concurrency (many users acting together), nor efficiencies, nor how you manage a large project. There are many excellent books on software engineering and database management that deal with these issues.
Chapter 1
What Can Go Wrong
The problem with a number of small databases (and quite probably with many large ones) is that the initial idea of how to record and store the data is not necessarily the most useful one. Often a table or spreadsheet is designed to mimic a possible data entry screen or a hoped–for report. This practice may be adequate for solving the immediate problem (e.g., storing the data somewhere); however, mimicking a data entry screen or report in your design inevitably leads to problems as the requirements evolve. It can make it difficult, if not impossible, to get information for different reports or summaries that were not originally envisaged but nevertheless should be available given the data collected.
This chapter gives examples drawn from real life to illustrate some very basic types of problems encountered when data is stored in poorly designed spreadsheets or tables. These are real examples that I have encountered in my own design work. They do not come from a textbook or out of an exam paper. Some of the data has been removed or altered to protect the identities of the guilty.
Mishandling Keywords and Categories
A common problem in database design is the failure to properly deal with keywords and categories. Many database applications involve data that is categorized in some way; products or events may be of interest to certain categories of people, and customers may be categorized by age, interest, or income (or all three). When entering data, you usually think of an item with its particular list of categories or keywords. However, when you come to preparing reports or doing some analyses, you may need to look at things the other way around. You often want to see a category with a list of all its items or a count of the number of items. For example, you might ask, “What percentage of our customers is in the high–income bracket?” If keywords and categories are not stored correctly initially, these reports can become very difficult to produce.
CHAPTER 1 ■ WHAT CAN GO WRONG
example 1-1. the plant Database
Figure
1-1
shows a small portion of a database table recording information about plants. Along with
the botanical and common names of each plant, the developer decides it would be convenient to keep
information on the uses for each plant. This is to help prospective buyers decide whether a
plant is appropriate for their requirements.
If we look up a plant, we can immediately see what its uses are. However, if we want to find all the
plants suitable for hedging, for example, we have a problem. We need to search through each of the use
columns individually. Producing a report of all hedging plants would require some logic along the lines of:
“IF use1 = ‘hedging’ OR use2 = ‘hedging’ OR use3=‘hedging’.” Also, the database table as it stands
restricts a plant to having three uses. That may be adequate for now, but if that three–use limit changes,
the table would have to be redesigned to include a new column(s). Any logic will need to be altered to
include “OR use4=‘hedging’,” and at the back of our minds we just know that whatever number of uses
we choose, eventually we will come across a plant that needs one more. The carefully collected data has
unfortunately been saved in a manner that is difficult to use and maintain.
In Example 1-1, the real shame is that all the data has been carefully collected and entered, but the design of the table makes it extremely difficult to answer a question such as, “What plants are good for shelter?” The developer has done better than many in separating the uses into individual columns. Often data like this can be found stored in a single column separated by commas or other punctuation. (E.g., an entry in a single column for uses might read: “shelter, hedging, soil stability.”) This is even more difficult to manage than the design in Figure 1-1.
The problem is that the database was designed principally to satisfy the user’s immediate problem, which is: “I need to store all the info I have about each plant.” The developer thought of the data in terms of a single type or class, Plant, and he saw each use as an attribute of a plant in much the same way as its genus or common name. This is fine if all you want to know are answers to questions like, “What uses does this plant have?” The approach is not so useful when going in the other direction, searching for plants having a given use.
In Example 1-1, we really have two sets or classes of data, Plants and Uses, and we are interested in the connections between them. The data modeling techniques described in the rest of the book are a practical way of clarifying exactly what it is you expect from your data and helping you decide on the best database design to support that.
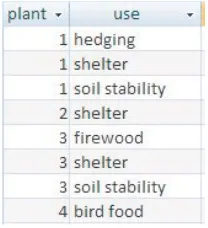
Jumping ahead a bit to see a solution for the plant database problem, you can quite quickly set up a useful relational database by creating the two tables shown in Figure 1-2. (Some extra tables would be even better, but more about that in Chapter 2.)
CHAPTER 1 ■ WHAT CAN GO WRONG
An end user with modest database skills would be able to set up the appropriate keys, relationships, and joins and produce some useful reports. A simple query on (or even a filtering or sorting of ) the Uses table will enable the user to find, for example, all shelter plants. There is no restriction now on how many uses a plant can have. The initial setup is slightly more costly, in time and expertise, than for the single table described in Example 1-1, but these separate tables will be able to provide a great deal of additional information.
Example 1-1 shows us one way we can satisfactorily deal with categories. Unfortunately, there are other problems in store. In Example 1-1, the categories were quite clear cut, but this is not always the case. Example 1-2 shows the problems that occur when categories and keywords are not so easily determined.
example 1-2. researCh Interests
An employee of a university’s liaison team often receives calls asking to speak to a specialist in a particular
topic. The liaison team decides to set up a small spreadsheet to maintain data about each staff member’s
main research interests. Originally, the intention is to record just one main area for each staff member,
but academics, being what they are, cannot be so constrained. The problem of an indeterminate number
of interests is solved by adding a few extra columns in order to accommodate all the interests each staff
member supplies. Part of the spreadsheet is shown in Figure
1-3
.
We are able to see at a glance the research interests of a particular person, but as was the case in Example
1-1, it is awkward to do the reverse and find who is interested in a particular topic. However, we have an
additional problem here. Many of the research interests look similar but they are described differently. How
easy will it be to find a researcher who is able to “visualize data”?
Table Plants
Table Uses
Figure 1-2. An improved database design to represent Plants and Uses
CHAPTER 1 ■ WHAT CAN GO WRONG
As in Example 1-1, the table has been designed taking just one class of data into consideration: in this case, People. Really, though, we have two classes, People and Interests, and we are concerned with the connections or relationships between them. A solution analogous to that in Example 1-1 would be much more useful in this case, too.
Creating a table of people is reasonably straightforward, but the table of interests poses some problems. In Example 1-1, the different possible uses were fairly clear (hedging, shelter, etc.). What are the different possible research interests in Example 1-2? The answer is not so obvious. A quick glance at the data displayed shows eight interests, but it is reasonable to assume that “visualisation” and “visualization” are merely different spellings of the same topic. But what about “scientific visualisation” and “visualisation of data”—are these the same in the context of the problem? What about “computer visualisation”? Any staff member with one of these interests would probably be useful for an outside inquiry about how to visualize some data.
Having decided on two classes of data, People and Interests, we now need to clearly define what we mean by them. People isn’t too difficult—you might have to think about which staff members are to be involved and whether postgraduate students should also be included. However, Interests is more difficult. In the current example, an interest is anything that a staff member might think of. Such a fuzzy definition is going to cause us a number of problems, especially when it comes to doing any reporting or analysis about specific interests. One solution is to predetermine a set of broad topics and ask people to nominate those applicable to them. But that task is far from simple. People will be aggrieved that their pet topic is not included verbatim and hours (probably months) could be wasted attempting to find agreement on a complete list. And this list may well comprise a whole hierarchy of categories and subcategories. Libraries and journals expend considerable energy and expertise devising and maintaining such lists. Maybe such a list will be useful for the problem in Example 1-2, but then again maybe not.
Having foreseen the difficulties, you may decide that the effort is still worthwhile, or you may reconsider and choose a different solution. In the latter case, it may well be easier for the liaison team to make a stab at the most likely individual and let a real human being sort out what is required. In just the three-month period prior to drafting this chapter, I have seen three different attempts at setting up spreadsheets or databases to record research interests. Each time, a number of hours were spent collecting and storing data before the perpetrator started to run into the problems I’ve just described. None of the databases is being maintained or used as envisioned.
Repeated Information
Another common problem is unnecessarily storing the same piece of information several times. Such redundancy is often a result of the database design reflecting some sort of input form. For example, in a small business, each order form may record the associated information of a customer’s name, address, and phone number. If we design a table that reflects such a form, the customer’s name, address, and phone number are recorded every time an order is placed. This inevitably leads to inconsistencies and problems, especially when the customer moves from one address to another. We might want to send out an advertising catalog, and there will be uncertainty as to which address should be used. Sometimes the repeated information is not quite so obvious. Example 1-3 illustrates one such case.
example 1-3. InseCt Data
1Team members of a long-term environmental project regularly visit farms and take samples to determine
the numbers of particular insect species present. Each field on a farm has been given a unique code, and
on each visit to a field a number of representative samples are taken. The counts of each species present in
each sample are recorded.
CHAPTER 1 ■ WHAT CAN GO WRONG
Figure
1-4
shows a portion of the data as it was recorded in a spreadsheet.
The information about each farm was recorded (quite correctly) elsewhere, thus avoiding that data being
repeated. However, there are still problems. The fact that field ADhc is on farm 1 is recorded every visit, and
it does not take long to find the first data entry error in row 269. (The coding used for the fields raises other
issues that we will not address just now.)
Figure 1-4. Insect data in a spreadsheet
On the face of it, the error of listing field ADhc under farm 2 instead of farm 1 in Figure 1-4 doesn’t seem like such a big deal—but it is avoidable. The fact that the farm was recorded in this spreadsheet means that the data is probably likely to be analyzed by farm, and now any results for farms 1 and 2 are potentially inaccurate. And how many other data entry errors will there be over the lifetime of the project? Given that the results in Example 1-3 came from a carefully designed, long–term experiment and were to be statistically analyzed, it seems a shame that such errors are able to slip in when they can be easily prevented.
It is important to distinguish the difference between data input errors (anyone can make typos now and then) and design errors. The problem in Example 1-3 is not that field ADhc was wrongly associated with farm 2 (a simple error that could be easily fixed), but that the association between farm and field was recorded so many times that an eventual error became almost certain. And errors such as these can be very difficult to detect.
Another piece of information is also repeated in the spreadsheet in Example 1-3: the date of a visit. The information that field ADhc was visited on Aug-11 is repeated in rows 268 to 278, creating another source of avoidable errors (e.g., we could accidentally put Aug-10 in row 273). Such an error would affect any analyses based on date.
The repeated visit date information in Example 1-3 also gives rise to an additional and more serious problem: what do you do with miscellaneous information about a particular visit (e.g., it was raining at the time—quite important if you are counting insects)? Is it just included on one row (making it difficult to find all the affected samples), or does it go on every row for that visit (awkward and compounding the repeated information problem)? In fact, the weather information in this case was recorded quite separately in a text document, thereby making it impossible to use the power of the software to help in any analyses of weather.
CHAPTER 1 ■ WHAT CAN GO WRONG
about fields and visits into separate tables not only reduces problems with repeated information, but allows more data (soil types for fields, weather conditions for visits) to be easily added. The Counts table still suffers the same problems as the tables in Examples 1-1 and 1-2, but that can be addressed. We will return to this example in Chapter 4.
Designing for a Single Report
Another cause of a problematic database is to design a table to match the requirements of a particular report. A small business might have in mind a format that is required for an invoice. A school secretary may want to see the whereabouts of teachers during the week. Thinking backward from one specific report can lead to a database with many flaws. Example 1-4 is a particular favorite of mine, because the first time I was ever paid real money to fix up a database was because of this problem (clearly student record software has moved on a great deal since then!).
example 1-4. aCaDemIC results
A university department needs to have its final–year results in a format appropriate for taking along to the
examiners’ meeting. The course was very rigidly prescribed with all students completing the same subjects,
and a report similar to the one in Figure
1-6
was generated by hand prior to the system being computerized.
This format allowed each student’s performance to be easily compared across subjects, helping to determine
honors’ boundaries.
Table Fields
Table Visits
Table Counts
CHAPTER 1 ■ WHAT CAN GO WRONG
A database table was designed to exactly match the report in Figure
1-6
, with a field for each column. The
first year the database worked a treat. The next year the problems started. Can you anticipate them?
Some students were permitted to replace one of the papers with one of their own choosing. The table was
amended to include columns for option name and option mark. Then some subjects were replaced, but the
old ones had to be retained for those students who had taken them in the past. The table became messier,
but it could still cope with the data.
What the design couldn’t handle was students who failed and then reenrolled in a subject. The complete
academic record for a student needed to be recorded, and the design of the table made it impossible to
record more than one mark if a student completed a subject several times. That problem wasn’t noticed
until the second year in operation (when the first students started failing). By then, a fair amount of effort
had gone into development and data entry. The somewhat curious solution was to create a new table for
each year, and then to apply some tortuous logic to extract a student’s marks from the appropriate tables.
When the original developer left for a new job, several years’ worth of data were left in a state that no one
else could comprehend. And that’s how I got my first database job (and the database coped with changing
requirements over several years).
Example 1-4 is particularly good for showing how much trouble you can get into with a poor design. The developer could see the problem from the point of view of the required report. He thought in terms of one class: Student. In reality, at the very minimum, we have two classes, Student and Subject, and we are interested in the relationship between them. In particular, we would like to know what mark a particular student earned in a particular subject. Chapter 4 will show how an investigation of a Many–Many relationship such as the one between Subject and Student would have led to the introduction of another class, Enrollment. This allows different marks to be recorded for different attempts at a subject. Taking this approach the oversight concerning how to deal with a student’s failure would have been discovered, and this whole sorry mess would have been avoided.
Summary
The first thoughts about how to design a database may be influenced by a particular report or by a particular method of input. Sometimes the driver for a database is simply that some valuable information has come to hand and needs to be “put somewhere.” The hurried creation of a database or spreadsheet can lead to a design that cannot cope with even simple changes to the information you would like to retrieve. It is important to think carefully about the underlying data, and design the database to reflect the information being stored rather than what you might want to do with the data in the short term.
CHAPTER 1 ■ WHAT CAN GO WRONG
testIng Your unDerstanDIng
exercise 1-1
A school is planning some outdoor activities for its students. The staff wants to create a database of how
parents can help. The secretary sets up the database table in Figure
1-7
to keep the information.
What problems can you foresee in making good use of this information?
Suggest some better ways that this information could be stored.
exercise 1-2
A small library keeps a roster of who will be at the desk each day. They have a database table as shown in
Figure
1-8
.
What problems can you foresee in making good use of this information?
Suggest some better ways that this information could be stored.
Figure 1-7. Initial database table for recording parent contributionsChapter 2
Guided Tour of the Development
Process
The decision to set up a small database usually arises because there is some specific task in mind: a scientist may have some experimental results that need safekeeping; a small business may wish to produce invoices and monthly statements for its customers; a sports club may want to keep track of teams and subscriptions.
The important thing is not to focus solely on the immediate task at hand but to try to understand the data that are going to support that task and other likely tasks. This is sometimes referred to as data independence. In general, the fundamental data items (names, amounts, dates) that you keep for a problem will change very little over a long time. The values will of course be constantly changing, but not the fact that we are keeping values for names, amounts, and dates. What you do with these pieces of data is likely to change quite often. Designing a database to reflect the type of data involved, rather than what you currently think is the main use for the data, will be more advantageous in the long term.
For example, a small business may want to send invoices and statements to its customers. Rather than thinking in terms of a statement and what goes on it, it is important to think about the underlying data items. In this case, these items are customers and their transactions. A statement is simply a report of a particular customer’s transactions over some period of time. In the long term, the format of the statement may change, for example, to include aging or interest charges. However, the underlying transaction data will be the same. If the database is designed to reflect the fundamental data (customers and transactions), it will be able to evolve as the requirements change. The type of data will stay the same, but the reports can change. We might also change the way data is entered (transactions might be entered through a web page or via e-mail), and we might find additional uses for the data (customer data might be used for mail–outs as well as invoicing).
CHAPTER 2 ■ GUIDED TOUR OF THE DEVELOPMENT PROCESS
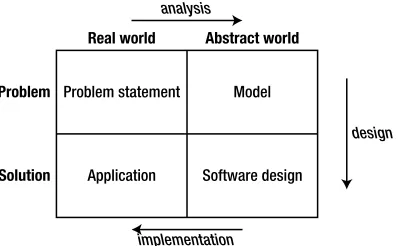
Using Figure 2-1 as a way of thinking about software processes, we will now look at how the various steps relate to setting up a database project by applying those steps to Example 1-1, “The Plant Database.”
Initial Problem Statement
We start with some initial description of the problem. One way to represent a description is with use cases, which are part of the Unified Modeling Language (UML),2 a set of diagramming techniques used to depict various aspects of the software process. Use cases are descriptions of how different types of users (more formally known as actors) might interact with the system. Most texts on systems analysis include discussions about use cases. (Alistair Cockburn’s book Writing Effective Use Cases3 is a particularly readable and pragmatic account.) Use cases can be at many different levels, from high–level corporate goals down to descriptions of small program modules. We will concentrate on the tasks someone sitting in front of a desktop computer would be trying to carry out. For a database project, these tasks are most likely to be entering or updating data, and extracting information based on that data.
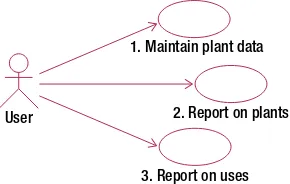
The UML notation for use cases involves stick figures representing, in our case, types of users, and ovals representing each of the tasks that the user needs to be able to carry out. For example, Figure 2-2 illustrates a use case in which a user performs three as yet unknown tasks. However, those stick figures and ovals aren’t really enough to describe a given interaction with a system. When writing a use case, along with a diagram you should create a text document describing in more detail what the use case entails.
User
Task 3
Task 2 Task 1
Figure 2-2. UML notation for use cases4
1 Marvin V. Zelkowitz, Alan C. Shaw, and John D. Gannon, Principles of Software Engineering and Design
(Englewood Cliffs, NJ: Prentice-Hall, 1979), p. 5.
2 Grady Booch, James Rumbaugh, and Ivar Jacobsen, The Unified Modeling Language User Guide (Boston,
MA: Addison Wesley, 1999).
3 Alistair Cockburn, Writing Effective Use Cases (Boston, MA: Addison Wesley, 2001).
4 The diagrams in this book were prepared using Rational Rose (http://www.rational.com/). The software
was made available under Rational’s Software Engineering for Educational Development (SEED) Program. Figure 2-1. The software process (based on Zelkowitz et al., 19791)
CHAPTER 2 ■ GUIDED TOUR OF THE DEVELOPMENT PROCESS
Figure 2-3. Original data of plants and uses
Let’s see how use cases can be applied to the problem from Example 1-1 in the last chapter. Figure 2-3 recaps where we started with an initial database table recording plants and their uses.
If we consider what typical people might want to do with the data shown in Figure 2-3, the use cases suggested in Example 2-1 would be a start.
example 2-1. InItIal use Cases for the plant Database
Figure
2-4
shows some initial use cases for the plant database. The text following the figure describes each
use case.
As explained in the previous chapter, if the data is stored as in Figure 2-3, we cannot conveniently satisfy the requirements of all the use cases in Example 2-1. It is easy to get information about each plant (use case 2) by looking at each row in the table. However, finding all the plants that satisfy a particular use is extremely awkward. Have a go at finding all the plants suitable for firewood. You have to look in each of the use columns for every row.
Figure 2-4. First attempt at use cases for the plant database User
1. Maintain plant data
2. Report on plants
3. Report on uses
Use case 1
: Enter (or edit) all the data we have about each plant; that is, plant ID, genus, species, common
name, and uses.
CHAPTER 2 ■ GUIDED TOUR OF THE DEVELOPMENT PROCESS
Analysis and Simple Data Model
Now that we have an initial idea of where we are heading, we need to become a little abstract and form a model of what the problem is really about. In terms of Figure 2-1, we are moving across the top of the diagram.
A practical way to start to get a feel for what the data involves is to sketch an initial data model that is a representation of how the different types of data interact. UML provides class diagrams that are a useful way of representing this information. There are many products that will maintain class diagrams, but a sketch with pencil and paper is quite sufficient for early and small models. A large portion of this book is about the intricacies of data modeling, and the following sections provide a quick overview of the definitions and notation.
Classes and Objects
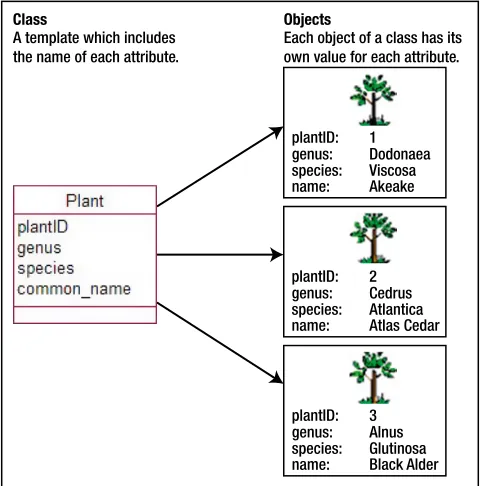
Each class can be considered a template for storing data about a set of similar things (places, events, or people). Let’s consider Example 2-1 about plants and their uses. An obvious candidate for our first class is the idea of a Plant. Each plant can be described in a similar way in that each has a genus, a species, a common_name, and perhaps a plantID number. These pieces of information, that we will keep about each plant, are referred to as the attributes (or properties) of the class. Figure 2-5 shows the UML notation for a class and its attributes. The name of the class appears in the top panel, and the middle panel contains the attributes. For some types of software systems, there may be processes that a class would be responsible for carrying out. For example, an Order class related to an online shopping cart might have a process for calculating a price including tax. These are known as methods and appear in the bottom panel. For predominantly information–based problems, methods are not usually a major consideration in the early stages of the design, and we will ignore them for now.
CHAPTER 2 ■ GUIDED TOUR OF THE DEVELOPMENT PROCESS
A template which includes the name of each attribute.
Class Objects
Each object of a class has its own value for each attribute.
Figure 2-6. A class and some of its objects
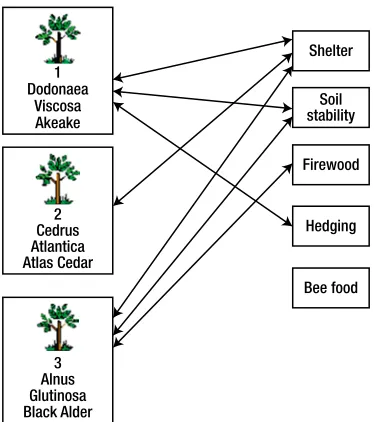
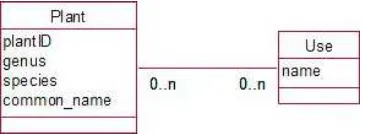
The Plant class could include other attributes, such as typical height, lifespan, and so on. What about the uses to which a plant can be put? In the database table in Figure 2-3, these uses were included as several attributes (use1, use2, and so on) of a plant. In Example 1-1, we saw how having uses stored as several attributes caused a number of problems. What we have here is another candidate for a class: Use. In Chapter 5, we will discuss in more detail how we can figure out whether we need classes or attributes to hold information. Our new class, Use, will not have many attributes, possibly just name. Each object of the Use class will have a value for name such as “hedging,” “shelter,” or “bird food.” What is particularly interesting for our example is the relationship between the Use and Plant classes.
Relationships
CHAPTER 2 ■ GUIDED TOUR OF THE DEVELOPMENT PROCESS
In a database, we would usually create a table for each class, and the information about each object would be recorded as a row in that table as shown in Figure 2-8. The information about the specific relationship instances would also be recorded in a table. For a relational database, you would expect to find tables such as those in Figure 2-8 to represent the plants and relationship instances shown in Figure 2-7. We will look further at how and why we design tables like these in Chapter 7. For now, just convince yourself that it contains the appropriate information.
Table Plant
Table Plant Uses
Figure 2-8. Plant objects and instances of the relationship between Plants and Uses expressed in database tables 1
Dodonaea
Shelter
Soil stability
Firewood
Hedging
Bee food Viscosa
Akeake
2 Cedrus Atlantica Atlas Cedar
3 Alnus Glutinosa Black Alder
Figure 2-7. Some instances of the relationship between Plant and Use
CHAPTER 2 ■ GUIDED TOUR OF THE DEVELOPMENT PROCESS
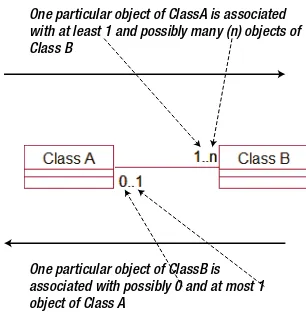
Relationships are read in both directions. Figure 2-9 shows how many objects of the right–hand class can be associated with one particular object of the left–hand class and vice versa. When we want to know how many objects of ClassB are associated with ClassA, we look at the numbers nearest ClassB.
A great deal can be learned about data by investigating the cardinality of relationships, and we will look at the issue of cardinality further in Chapter 4. The current chapter concentrates on the notation for class diagrams and what the diagrams can tell you about the relationships between different classes. Figure 2-10 shows some relationships that could be associated with small parts of some of the examples you saw in the Chapter 1. Figure 2-9. A data model expressed as a UML class diagram
One particular object of ClassB is associated with possibly 0 and at most 1 object of Class A
One particular object of ClassA is associated with at least 1 and possibly many (n) objects of Class B
CHAPTER 2 ■ GUIDED TOUR OF THE DEVELOPMENT PROCESS
Figure 2-10 is consistent in that the phrases in the right-hand columns accurately describe the diagrams. Whether each diagram is appropriate for a particular problem is quite a different question. For example, in the first row in Figure 2-10, why would we want a use that has no plants associated with it? It is questions like this that help us to understand the intricacies of a problem, and we will discuss these in Chapter 4. At the moment, none of the problems have been sufficiently defined to know if the diagrams in Figure 2-10 are accurate, but they are reasonable first attempts.
Further Analysis: Revisiting the Use Cases
Using the notation for class diagrams, we can make a first attempt at a data model diagram to represent our plants example. We have a class for both plants and uses, and the relationship between them looks like Figure 2-11.
We now need to check whether this model is able to satisfy the requirements of the three use cases in Figure 2-4:
Use case 1: Maintain plant information. We can create objects for each plant and record the attributes we might require now or in the future. We can create use objects, and we can specify relationship instances between particular plant and use objects.
Use case 2: Report on plants. We can take a particular plant object (or each one in turn) and find the values of its attributes. We can then find all the use objects related to that plant object.
Use case 3: Report on uses. We can take a particular use object and find all the plant objects that are related to it.
So far not too bad. But let’s look a bit more carefully. Use case 1 is really two or maybe three separate tasks. If we consider how the database will actually work in practice, it seems likely that the different uses (hedging, shelter, etc.) would be entered right at the start of the project and be updated from time to time. Entering information about uses is a task that a user might want to perform independently of any specific plant information. At some later time, the same user, or someone else, may want to enter details of a plant and relate it to the uses that are already recorded.
These are important questions to consider about any use cases related to input. How will it be done in practice? Will different people be involved? Will bits of the data be entered at different times? Answering these questions is the first part of the analysis, where we have to get inside the users’ heads to find out what they really do. (Don’t ever rely on them telling you.)
Tip
■
For data entry or editing, separate the tasks done by different people or at different times into their own use
cases.
CHAPTER 2 ■ GUIDED TOUR OF THE DEVELOPMENT PROCESS
Now let’s look at use case 2 where we want to report about plants. We can find out more about the problem by probing a bit more deeply into how the user envisages the reporting of information about plants. Think about the following dialog:
You: Would you like to be able to print out a list of all your plants to put in a folder or send to people?
User: That would be good.
You: What order would you like the plants to be listed in?
User: By their genus, I guess. Alphabetical?
You: Genus? So you’d like, for example, all the Eucalyptus plants together.
User: Yep, that would be good.
At this point in the conversation, we see another level of the problem. (Give yourself bonus points if you’ve already thought of the issue I’m about to describe.) If we look carefully at the data in the original table, we can see that it appears that each genus includes a number of species, and each of these species can have many uses. Another question can confirm whether we understand the relationship between genus and species correctly.
You: So each species belongs to just one genus? Is that right?
User: That’s right.
We can see that asking questions about the reporting use cases in the initial problem statement is another excellent way to find out more about the problem.
Tip
■
For data retrieval or reporting tasks, ask questions about which attributes might be used for sorting,
group-ing, or selecting data. These attributes may be candidates for additional classes.
We now realize that we have a new class, Genus, to add to our data model. Why is it important to include this new class? Well, if genus remains as simply an attribute of our original Plant class, we can enter pretty much any value for each object. Two objects with genus Eucalyptus might end up with different spellings (almost certainly if I were doing the data entry). This would cause problems every time we wanted to find or count or report on all Eucalyptus plants. The fact that our user has mentioned that grouping by genus would be useful means that it is important to get the genus data stored appropriately. Our revised data model in Figure 2-12 shows how genus can be represented so that the data is kept accurately.
CHAPTER 2 ■ GUIDED TOUR OF THE DEVELOPMENT PROCESS
We now have a set of genus objects, and each plant must be associated with exactly one of them. You will see in Figure 2-12 that we have also renamed the Plant class to Species, as it is the species, or type of plant, about which we are keeping information, not actual physical plants. This opens the way for future extension of the model to keep information about actual plants if we so wish (e.g., when each was planted, when it was pruned, and so on).
Entering the values of each genus will likely be a separate job from entering data for each species, so it should have its own use case. We don’t want or need to enter a new object for the Eucalyptus genus every time we enter a new species.
Example 2-2 shows the amended use cases. See how the reporting use cases can now be much more precisely defined in terms of the data model.
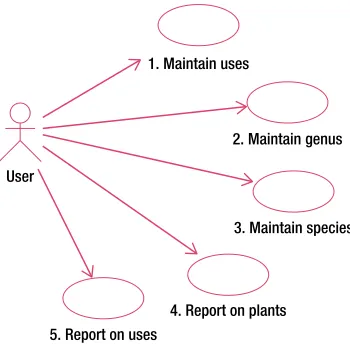
example 2-2. revIseD use Cases for the plant Database
Figure
2-13
shows the revised use cases for the plant problem. Text following the figure describes each use
case.
User
1. Maintain uses
2. Maintain genus
3. Maintain species
4. Report on plants 5. Report on uses
Figure 2-13. Revised use cases for the plant problem
Use case 1
: Maintain uses. Create or update a use object. Enter (or update) the name.
Use case 2
: Maintain genus. Create or update a genus object. Enter the name.
Use case 3
: Maintain species. Create a species object. Generate a unique ID, and enter the species and
common name. Associate the new species object with one of the existing genus objects and optionally
associate it with any number of the existing uses.
Use case 4
: Report plant information. For each genus object, write out the name and find all the associated
species objects. For each species object, write out the species and common name. Find all the associated
uses and write out their names.
CHAPTER 2 ■ GUIDED TOUR OF THE DEVELOPMENT PROCESS
What we have done here is taken some initial use cases and explored the details (e.g., how would you like the plants ordered in the report?). This led us to update the class diagram. We then looked at how the new class diagram copes with the tasks we need to carry out. This is an iterative process and forms the main part of the analysis of the problem. After a few iterations, we will have a much clearer idea of what the users want and what they mean by many of the terms they use.
Design
After a few iterations of evaluating the use cases and class diagrams, we should have an initial data model and a set of use cases that show in some detail how we intend to satisfy the requirements of the users. The next stage is to consider what type of software would be suitable for implementing the project. For a database project, we could choose to use a relational database product (such as MySQL or Microsoft Access), a programming language (for example, Visual Basic or Java), or for small problems maybe a spreadsheet (such as Microsoft Excel) will be sufficient.
Here is a brief overview of how the design might be done in a relational database. We consider the details more thoroughly in Chapters 7 to 9, so if you don’t follow all the reasoning here, don’t panic. For those readers who already know something about database design, please excuse the simplifications.
In very broad terms, each class will be represented by a database table. Because each species can have many uses and vice versa, we need an additional table for that relationship. This is generally the case for relationships having a cardinality greater than 1 at both ends (known as Many–Many relationships). (There will be more about these additional tables in Chapter 7.) The tables are shown in Figure 2-14 as they would look in Microsoft Access. Three tables correspond to the classes in Figure 2-12 and the extra table, PlantUse, gives us somewhere to keep the relationships between plant species and uses (Figures 2-7 and 2-8). The other relationships between the classes can be represented within the database by setting referential integrity between the four tables (more about this in Chapter 7).
Figure 2-14. Representing classes and relationships in Microsoft Access
CHAPTER 2 ■ GUIDED TOUR OF THE DEVELOPMENT PROCESS
We have now done some analysis to understand the details of the problem and represented those details with use cases and a class diagram. We have also started a design for a relational product such as Access, SQL Server, or MySQL that represents our class diagram as tables. We can now think about implementing the database.
Implementation
We will not be going into the intricacies of how to implement a database in any particular program, but it is useful to see where the analysis is leading us in general terms. The data model in Figure 2-12 can be represented very accurately in a relational database product such as MySQL or Microsoft Access as shown in Figure 2-14. The first stage in the implementation is to set up these tables and the foreign keys that represent the relationships, and then input some data. Figure 2-15 shows some of the data that would be in relational database tables set up according to the design in Figure 2-14.
Table Genus
Table Use
Table Species
Table PlantUse
(The value of genus must be one of the values in the Genus table)
(The value of plant must be one of the values in the Species table. The value of use must be one of the values in the Use table)
CHAPTER 2 ■ GUIDED TOUR OF THE DEVELOPMENT PROCESS
We have now implemented our design, but we still need to provide convenient ways to maintain and retrieve the data. This means we have to provide forms and reports that will efficiently satisfy the requirements in our revised set of use cases.
Interfaces for Input Use Cases
We need to provide the users of our plant system with a nice way to input their data. The use cases for
maintaining genus and use data are easily taken care of. We can enter the data directly into the appropriate table usually via an interface such as a form or a web page. The use case for maintaining species information is a little trickier. We need to update two tables: Species (for the data about each species) and PlantUse (because we need to specify which uses each species is associated with). Some database products have utilities to facilitate the entry of data into two tables simultaneously, usually via a form. Alternatively, we might have a web page with a script to insert the data into the appropriate tables.
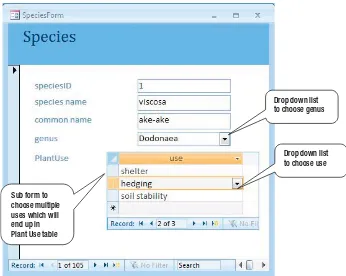
Figure 2-16 shows a very basic form for entering data about a particular species, It was created using the Form Wizard in Microsoft Access. This form allows us to enter data that will end up as one row in the Species table and several rows in the PlantUse table (one for each use for this particular species). The form also provides convenient ways to establish the relationships between a species and its genus and uses by providing drop– down lists that will contain each of the possible genus or use objects. This is one possible solution to satisfy the requirements of use case 3 (maintaining species data) in an accurate and convenient way.
Drop down list to choose genus
Sub form to choose multiple uses which will end up in Plant Use table
Drop down list to choose use
CHAPTER 2 ■ GUIDED TOUR OF THE DEVELOPMENT PROCESS
Reports for Output Use Cases
With the data stored in separate tables, the reporting and querying facilities in database products make extracting (simple) information reasonably straightforward. We will not go into the detail of how to set up queries and reports now, but we will look at two possible reports that would satisfy our reporting use cases. Most good report generators allow the data to be selected, ordered, and grouped in various ways. By grouping on either genus or use, we can quite simply provide the information to satisfy the two reporting use cases from Figure 2-13. Figure 2-17 shows a report grouped by uses and shows the plants that are appropriate for each use. The report was created very simply using default options in the Access Report Wizard.
Figure 2-17. A simple report satisfying the use case for providing information on plants suitable for a specific use
CHAPTER 2 ■ GUIDED TOUR OF THE DEVELOPMENT PROCESS
Summary
We have now taken the complete trip from original imprecise problem statement to a possible final solution for our very simple plants and uses example. The steps are summarized here and illustrated in Figure 2-19.
1. Express the problem in terms of what a user might want to achieve. For a database problem, this will typically be in terms of the data to be stored and the information that needs to be retrieved. Sketch some initial use cases and a data model.
2. Think about other possible uses of the information and how the data might be usefully ordered or grouped. Undertake an iterative analysis process of reconsidering the data model and the use cases, until you are satisfied that you have a complete and precise understanding of the problem. For larger problems, this stage may include making some simplifying or other pragmatic choices. The bulk of this book will concentrate on this phase of the process.
3. Choose the type of product to manage the data and create an appropriate design. For a relational database, this will involve designing tables, keys, and foreign keys. Different structures will be required if the project is to be implemented in some other type of product such as a programming language or a spreadsheet. The design phase is discussed more fully in Chapters 7 to Chapter 9.
4. Build the application. For a relational database, this will include setting up the tables and developing forms and reports to satisfy the use cases. The mechanics of how to do this in any particular product is outside the scope of this book, but there are numerous how–to books available that will help you.
Real world
CHAPTER 2 ■ GUIDED TOUR OF THE DEVELOPMENT PROCESS
testIng Your unDerstanDIng
exercise 2-1
A small sports club keeps information about its members and the fees they pay. The secretary wants to be
able to record when members pay and print a report similar to that in Figure
2-20
.
a) Think about when the different pieces of data might be entered. Sketch an initial use
case diagram for data entry.
b) Consider what different things you are keeping information about and sketch a
simple class diagram.
Chapter 3
Initial Requirements and Use Cases
In this chapter, we consider part of the first step from real-world problem to eventual real–world solution as described in Chapter 2. First we need to make sure we really understand the problem. This may sound obvious, but it is surprising how often people set about implementing a database before they understand the problem completely. There are two things we need to do: understand what tasks need to be carried out by all the people who will use the system, and then figure out what data needs to be stored to support them. Use cases and class diagrams as shown in Figure 3-1 are a great way to start to consolidate our understanding of a problem.
User
1. Maintain plant data
2. Report on plants
3. Report on uses
User
1. Maintain uses
2. Maintain genus
3. Maintain species
4. Report on plants
analysis
Real world
Problem
Abstract world
CHAPTER 3 ■ INITIAL REQUIREMENTS AND USE CASES
First, we have to fully understand the real problem. It is not enough to have a rough idea of what a business or club or scientist does. One of my favorite quotations comes from Peter Coad and Ed Yourdon’s book Object Oriented Analysis,1in which they have this to say about analyzing an air traffic control system:
The analyst needs to immerse himself in the problem domain so deeply that he begins to discover
nuances that even those who live with air traffic control every day have not fully considered.
While the people involved are the experts in their particular real-world problem, they seldom need to think in an abstract way about the details. Exceptions and irregularities can just be “dealt with” as they arise. In a manual system, someone can scribble a note, post an additional invoice, or adjust some totals. However, an automated system cannot be so forgiving, and possible irregularities need to be considered right from the start.
People will not usually volunteer information about the little oddities of their problem, and even when questioned will often not recognize that they might be important. Answers such as “No, not really,” or “Hardly ever,” or “Umm, no, I don’t think so, umm, well maybe,” are a sign that a complication exists that needs to be understood before any design of a database should proceed further.
As you have seen in the previous chapters, databases are often set up to solve one immediate problem with little regard for what may come next or how sometimes the situation may vary from the norm. In Example 1-4, “Academic Results,” tables were set up to record students’ marks without considering the (sadly not altogether uncommon) case of a student having to repeat a subject.
In this chapter, we look at ways to get an initial, accurate overview of the problem and express this with use cases. Then, having understood all the definitions, details, exceptions, irregularities, reasonable extensions, and uses of the system (gasp), we have to ensure that our abstract model captures the most important features accurately. It is, after all, the abstract model that will eventually be implemented.
You may be designing your own database, or perhaps you are designing one for someone else. In either case, there are two views of the problem. One is the concrete, real-world view from the person who will be the eventual user (I will call this person the client), and the other view is the more abstract model from the person who is designing and possibly developing the system (I’ll call this person the analyst). If you are designing your own database, then wear two hats and swap them as necessary.
As a good understanding of a real–world problem depends so critically on the client and analyst being able to understand each other, we will take a moment to look at the two different views of a problem.
Real and Abstract Views of a Problem
The analyst sees the problem in a mostly abstract way. For the type of database problems we are considering, the processing can mostly be separated into:
Entering, editing, or otherwise maintaining data.
•
Extracting information from the database based on some criteria. This view of the
•
problem is shown in Figure 3-2.
CHAPTER 3 ■ INITIAL REQUIREMENTS AND USE CASES
The first thing an analyst must do is understand the client’s problem in sufficient detail to help determine the input and output requirements (both immediate and potential). These can be expressed in use cases. The analyst then needs to develop a data model that will support those requirements. As you shall see in later chapters, the data model provides considerable insight into the details of a system, so the use cases and data model are often developed in tandem.
Establishing the use cases is not a simple problem. Users or clients seldom have a clear idea of the whole process. Many database projects fall into one of the two categories described in the next sections, and it is useful to look at these from the client’s perspective.
Data Minding
A data–minding project involves a client who has data that needs to be looked after. This is often the case for research results. A scientist may devise an experiment to collect data that will allow a specialist statistical analysis to be undertaken. The analyst’s responsibility here is to think ahead and ask questions about how else the data might be used, and store it in such a way as to allow for the immediate and possible future requirements. This process is depicted in Figure 3-3.
Figure 3-2. An analyst’s view of a typical database system
Use cases for data entry
INPUT
OUTPUT
MODEL
Data model
CHAPTER 3 ■ INITIAL REQUIREMENTS AND USE CASES
Figure 3-3. The analysis of a data-minding problem
?
INPUT
MODEL Analysis
Eventual model Client’s view
A careful analysis at this stage helps prevent the very common and infuriating situation of knowing the data is “in there” but not being able to “get it out” conveniently. Predicting the potential output requirements, given the type of data that is being collected, is one of the most difficult aspects of storing data.
Task Automation
CHAPTER 3 ■ INITIAL REQUIREMENTS AND USE CASES
A typical description for a task automation problem at a local school might go like this:
When parents call up to say that children are sick, we have to let their classroom teachers know,
and if it’s sports day and the child is on a school team, the sports teacher might have to sort
out substitutes.
Then we need to count up all the days missed to put on the child’s report. The
Department of Education needs the totals each term, too.
Recording the absence and being able to report it in several ways are clearly prime requirements. However, what about the sports teams? Does the system need to differentiate those children on teams (and if so does it need to know which teams)? Does the system need to know on which dates there are interschool matches? Probably not. Differentiating what the client does (if it’s sports day, tell the sports teacher) from what needs to be recorded is part of the scoping process. The eventual solution for the sports part of the problem may be as complicated as recording all the details about teams, substitutes, and match dates, or may be as simple as handing the sports teacher a list of everyone who is absent each day and letting her sort it out.
Every problem is different, so we need a general framework for discovering and representing the intricacies of a database problem. A good start is to determine answers to the following questions:
What does the user do?
•
What data are involved?
•
What is the main objective of the system?
•
What data are needed to satisfy this objective?
•
Figure 3-4. The analysis of a task automation problem
MODEL
Analysis
Eventual model Client’s view
Job
Job Job
Job
CHAPTER 3 ■ INITIAL REQUIREMENTS AND USE CASES
The preceding steps are iterative. As we learn more about the problem, we will probably have to return to the early steps and adjust them. We will work through these steps in the context of Example 3-1.
example 3-1. meal DelIverIes
Visitors to the city staying in local motel or hotel rooms are offered a service that will deliver to them a
variety of fast food or takeaway meals (pizzas, burgers, Indian takeout, and so on). A visitor phones the
company and places an order for some meals. A driver is selected and dispatched to pick up the meals from
the appropriate fast-food outlets. The driver delivers the meals to the customer, receives the payment, and
informs the depot. He also fills in a time sheet, which he returns to the depot later.
One of the reasons given for wanting to automate this currently manual process is to be able to produce
statistics about the numbers of orders taken and about the time taken to complete orders.
What Does the User Do?
“What does the user do?” is a question particularly relevant to task automation problems. As a start, it is useful to list the jobs that the user regularly undertakes. Here is a starting list of tasks undertaken in the current manual meal deliveries example:
Receptionist records details of order (address, phone number, meals, total price).
•
Receptionist selects a driver and gives him the information about the order.
•
Driver picks up meal(s) from fast food outlet(s).
•
Driver delivers meal(s) and informs the depot.
•
Driver hands in time sheet at the end of his shift.
•
Receptionist or manager produces weekly and monthly statistics.
•
The first five of the preceding tasks may involve entering data into the system, while the last task involves reporting on information already in the system.
What Data Are Involved?
The tasks described in the previous section are very much stated from the users’ point of view and are what physically take place. We need to step back a bit, put on our analysts’ hats, and think about what data, if any, need to be recorded or retrieved at each step.
CHAPTER 3 ■ INITIAL REQUIREMENTS AND USE CASES
Let’s look at some of the questions each of these jobs might raise:
Take order: Recording the information about an order seems fairly straightforward. We need to be able to identify an order easily. We could refer to the customer and the time of placing the order, but generally assigning an order number will make it easier to track the order through its various stages. The information about the customer is fairly obvious. We need to at least record where the meals are to be delivered and how to get in touch with the customer. What about the meals that have been requested? How do we record this information? Presumably the customer is choosing from some list of available meals. Should the system be able to somehow provide that list of meals to the receptionist so that a selection can be made? What about price? If we have data about the meals, we will know the price. Is there some other cost that needs to be entered? Is there a mileage charge perhaps?
Dispatch driver: First up, we need to think about how we know which driver is going to deliver the order. Does the system need to keep track of the whereabouts of drivers and determine which driver is the most appropriate? Does the receptionist choose from a list of drivers on duty? Does the system need to keep track of which drivers are available or which are currently on a delivery? If all the drivers are busy, what happens?
Having decided on a driver, we then need to tell him about the order (two curries, two pizzas). Do we also tell him where to go to get them (e.g., are there several pizza outlets from which to choose)? Does the system need to record which outlets provided the meal for this order? If the outlets for pizzas and curries are far apart, might two drivers be involved?
Pick up meals: What do we want to record about a driver picking up a meal? Do we want the system to be able to tell us the current stage of an order (e.g., “Curries were picked up at 8:40, pizzas have not been collected yet”)? Do the eventual statistics need to be separated into times that meals were picked up and times that meals were delivered, or will overall times do?
Deliver meals: If statistics on time are important, recording the time the meals were delivered will be essential.
Enter time sheets: Assuming that time sheets are currently managed manually, looking at an existing time sheet will be very helpful. It is possible that the manual time sheet will contain some of the information we have already discussed. Is there any data that we have not recorded yet? Does the system need to record information about pay rates and payments made to the drivers? We discuss looking at existing manual forms again in the section “Finding Out More About the Problem.”
Table 3-1. Physical User Tasks and Related Data
Task
Physical Jobs
Data That Could Be Recorded
1 Take order. Order number, address, phone, name, meals, price, time. 2 Dispatch driver. Driver’s name (or ID?), order number, time, outlets to visit. 3 Pick up meals. Order number, time of picking up each meal.
4 Deliver meals. Order number, time of delivery.