Parallel Genome-Wide Analysis With Central And Graphic Processing Units
Muhamad Fitra Kacamarga
Bioinformatics & Data ScienceResearch Center Bina Nusantara University
Jakarta, Indonesia [email protected]
James W. Baurley
Bioinformatics & Data ScienceResearch Center Bina Nusantara University
Jakarta, Indonesia [email protected]
Bens Pardamean
Bioinformatics & Data ScienceResearch Center Bina Nusantara University
Jakarta, Indonesia [email protected]
Abstract— The Indonesia Colorectal Cancer Consortium (IC3),
the first cancer biobank repository in Indonesia, is faced with computational challenges in analyzing large quantities of genetic and phenotypic data. To overcome this challenge, we explore and compare performance of two parallel computing platforms that use central and graphic processing units. We present the design and implementation of a genome-wide association analysis using the MapReduce and Compute Unified Device Architecture (CUDA) frameworks and evaluate performance (speedup) using simulated case/control status on 1000 Genomes, Phase 3, chromosome 22 data (1,103,547 Single Nucleotide Polymorphisms). We demonstrated speedup on a server with Intel Xeon E5-2620 (6 cores) and NVIDIA Tesla K20 over sequential processing.
Keywords-Genome-wide Analysis, Parallel Programming, MapReduce, CUDA
I. INTRODUCTION
The Indonesia Colorectal Cancer Consortium (IC3) is the first cancer biobank repository in Indonesia. The project aims to identify the genetic and environmental risk factors for colorectal cancer (CRC) in an Indonesia population. The project involves data on 79 million genetic variants. The pilot hospital-based case-control study contains data from 192 individuals. These data will undergo genome-wide analyses including the assessment of outcomes by cancer typing, survival rates, comorbidities, and smoking status. Data processing and analyses of these data is a significant challenge to researchers [1], particularly when processing the entire genome, which requires an unacceptable amount of time if performed sequentially.
Parallel computing uses multiple processing elements to simultaneously solve problems and improve the execution time of a computer program [2]. Parallel programming was once difficult and required specific programming skills, but now popular frameworks make implementation much easier, such as MapReduce and Compute Unified Device Architecture (CUDA) [3]. Motivated by the IC3 study, we explore the use of MapReduce and CUDA for genome analysis studies. As a proof a concept, we implement the simple Cochran-Armitage trend test in these frameworks and evaluate performance (speedup) using simulated case/control status on 1000 Genomes, Phase 3, chromosome 22
genotypes. We hypothesize that Graphic Processing Units using Compute Unified Device Architecture can greatly improve processing time over sequential and Central Processing Units employing MapReduce.
A. MapReduce and Hadoop
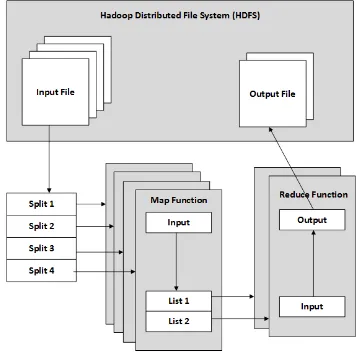
The MapReduce method parallelizes two basic operations on large datasets using Map and Reduce steps [4]. The framework simplifies the difficulty of parallel programming. MapReduce works by splitting a large data set into independent and manageable chunks of data, and processing the chunks in parallel. The method uses two functions to do this: the Map function and the Reduce function. The input data is split and the Map function is applied to each chunk. In the Reduce function, all the outputs from the maps are aggregated to produce the final result. Figure 1 shows the MapReduce architecture model.
Figure 1. MapReduce Architecture Model based on Hadoop. The input data split into smaller pieces by Hadoop Distribution File System and feed
into Map function and then Reduce function.
Hadoop is an open source parallel computing platform using multiple computers and their central processing units (CPUs). Hadoop provides tools for processing large amount of data using the MapReduce framework and a file system
____________________________________
978-1-4673-8126-0 /15/$31.00 ©2015 IEEE
called Hadoop Distribution file System (HDFS). HDFS is designed to run on clusters of commodity hardware and is capable of handling large files. A file stored in HDFS is split into smaller pieces, usually 64 MB, called blocks. These blocks are stored in one or more computers called datanodes. The master server called namenode maintains the data-nodes, the file system tree, and metadata for all the files stored in the datanodes. Hadoop provides an API that allows programmers to write custom Map and Reduce functions in many languages including Java, Python, [R], and C/C++. Hadoop uses UNIX standard streams as the interface between Hadoop and the program, so any programming languages that can read standard input (stdin) and write to standard output (stdout) can be used.
B. Graphic Processing Units and Compute Unified Device Architecture
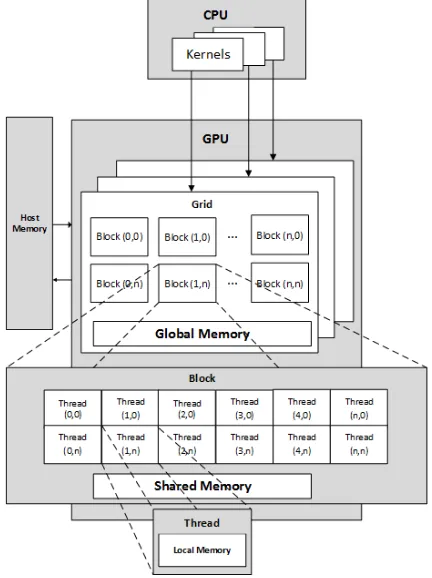
Traditionally, a Graphic Processing Unit (GPU) is a computer unit that specialized in processing and producing computer graphics. Due to the popularity of computer gaming, GPUs are common computing components and relatively inexpensive. GPUs are designed for handling many tasks simultaneously (Fig. 2). Their computing power makes them attractive for general-purpose computation, such as scientific and data analytic applications. GPU hardware consists of many streaming multiprocessors (SMs), which perform the actual computation. Each SM has many processors, and their own control units, registers, execution pipelines and caches (Fig. 2). GPU performance is dependent on finding degrees of parallelism. Therefore, an application running on a GPU must be designed for thousands of threads to fully use the hardware capabilities. A GPU enabled program contains kernel code and host code. The kernel code is executed in many threads in parallel on the GPU, while the host code controls the GPU to start the kernel code.
NVIDIA offers a programming model for NVIDIA GPUs called Compute Unified Device Architecture (CUDA). CUDA provides an Application Program Interface (API) in the C programming language. Using CUDA, a programmer can write kernel code focused on the data analysis, rather than the implementation details. CUDA organizes the computation into many blocks, each consisting of many threads. Blocks are grouped into a grid and a kernel is executed as a grid of blocks. The programmer specifies the number of blocks and the number of threads within a block. CUDA supports one- two- and three- dimensional layouts of block and threads, depending on the application. When a kernel is launched, the GPU is responsible for allocating the block to the SMs (Fig. 2). Each thread that launches is aware of its index within a block and its block index.
Memory in a GPU is categorized into three types: local memory, shared memory and global memory. Each thread has access to local memory. Shared memory is available to all threads in that block. Global memory is available to all
threads in the entire system. The system CPU has access to its own memory, which is referred to as host memory. Usually input and output data is copied to and from host memory into global memory.
Although CUDA is written in the C programming language, many developers create CUDA libraries for different programming languages. Using these libraries allow programmers to create GPU application with different programming languages beside C programming language. For example: a CUDA libraries called PyCuda [5] allows programmers to call the CUDA runtime API or kernels written in CUDA C from python and execute them on a GPU.
Figure 2. CUDA Architecture Model. CUDA organizes the GPU into many grids, each consisting of many blocks. Programmer writes kernel
code and executed as a grid of blocks.
II. METHODS
Each SNP may take three possible values: 0 for no copies of the minor allele (the less common allele in a population for the SNP), 1 copy of the minor allele, and 2 copies of the minor allele. This data extends lengthwise to the number of SNPs genotyped (79 million in IC3). The genotypes data format is shown in Figure 3. The outcome describes if an individual is a colorectal cancer case (value=1) or control (value=0). The genotypes and outcome data are text file format.
Figure 3. Genotypes data format. The data include J SNP markers (rows) for N individuals (columns). Each SNP may take three possible copies of
minor alleles.
We use the Cochran-Armitage trend test, a simple association test based on comparing allele frequencies between cases and controls. This test creates a 2 x 3 contingency table incorporating the three possible alleles (Fig. 4). The resulting chi-square statistic with 1 degree of freedom is used to produce a p-value.
Figure 4. Cochran-Armitage’s Trend Test. This test creates a 2x3 contingency table incorporating the three possible number of copies minor
alleles. The resulting chi-square statistic with 1 degree of freedom is used to produce a p-value.
A. Genome Analysis using MapReduce
We use Python to create a parallel genome analysis application using MapReduce. We followed the methods outlined in Baurley, et al. [6] for the design the MapReduce application. Each SNP is tested independently for association. Genotypes are split into independent sets, where each split of data is handled by the Map function. This function reads each row, perform the Cochran-Armitage trend test and return the p-value. The results from all the Map function are aggregated into a single result by the Reduce function. This approach is diagrammed in Figure 5.
B. Genome Analysis using PyCUDA
We created a parallel genome analysis application for GPUs using Python and PyCuda. We choose Python for its numerous statistical libraries. To fully utilize the computational power of a GPU, each thread handled one SNP (row). Since GPU hardware is set up for 1024 threads
per block [7], we add more blocks if the number of SNPs is greater than 1000 i.e., 2 blocks for 2000 SNPs and so on. The application follow the steps describe in Table 1.
GPU have a hardware constraint on the number of threads per block, based on its compute capability version [8]. To avoid related problems with the kernel, we limit the maximum number of SNPs per input file to 500,000.
Figure 5. Genome Analysis using MapReduce. Genotype data is split into smaller sets of SNPs, and being processed by the Map function to calculate
Cochran-armitage trend test.
TABLE I. GENOME ANALYSIS USING GPU
CPU 1. Load input data into host memory
2. Launch kernel, with configuration number of threads = 1000 and number of blocks = Total # SNPs/1000
GPU
3. Copy input data from host memory to global memory 4. Identify its thread index number and its block index
number
5. Copy specific row based on its thread index and its block index to its local memory
6. Perform Cochran-Armitage trend test
7. Copy result from its local memory to global memory 8. Copy result from global memory to host memory
CPU 9. Copy result into single file
III. RESULTS
For benchmarking, we used 1000 Genomes, Phase 3, chromosome 22 genotype data [9]. This data contains 1,103,547 SNPs from 2504 individuals and is representative of the SNP data obtained from IC3. We simulated case/control status using a [R] program: 1,270 colorectal cancer cases and 1,234 controls. The description of the data is shown in Table 2.
TABLE II. GENOTYPES AND OUTCOME DATA
Filesize (KB) 5,038,287 Colorectal cancer case
1,270
Control 1,234
TABLE III. SERVER SPECIFICATION
Processor : Intel® Xeon® E5-2620 (6 core, 2.00 GHz, 15 Hadoop automatically split the genotypes data into 42 splits and applied the Map function to each. We then launched the analysis using the GPU. Since the genotypes data was in excess of 500,000 SNPs, the data was split into three files. The elapse times for genome analyses are shown in Table 4.
TABLE IV. PERFORMANCE OF CENTRAL AND GRAPHIC PROCESSING minutes and achieve speedup of 7.13 over the CPU version. Surprisingly, MapReduce took longer than the sequential run, finishing 1 hour 31 minutes 25 seconds. We found the GPU version had a 8.03 speedup over MapReduce (Table 5). We tried to configure different number of map functions but did not find any impact on elapsed time under those reduce the computation time of genome-wide analysis applications. The improvement in performance depends on finding maximum degrees of parallelism. The CUDA API is now accessible using many programming languages well suited for statistical computing, such as PyCuda. There are many tasks in genome analysis that may take advantage of
GPU’s, including quality control, imputation, and multivariate analysis.
Both GPU and MapReduce need large datasets to be broken down into small chunks. The programmer needs to be aware of GPU hardware constraints and incorporate this information into the specifications for the input files, finding an optimum number of records per input file. In contrast, MapReduce automatically splits the data into smaller chunks, but the number of instances may still influence its performance. GPUs limit the number of threads that can be used to process the data. This limitation make GPU not as easily to scale as MapReduce. However, there is more overhead in using MapReduce. There were seven steps to performing a MapReduce job [10]. In our application and computing configuration, this overhead was unacceptable, making MapReduce perform slower than a sequential CPU version. We expect that with more instances, MapReduce would outperform sequential analysis. This highlights the importance of benchmarking when applying parallel computing frameworks, such as MapReduce or CUDA, to genome-wide analyses.
V. CONCLUSION
In this paper, we presented and evaluated parallel genome analysis using central and graphic processing units. We implemented the analysis using Hadoop’s MapReduce and CUDA, and applied them to real datasets from the 1000 Genome Project, phase 3, chromosome 22. Results show that the GPU-based analysis program running on NVIDIA Tesla K20 was 8.03 faster than a single instance Hadoop’s MapReduce on an Intel Xeon E5260. Genome analysis using GPUs is useful to solve many of the computational challenges found in IC3 and similar genomic studies.
ACKNOWLEDGMENT
This research is funded by NVIDIA Education Grant award.
REFERENCES
[1] N. R. Anderson, E. S. Lee, J. S. Brockenbrough, M. E. Minie, S. Fuller, J. Brinkley, and P. Tarczy-Hornoch, “Issues in biomedical research data management and analysis: Needs and barriers,” J. Am. Med. Inform. Assoc., vol. 14, no. 4, pp. 478–488, Mar. 2007. [2] B. Barney, “Introduction to parallel computing,” Lawrence Livermore
Natl. Lab., vol. 6, no. 13, pp. 10, 2010.
[3] T. Rauber and G. Rünger, Parallel programming: For multicore and cluster systems. Springer Science & Business Media, 2013.
[4] J. Dean and S. Ghemawat, “MapReduce: simplified data processing
on large clusters,” Commun. ACM, vol. 51, no. 1, pp. 107–113, 2008. [5] A. Klöckner, N. Pinto, Y. Lee, B. Catanzaro, P. Ivanov, and A. Fasih,
[8] NVIDIA, “Compute Capabilities,” 2015. [Online]. Available: http://docs.nvidia.com/cuda/cuda-c-programming-guide/#compute-capabilities. [Accessed: 20-Apr-2015].
[9] 1000Genomes, “The Phase 3 Variant set with additional allele
frequencies, functional annotation and other datasets,” 2014. [Online]. Available: http://www.1000genomes.org/announcements/phase-3- variant-set-additional-allele-frequencies-functional-annotation-and-other-data. [Accessed: 04-May-2015].