Journal of Physics: Conference Series
PAPER • OPEN ACCESS
Leaching kinetic of Nd. Y, Pr and Sm in rare earth hydroxide (REOH)
use nitric acid
To cite this article: MV Purwani and Suyanti 2018 J. Phys.: Conf. Ser.962 012061
1234567890 ‘’“”
International Conference on Nuclear Technologies and Sciences (ICoNETS 2017) IOP Publishing IOP Conf. Series: Journal of Physics: Conf. Series 962 (2018) 012061 doi :10.1088/1742-6596/962/1/012061
Leaching
kinetic of Nd. Y, Pr and Sm in rare earth hydroxide
(REOH) use nitric acid
MV Purwani and Suyanti
Center for Accelerator Science and Technology
National Nuclear Energy Agency of Indonesia (BATAN)
Email : [email protected]
Abstract. The purpose of this study were to determine the order of reaction, rate reaction constant and activation energy of reaction Y(OH)3, Nd(OH)3, Pr(OH)3 and Sm(OH)3 with
HNO3. The rate reaction constant is necessary to determine the residence time in the design of continuously stirred tank reactor (CSTR). The studied parameters were leaching temperature (60 – 90 oC) and leaching time (0-15 minutes). From the resulting data can be concluded that the leaching process were strongly influenced by the time and temperature process. Leaching rare earth hydroxide (REOH) using nitric acid follows second order. At leaching 10 grams of REOH using 40 ml HNO3 0.0576 mol were obtained maximum conversion at 90 oC and
leaching time 15 minutes for Y was 0.95 (leaching efficiency was 95%), for Nd was 0.97 ( leaching efficiency was 97%), for Pr was 0.94 (leaching efficiency was 94%) and for Sm was 0.94 (leaching efficiency was 94%). The largest activation energy was Y of 23.34 kJ /mol followed by Pr of 20.00 kJ /mol, Sm of 17.94 kJ /mol and the smallest was Nd of 16.39 kJ /mol. The relationship between the rate constant of the reaction with T for Y was kY = 338.26
e -23,34 / RT, for Nd was kNd = 33.69 e -16,39 / RT, for Pr was kPr = 102.04 e -20 / RTandfor Sm adalah
waskSm = 50.16 e –17,94/ RT
Keywords: REOH, HNO3, leaching
1. Introduction
1234567890 ‘’“”
International Conference on Nuclear Technologies and Sciences (ICoNETS 2017) IOP Publishing IOP Conf. Series: Journal of Physics: Conf. Series 962 (2018) 012061 doi :10.1088/1742-6596/962/1/012061
Rare earths hydroxide (REOH) was a monazite process products containing REE elements namely Ce, La, Nd, Pr, Y, Sm and Gd[9]. For the separation of each of those elements. REOH should be leached, so that the solution was formed. The leaching reaction that occurs could be between the base with an acid and a base with an acid. The base will react with the acidic solution to form salt and water[10]. K. Stonea et al., who studied comparison of H3PO4,
HCl, HClO4 and HNO3 usage leading to the leaching[11]. Leaching with HNO3 also for laterite
leaching[12]. Use of HNO3, resulting in the greatest leaching efficiency. In general, leaching of
REOH using HNO3, because in addition of HNO3 to easy and strong in leaching, it was also an
oxidizer that will form Ce of III valence to Ce of IV valence[13]. Thus Ce will have different properties from other REE elements that have double valences of II and III, so Ce could be separated from other REE elements. Rare earth elements that are easily soluble or are leached are Y, Nd, Pr and Sm while Ce will dissolve later.
In this work, REOH was prepared from monazite sand. The leaching of REOH using HNO3
0.0576 moles, the parameters were leaching temperature (60 – 90
o
C) and leaching time (0-15 minutes). The solution product of leaching are analyzed by XRF.
The purpose of this study were to determine the order of reaction, rate reaction constant and activation energy of reaction Y(OH)3, Nd(OH)3, Pr(OH)3 and Sm(OH)3 with HNO3. The rate
The factors affecting the rate of reaction: temperature, catalyst, molarity and reactant concentration and factors affecting the constant or constant rate of reaction was temperature[15,16,17]. Determination of the constant and leaching reaction rate at the optimum condition of the use of the reactant ratio of REOH with HNO3. The parameters studied were the variation of leaching time and
temperature. The reactions that occurred between REOH and HNO3 were as follows
RE(OH)3(s) + 3HNO3(a)→ RE(NO3)3(a) + 3H2O(a)[18] (2)
s : solid, a : solution RE : Y, Pr, Nd, Sm
-rA = k1.CAn.CB=(k1 CB) CAn= k CAn[19] (3)
n = reaction order
1234567890 ‘’“”
International Conference on Nuclear Technologies and Sciences (ICoNETS 2017) IOP Publishing IOP Conf. Series: Journal of Physics: Conf. Series 962 (2018) 012061 doi :10.1088/1742-6596/962/1/012061
dXA = experiment. If they do not match, other estimates are then tested.
First Order Reaction
In general, the first order reaction can be represented by the following reaction equation:
A product
If the first order reaction, then the equation of reaction rate was[20]:
A
The integration of equation (7) becomes:
CA = RE concentration after reaction
If expressed in terms of conversion, the equation of rate reaction becomes (9):
)
which we observe was correct, following the first order reaction[23].
Second Order Reaction
For the second order reaction with the constant rate of reaction referring to the overall reaction rate constant, could use the following equation::
A + 3B → C+3D
If it was integrated into [24,26,27]
kt CA0 slope (M-2) k. The value of the reaction rate constant was the slope of the linear line divided by
CA0 (M-2).
1234567890 ‘’“”
International Conference on Nuclear Technologies and Sciences (ICoNETS 2017) IOP Publishing IOP Conf. Series: Journal of Physics: Conf. Series 962 (2018) 012061 doi :10.1088/1742-6596/962/1/012061
k = eEa / R.T[28]
(14) Han Wang[29], states the relationship between k and T was formulated in the equation
(15) A was the frequency factor or pre - exponential factor, R was the universal gas constant = 8.314J / gmol 0K and T was the absolute temperature, 0K, Ea = activation energy, J / gmole.
The equations for the determination of the reaction order may be used for the reaction of aqueous solids such as Na Thiosulfate with methyl iodide [14] so these equations may be used in the
determination of REOH reaction with HNO3.
3. Methodology
Materials
The materials used were REOH of the processed monazite sand which Ce and La was taken partly (2 times fractionation), technical HNO3, water, filter paper, Nd2O3, Sm2O3, Pr5O11, Y2O3 Merck
as analyswas standard materials.
Equipments
Glass equipments, analytic scales, Ikamag heater stirrers, thermometers, ovens, x-ray spectrometers (XRF)
Methods
Nitric acid (HNO3) with the molarity of 14.4 M as much as 4 ml was put in the glass beaker
added water up to 10 ml plus REOH of 10 grams, heated to a certain temperature of 60 oC while stirring. The heating time varied 3, 6, 9, 12 and 15 minutes. After each process, the residue was filtered. The leaching solution was taken as 1 ml diluted with water to 5 ml analyzed using XRF. The remaining solids or residues, dried and weighed. The work was repeated for temperatures of 70, 80 and 90 oC.
Measurable quantities
The element content (%) in the REOH feed used XRF
Concentrations of Y, Pr, Nd and Sm (ppm) elements in the leached solution
4. Results and discussion
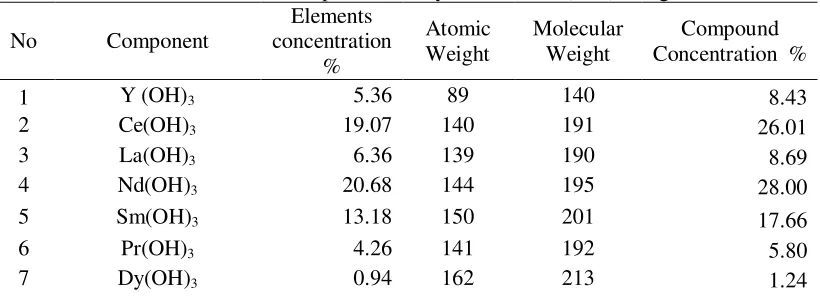
The results of the composition analysis of REOH (Feed) using XRF were presented in Table 1. In general the largest element content in REOH was Nd, followed by Nd and La. In this research REOH used as the feed was REOH which was partly taken its Ce and La ( fractination 2 times), so that the Nd
content increases, La and Ce content decreases.
Table 1. The composition analysis of REOH (feed) using XRF
No Component
Elements concentration
%
Atomic Weight
Molecular Weight
Compound Concentration %
1 Y (OH)3 5.36 89 140 8.43
2 Ce(OH)3 19.07 140 191 26.01
3 La(OH)3 6.36 139 190 8.69
4 Nd(OH)3 20.68 144 195 28.00
5 Sm(OH)3 13.18 150 201 17.66
6 Pr(OH)3 4.26 141 192 5.80
1234567890 ‘’“”
International Conference on Nuclear Technologies and Sciences (ICoNETS 2017) IOP Publishing IOP Conf. Series: Journal of Physics: Conf. Series 962 (2018) 012061 doi :10.1088/1742-6596/962/1/012061
8 Gd(OH)3 3.14 157 208 4.16
Total 100.00
Effects Temperature and Leaching Time on The Leaching Conversion
From the analysis result of REOH and leaching product solution could be determined or the leaching conversion (X) could be calculated at various time and temperature.
Element conversion (X) = – (16)
Weight of element in the feed = concentration of element x weight of REOH Weight of element in the solution= concentration of element x volume of solution
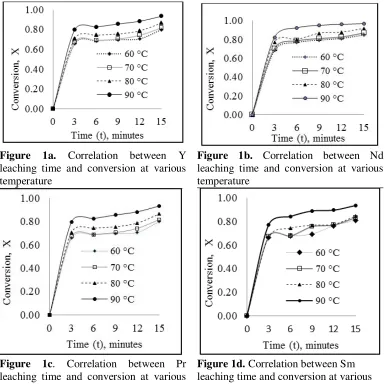
The effect of time and leaching temperature on the conversion was shown in Figure 1a to Figure 1d. The longer time and the higher leaching temperature, the leaching conversion would be greater. In general reaction, reaction rate one of which was very influenced by temperature and the completely reaction was influenced by reaction time duration
Figure 1a. Correlation between Y leaching time and conversion at various temperature
Figure 1b. Correlation between Nd leaching time and conversion at various temperature
Figure 1c. Correlation between Pr leaching time and conversion at various temperature
1234567890 ‘’“”
International Conference on Nuclear Technologies and Sciences (ICoNETS 2017) IOP Publishing IOP Conf. Series: Journal of Physics: Conf. Series 962 (2018) 012061 doi :10.1088/1742-6596/962/1/012061
The conversion value of Y was in the range of 0.00 - 0.95, the Nd conversion values were in the range of 0.00 - 0.97, Pr conversion value were in the range of 0.00 - 0.94 and Sm conversion value were in the range of 0.00 - 0.94.
Reaction order and rate reaction constant determination
First Order Reaction
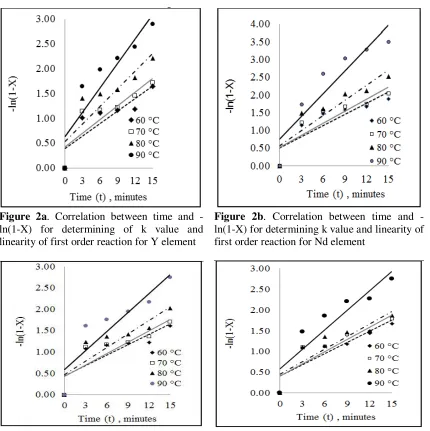
In the calculation of reaction rate constant with first order reaction , it was needed the graph of time correlation with –ln (1-X) where X was conversion (mole). Based on the equation (13), first order reaction was experimented for finding the reaction constants. The reaction rate was the overall reaction rate constant with the assumption that the concentration of HNO3 was constant because its
amount tends to approach 1, therefore it could be mentioned that the occuring reaction was first order. The calculation results could be seen in Figure 2a to 2d and Table 2
Figure 2a. Correlation between time and - ln(1-X) for determining of k value and linearity of first order reaction for Y element
Figure 2b. Correlation between time and - ln(1-X) for determining k value and linearity of first order reaction for Nd element
Figure 2c. Correlation between time and - ln(1-X) for determining k value and linearity of first order reaction for for Pr element
1234567890 ‘’“”
International Conference on Nuclear Technologies and Sciences (ICoNETS 2017) IOP Publishing IOP Conf. Series: Journal of Physics: Conf. Series 962 (2018) 012061 doi :10.1088/1742-6596/962/1/012061
Linear regression values were obtained from square root of R2 of Y, Nd, Pr and Sm elements at various temperature as shown in Table 2.
Table 2. The equation and the value of linearity (R2) in the first order reaction
Temperature 60 oC Temperature 70 oC Temperature 80 oC Temperature 90 oC
correlation graph. To find the value of M, the number of Y, Nd, Pr and Sm moles in
REOH and HNO3 were initially calculated.
M = mol HNO3 (CB0) / mol CA0 (Y, Nd, Pr and Sm) hydroxide
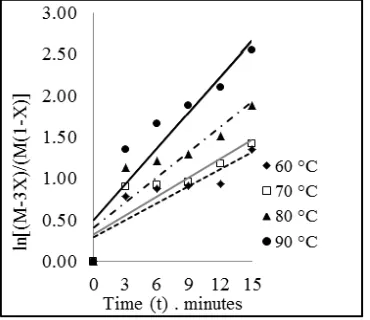
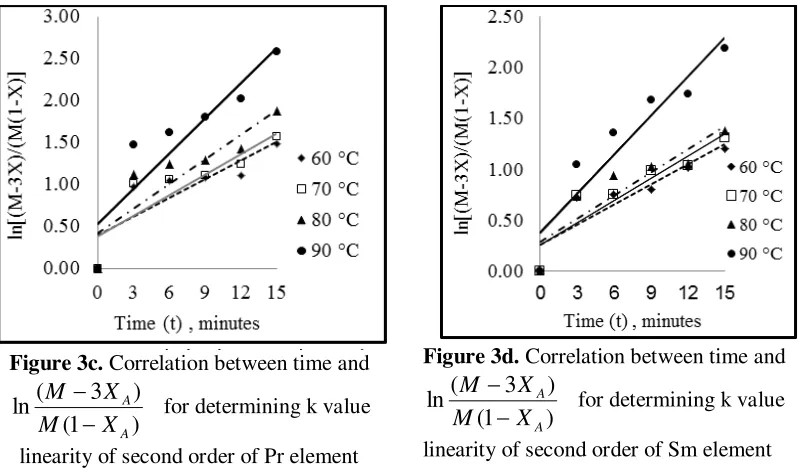
The results of second order reaction could be seen in Figures 3a– 3d and Table 4.
Figure 3a. Correlation between time and
)
linearity of second order of Y element
Figure 3b. Correlation between time and
)
1234567890 ‘’“”
International Conference on Nuclear Technologies and Sciences (ICoNETS 2017) IOP Publishing IOP Conf. Series: Journal of Physics: Conf. Series 962 (2018) 012061 doi :10.1088/1742-6596/962/1/012061
Figure 3c. Correlation between time and
)
linearity of second order of Pr element
Figure 3d. Correlation between time and
)
linearity of second order of Sm element
The linear regression value obtained from the square root of R2 in the second order reaction of elements Y, Nd, Pr and Sm at various temperatures was presented in Table 4.
Table 4. The equation and the value of linearity (R2) in the second order reaction
Temperature 60 oC Temperature 70 oC Temperature 80 oC Temperature 90 oC values(R2) second order reaction (Table 4), so it could be stated that the reaction was second order.
In general, the determinant of the reaction rate was the phase with the smallest rate, especially for the chemical reactor design [30].
The list of k values of the 2nd order reaction at various temperatures can be arranged in Table 5.
1234567890 ‘’“”
International Conference on Nuclear Technologies and Sciences (ICoNETS 2017) IOP Publishing IOP Conf. Series: Journal of Physics: Conf. Series 962 (2018) 012061 doi :10.1088/1742-6596/962/1/012061
70 343 0.0864 0.0029 -2.449 2.449
80 353 0.1033 0.0028 -2.270 2.270
90 363 0.0794 0.0028 -1.924 1.924
Nd 60 333 0.0936 0.0030 -2.369 2.369
70 343 0.1011 0.0029 -2.292 2.292
80 353 0.1289 0.0028 -2.049 2.049
90 363 0.1489 0.0028 -1.904 1.904
Sm 60 333 0.0833 0.0030 -2.485 2.485
70 343 0.0889 0.0029 -2.420 2.420
80 353 0.0949 0.0028 -2.355 2.355
90 363 0.1489 0.0028 -1.904 1.904
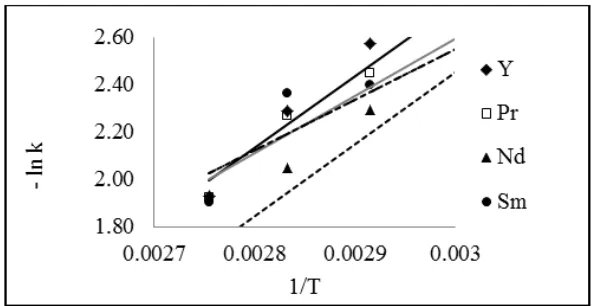
After obtaining the element’s reaction rate constants of second order reaction at each temperature, the correlation of the reaction rate constant k as a function of temperature by referring to the Arrhenius equation, ln k = ln A - Ea /RT. (equation 15).
The calculation results are expressed in the linear line graph between ln k as ordinate and 1 / T as the abscissa for Y. Nd, Pr and Sm element could be observed in Figure 4. From Figure 4, the relationship between 1 / T and ln k, line alignment was expressed by R2, the slope obtained was the activation energy and the intercept was the frequency factor.
Figure 4a. Correlation between 1/T and -ln k for Y, Pr, Nd and Sm element
1234567890 ‘’“”
International Conference on Nuclear Technologies and Sciences (ICoNETS 2017) IOP Publishing IOP Conf. Series: Journal of Physics: Conf. Series 962 (2018) 012061 doi :10.1088/1742-6596/962/1/012061
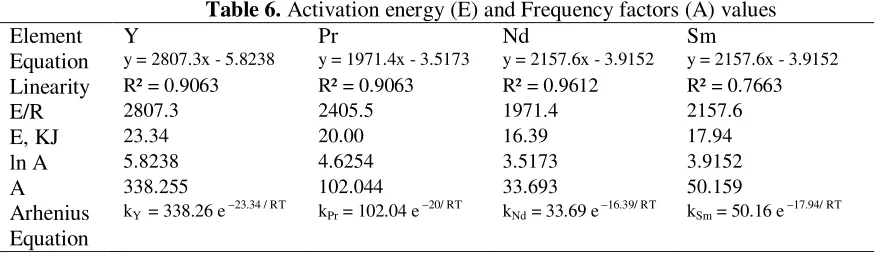
Table 6. Activation energy (E) and Frequency factors (A) values
Element Y Pr Nd Sm
Equation y = 2807.3x - 5.8238 y = 1971.4x - 3.5173 y = 2157.6x - 3.9152 y = 2157.6x - 3.9152
Linearity R² = 0.9063 R² = 0.9063 R² = 0.9612 R² = 0.7663
E/R 2807.3 2405.5 1971.4 2157.6
E, KJ 23.34 20.00 16.39 17.94
ln A 5.8238 4.6254 3.5173 3.9152
A 338.255 102.044 33.693 50.159
Arhenius Equation
kY = 338.26 e –23.34 / RT kPr = 102.04 e –20/ RT kNd = 33.69 e –16.39/ RT kSm = 50.16 e –17.94/ RT
Ferdowsi et al, did and optimizing and kinetics of leaching process of cerium, lanthanum and neodymium elements of apatite using nitric acid. The maximum leaching efficiency of which were 66.1%, 56.8% and 51.7% respectively for Ce, La and Nd, achieved under the optimum leaching conditions with nitric acid concentration of 18%, 0.06 ratio of solid to liquid and leaching time of 38 minutes, the activation energy of Ce of 6.54 kJ / mole[20]
5. Conclusion
The leaching process was strongly influenced by the temperature and time of process. Leaching of REOH using nitric acid follows second order reaction. In leaching 10 g of REOH using 40 ml of
HNO3 0.0576 moles were obtained maximum conversion at 90
0
C and leaching time of 15 minutes for Y was 0.95 (leaching efficiency of 95%). for Nd was 0.97 (leaching efficiency of 97%). for Pr was 0.94 (leaching efficiency of 94%) and for Sm was 0.94 (leaching efficiency of 94%). The largest activation energy was Y of 23.34 kJ / mole followed by Pr of 20.00 kJ/ mole, Sm of 17.94 kJ / mole and the smallest was Nd of 16.39 kJ / mole. The correlation between the reaction rate constant with T for Y was kY = 338.26 e -23.34 / RT. for Nd was kNd = 33.69 e -16.39 / RT, for Pr was kPr = 102.04 e -20 / RT and for Sm was kSm = 50.16 e-17.94 / RT
Acknowledgments
On this occasion the authors would like to thank PT TIMAH who has given REOH and this research at the cost of INSINas in year 2017. Thanks also to Mrs. Suprihati who has helped me out in this research.
References
[1]. European Union 2014 Report on Critical Raw Materials for EU,
http://ec.europa.eu/enterprise/policies/raw-materials/files/docs/crm-report-on-critical-raw-materials_en.pdf
[2]. Jorjani E, Bagherieh A, Chelgani S, 2011 Rare Earth Elements Leaching from Chadormalu Apatite Concentrate: Laboratory Studies and Regression Predictions, Korean J. Chem. Eng., 28, pp. 557–562
[3]. Tunsu C, Petranikova M, Gergoric M, Ekberg C, Retegan T 2015 Reclaiming Rare Earth Elements from End-of-life Products: A Review of The Perspectives for Urban Mining Using Hydrometallurgical Unit Operations, Hydrometallurgy, 156 , pp. 239–258
[4]. Wang L. Long Z, Huang X, Yu Y, Cui D, Zhang G 2010 Recovery of Rare Earths from
Wet-Process Phosphoric Acid, Hydrometallurgy, 101, pp. 41–47
[5]. Dippel S K 2012 Mineralogical and Geochemical Characterisation of Phosphogypsum Waste Material and Its Potential for Use as Backfill at WMC Fertilizers' Mine Site, (Phosphate Hill, N-W Queensland Thesis James Cook University, Townsville, QLD)
[6]. Amélie D, Benita P, Lukas P B, Anne S B, Torsten W V 2017 Evaluation of Potential Monazite
Reference Materials for Oxygen Wasotope Analyses by SIMS and Laser Assisted Fluorination,
1234567890 ‘’“”
International Conference on Nuclear Technologies and Sciences (ICoNETS 2017) IOP Publishing IOP Conf. Series: Journal of Physics: Conf. Series 962 (2018) 012061 doi :10.1088/1742-6596/962/1/012061
[7]. Farzaneh S, Fereshteh R, Aminib A 2017 Hydrometallurgical Digestion and Leaching of
Iranian Monazite Concentrate Containing Rare Earth Elements Th, Ce, La and Nd International
Journal of Mineral Processing Volume 159 pp 7–15
[8]. Gupta C K, Krishnamurthy N 2005 Extractive Metallurgy of Rare Earths (first ed.) (CRC Press, Boca Raton, Florida)
[9]. Agarwal V, Safarzadeh M S., 2017 Alkali Pug Bake Process for The Decomposition of
Monazite Concentrates, Minerals Engineering, Volume 109, pp 32–41, L. Berry, J. Galvin, [10]. Sasikumar C, Rao D S , Srikant S, Mukhopadhyay N K , 2007 Dissolution studies of
Mechanically Activated Manavalakurichi Ilmenite with HCl and H2SO4., (Department of
metallurgy Institute of Technology, (Banaras Hindu University, Varanasi, India )
[11]. Stonea K, Bandaraa AMLS, Senanayakea G, Jayasekeraa S 2016 Processing of Rare Earth Phosphate Concentrates: A comparative Study of Pre-leaching With Perchloric, Hydrochloric, Nitric and Phosphoric Acids and Deportment of Minor/major Elements, Hydrometallurgy, Volume 163 pp 137–147
[12]. Yonglu Z 2015 Pilot-scale Plant Study on The Innovative Nitric Acid Pressure Leaching
Technology for Laterite Ores Hydrometallurgy volume 155 pp 88–94
[13]. Renata D A, Carlos AM 2010 Purification of Rare Earth Elements from Monazite Sulphuric
Acid Leach Liquor and The Production of High-purity Ceric Oxide, Minerals Engineering vol
23 pp 538 – 540
[14]. Syukri S, 1999 Kimia Dasar 2, (ITB, Bandung)
[15]. Mugdha W, Connie K N, Gisele A, 2016 Process Investigation of The Acid Leaching of Rare
Earth Elements from Phosphogypsum Using HCl, HNO3, and H2SO4, Hydrometallurgy,
Volume 166, pp 195–204.
[16]. Wenjuan Z, Jiangtao L, Zhongwei Z 2015 Leaching Kinetics of Scheelite with Nitric Acid
and Phosphoric Acid, International Journal of Refractory Metals and Hard Materials Volume
52 pp 78–84
[17]. Krzysztof M 2013 Recovery of Vanadium, Potassium and Iron from a Spent Vanadium Catalyst
by Oxalic Acid Solution Leaching, Precipitation and Ion Exchange Pocesses Hydrometallurgy
Volumes 134–135
[18]. Kenneth S. 2017 Emeritus Professor of Biophysical Chemistry and Environmental Studies,
Chapter 15 – Reaction Rates and Mechanisms, Physical Chemistry, Concepts and Theory
(University of Missouri at Kansas City) pp 695–760
[19]. Sinclaira LK, Baekb DL, Thompsona J, Testera, JWRV. 2017 Rare Earth Elements
Extraction from Pretreated Bastnäsite in Supercritical Carbon Dioxide The Journal of Supercritical Fluids Volume 124 pp 20–29
[20]. Ferdowsi A, Yoozbashizadeh H 2017 Process Optimization and Kinetics for Leaching of Cerium, Lanthanum and Neodymium Elements from Iron Ore Waste's Apatite by Nitric acid,
Transactions of Nonferrous Metals Society of China, Volume 27 Issue 2, pp 420–428
[21]. Zárate GR, Lapidusb GT, Moralesa RD 2010 ca Depto. de Ing. Metalúrgica y Materiales, ESIQIE.IPN, Apdo. Postal 75-874, Col Lindavista, México D.F., C.P. 07-738, Mexico, Pressure Leaching of a Lead–zinc–silver Concentrate with Nitric Acid at Moderate Temperatures
Between 130 and 170 °C, Hydrometallurgy, Volume 104, issue 1, pp 8–13
[22]. Chen G, Ilya K, Jiwchar G 2016 The Combined Effect of Temperature and pH on Albite Dissolution Rate Under Far-from-equilibrium Conditions Geochimica et Cosmochimica Acta, Volume 186 pp 154–167)
[23]. Ewelina K., Piotr B, Lori N 2017 The Redox Reaction Kinetics of Sinai Ore for Chemical
Looping Combustion Applications Applied Energy Volume 190 pp 1258–1274
[24]. Levenspiel O 1972 Chemical Reaction Engineering Dept of Chem Engineering Oregon State
University (Wiley Eastern Ltd New Delhi Bangalore Bombay Calcutta)
[25]. Petrucci RH Harwood WS and Herring FG 2002 General Chemistry 8th edn, (Prentice-Hall)
1234567890 ‘’“”
International Conference on Nuclear Technologies and Sciences (ICoNETS 2017) IOP Publishing IOP Conf. Series: Journal of Physics: Conf. Series 962 (2018) 012061 doi :10.1088/1742-6596/962/1/012061
[26]. Chang R 2007 Chemwastry Ninth Edition (New York Mc Graw Hill)
[27]. Juan R., Gregorio G, Raúl C, De Jesús MA , Abel HM, Alejandro CV 2016 Kinetics and Statistical Analysis of Nickel Leaching from Spent Catalyst in Nitric Acid Solution,
International Journal of Mineral Processing Volume 148 pp 41–47
[28]. Ronghua Z, Xuetong Z, Shumin H 2015 Dissolution Kinetics of Quartz in Water at High Temperatures Across the Critical State of Water, The Journal of Supercritical Fluids, Volume 100 pp 58–69
[29]. Han W, Wewashu W, Qincheng B, Linchuan W 2015 Experimental Study of Heat Transfer and
Flow Resistance of Supercritical Pressure Water in a SCWR Sub-channel, The Journal of Supercritical Fluids Volume 100 pp 15–25