THE INFLUENCE OF STUDENT ENGAGEMENT AND TEACHERS’
PERFORMANCE TO STUDENTS’ SATISFACTION IN PUBLIC SENIOR
HIGH SCHOOLS IN BANDUNG (INDONESIA)
(Descriptive Study at Public Senior High Schools in Bandung)
A thesis presented to the School of Postgraduate Studies in Indonesia University of Educationin partial fulfillment of the requirements for a degree of Master of Educational Administration.
THESIS
By:
Mahase Heisi
NIM: 1206807
DEPARTMENT OF EDUCATIONAL ADMINISTRATION
THE SCHOOL OF POSTGRADUATE STUDIES
INDONESIA UNIVERSITY OF EDUCATION
BANDUNG
DECLARATION
I hereby declare that this thesis entitled “The influence of student
engagement and teachers’ performance to students’ satisfaction in public
senior high schools in Bandung (Indonesia)”, a descriptive study at the public senior high schools in Bandung , Indonesia, iswhollythe product of my own work in all its contents. With all responsibility, I did not do plagiarism or any academic copyright violation which is not in conformity with the ethics of educational research. Therefore, I confirm that I will be ready to respond to any risk that can be imposed on me if later there will be any violation of educational research ethics in this work.
Bandung, dated.../... 2014
Mahase Heisi
FOREWORD
This thesisentitled“the influence of student engagement and teachers’ performance to students’ satisfaction in public senior high schools in Bandung (Indonesia)”,a descriptive study at public Public Senior High Schools in Bandung, is specificallyaimedtofulfill the requirement of Master Degree ofEducationin field of EducationalAdministrationat Indonesia University of Education or Universitas Pendidikan Indonesia (UPI).
In this work, I, as a researcher have limited the scope of research study by just only conducting or focusing at public Public senior high schools in Bandung (Indonesia), and focusing on the current status of the problem with the two main
variables, namely, student engagement and teachers‟ performance, which have influence toStudent Satisfaction. However, the researcher believes that this study may have some limitations in terms of errors of language and some inconveniences that happened. Thus, the researcher would like to apologize for unintentional mistakes to all readers.
Finally, the researcher hopes thisthesiscan be a useful reading instrument for all educational administrator and teachers (Stakeholders) who work in educational field or directly involved in everyday school activities, especially, students, teachers and principals. Moreover, this thesis will also be important for the next generation researchers in the field of Educational Administration for development of our education.
Bandung, dated:.../.../2014
Mahase Heisi
ACKNOWLEDGEMENTS
This research paper was prepared for the partial fulfillment of Masters in Educational Administration program. It is a pleasure to thank all people who made this study possible. This study would not have been possible without the guidance of my advisor, supervisor (s) and also an aiding hand from my friends.At this juncture, I would like to express my heartily gratitude and appreciation to the following Lecturers for their invaluable suggestions, guidance and help throughout this study:
1. Prof.Dr. H. Djam‟an Satori, M. A, first supervisor and Dr. Aan Komariah, M.Pd, second advisor who are always helpful and supportive to me, as well as encouraging and guiding me to reach my research goals.
2. Prof.Dr. H. Udin Syaefudin Sa'ud, Ph.D. the head of the Department of Educational Administration who facilitated my two-years study.
3. I am indebted to my Parents („Makopano and Laurenti Heisi) who have brought me up with good care, moral education, encouragement and support and sent me to school to learn and develop.I also thank all my brothers and sisters who unceasingly showed their support on my studies. 4. Again, I thank all my teachers of Bahasa Indonesia who helped me to learn
this language. How can I forget my friends, both in Indonesia and Lesotho, who showed their support and motivation? I also thank my classmates who helped me to adjust and adapt to Indonesian school-life. Without their support my life would be miserable.
5. I also I owe my deepest gratitude to myProfessors/lecturers of the Department of Educational Administration who taught me. I thank all schools which gave me a chance to collect data for this research.
TABLE OF CONTENTS
DECLARATION ... Error! Bookmark not defined. FOREWORD ... Error! Bookmark not defined. ACKNOWLEDGEMENTS ... Error! Bookmark not defined. ABSTRACT ... Error! Bookmark not defined. CHAPTER IINTRODUCTION ... Error! Bookmark not defined. A. Background ... Error! Bookmark not defined. B. Problem Identification and Formulation .... Error! Bookmark not defined. 1. Problem Identification... Error! Bookmark not defined. 2. Problem Formulation ... Error! Bookmark not defined. C. Research Objectives ... Error! Bookmark not defined. D. Significance of the study ... Error! Bookmark not defined. E. Organising Research... Error! Bookmark not defined. CHAPTER IILITERATURE REVIEW, FRAMEWORK AND RESEARCH HYPOTHESIS ... Error! Bookmark not defined.
A. Literature Review ... Error! Bookmark not defined. 1. Student Satisfaction ... Error! Bookmark not defined. a. Perspectives on Students’ Satisfaction Error! Bookmark not defined. b. Academic advising and instruction ... Error! Bookmark not defined. c. Social Activities ... Error! Bookmark not defined. d. Library ... Error! Bookmark not defined. e. Adaptability ... Error! Bookmark not defined. 2. Student engagement ... Error! Bookmark not defined. a. Values and Goals (I Want to)... Error! Bookmark not defined. b. Intrinsic Interest ... Error! Bookmark not defined. c. Internalized Values ... Error! Bookmark not defined. d. Engagement and Motivation ... Error! Bookmark not defined. 3. Teachers’ Performance (Including ICT as part of teachers’ performance)
Error! Bookmark not defined.
a. Performance as a multi-dimensional concept .... Error! Bookmark not defined.
d. Performance as a dynamic concept ... Error! Bookmark not defined. e. Perspectives on performance ... Error! Bookmark not defined. B. Theoretical framework of the research ... Error! Bookmark not defined. C. Hypothesis ... Error! Bookmark not defined. CHAPTER IIIRESEARCH METHODOLOGY .. Error! Bookmark not defined. A. Population and Sampling Techniques ... Error! Bookmark not defined. 1. Population... Error! Bookmark not defined. 2. Sampling ... Error! Bookmark not defined. B. Research design ... Error! Bookmark not defined. C. Operational Definition ... Error! Bookmark not defined. 1. Student satisfaction (Y) ... Error! Bookmark not defined. 2. Student Engagement (X1) ... Error! Bookmark not defined. 3. Teachers’ Performance (X2) ... Error! Bookmark not defined. D. Research Instrument ... Error! Bookmark not defined. 1. Instrument Development Process ... Error! Bookmark not defined. 2. Test Validity of Data ... Error! Bookmark not defined. 3. Test Reliability of Data ... Error! Bookmark not defined. 4. Measures of Variability ... Error! Bookmark not defined. 5. Results of testing Instrument ... Error! Bookmark not defined. 6. Testing analysis ... Error! Bookmark not defined. a. Weighted Means Test Scored ... Error! Bookmark not defined. 7. Normality test ... Error! Bookmark not defined. E. Techniques of Data Collection ... Error! Bookmark not defined. F. Techniques of Data Analysis ... Error! Bookmark not defined. CHAPTER IVRESEARCH FINDINGS AND ANALYSIS .... Error! Bookmark not defined.
b. SMAN 24 ... Error! Bookmark not defined. c. SMAN 1 ... Error! Bookmark not defined. d. SMAN 8 ... Error! Bookmark not defined. e. SMAN 9 ... Error! Bookmark not defined. 3. Description of Student Satisfaction (Y) .. Error! Bookmark not defined. a. SMAN 5 ... Error! Bookmark not defined. b. SMAN 24 ... Error! Bookmark not defined. c. SMAN 1 ... Error! Bookmark not defined. d. SMAN 8 ... Error! Bookmark not defined. e. SMAN 9 ... Error! Bookmark not defined. 4. The Influence of Student Engagement to Student Satisfaction ... Error! Bookmark not defined.
5. The influence of Teachers’ Performance to Student Satisfaction ... Error! Bookmark not defined.
6. The Influence of Student Engagement and Teachers’ Performance to Student Satisfaction ... Error! Bookmark not defined. B. ANALYSIS ... Error! Bookmark not defined. 1. Student Engagement (X1) ... Error! Bookmark not defined. 2. Teachers’ Performance (X2) ... Error! Bookmark not defined. 3. Student Satisfaction (Y) ... Error! Bookmark not defined. 4. The Influence of Student Engagement to Student Satisfcation ... Error! Bookmark not defined.
5. The Influence of Teachers’ Performance to Student Satisfaction ... Error! Bookmark not defined.
6.The Influence of Student Engagement and Teachers’ Performance to Student Satisfaction ... Error! Bookmark not defined. CHAPTER VCONCLUSIONS AND RECOMMENDATIONS ... Error! Bookmark not defined.
LIST OF TABLES
Table 2.1Factors mentioned in the literature ... Error! Bookmark not defined. Table 2.2Indicators of Student engagement ... Error! Bookmark not defined. Table 2.3Student Engagement ... Error! Bookmark not defined. Table 2.4Four interrelated aspects of students’ engagement Error! Bookmark not
defined.
THE INFLUENCE OF STUDENT ENGAGEMENT AND TEACHERS’ PERFORMANCE TO STUDENTS’ SATISFACTION IN PUBLIC SENIOR
HIGH SCHOOLS IN BANDUNG (INDONESIA) (Descriptive Study at Public Senior High Schools
In Bandung, Indonesia) By: MahaseHeisi (12067807)
ABSTRACT
Students are direct receivers and participators for education service, and their study activities wouldinfluence their perceptions and satisfactions to the educational quality. Through studying on the influence of students’ engagement
and teachers’ performance to students’ satisfaction, in this article, the researcher aimed at studying the influence of these variables to student satisfaction in Public Senior High Schools in Bandung (SMAN).
It obvious that some students showed or reported a certain level of dissatisfaction in their learning. Therefore, it was important to explore the level of
influence of student engagement and teachers’ performance to student
satisfaction.
The general objective of this study is to explore and check the influence of student engagement and teachers’ performance to students’ satisfaction in Public Senior High Schools in the city of Bandung in Indonesia.
This research used quantitative research methodology (descriptive) which was conducted at Public senior high schools in Bandung. The population consists of twenty nine (29) schools and sampling consisted of five schools which were taken from different regions (North, South, East, West and central) of the city of Bandung. Each school was given copies of questionnaires. The measurement of
the influence of student engagement and teachers’ performance to student
satisfaction was done with Likert scale with five weighted options.
The findings showed that influence of student engagement and teachers’
performance to student satisfaction is good enough in these schools. It was found that contribution madeby thestudent engagement and teachers’performance onstudent satisfactionisstrong enough. While the remainingpartbelongs toother factorsthataffectstudent satisfaction which were not examinedby the researcher. On the same hand student engagement had good influence. Whileteachers performance tosatisfaction ofthe students had also had the same good influence.
Therefore, the influence of student engagement and teachers’ performance
to student satisfaction is found to be good enough in these schools. This is positive in the process of learning but calls for attention from all stakeholders in educational administration. There is also a room for improvement. This research recommends that the future research be focused between public and private senior high schools.
CHAPTER I
INTRODUCTION
A. Background
Satisfaction is a well researched topic in both academic and non-academic (workplace) settings. In academic settings, students’ satisfaction data helps both schools, colleges and universities make their education more responsive to the needs of a changing marketplace. Students’ satisfaction surveys are important in ascertaining whether school, colleges and universities are fulfilling their mission. Satisfaction is a relevant measure because many studies have demonstrated that other factors being equal, satisfied individuals are likely to be willing to exert more effort than unsatisfied individuals (Bryant, 2006; Özgüngör, 2010). Thus, satisfied students (with the curriculum) are likely to exert more effort in their educational studies by taking actions such as regularly attending their classes and becoming more involved in their coursework and institution. Satisfied students are more likely to be committed and continue their studies (as measured by a higher retention rate) than unsatisfied students, who are likely to be less willing to regularly attend classes, and are more likely to quit their studies.
Schools or institutions are no longer merely focused on societal values in relation to the skills andabilities of their graduates but are also seeking to assessstudents’ feelings about their educational experience.This switch of focus call for themanagement of schools or institutions to incorporate student satisfaction as an integral component of their management or administration process in addition to their traditional areas of academic standards, accreditation, teaching and research (Abdullah,2006).
student engagement, teachers’ performance and Students’ satisfaction. The more students are engaged in their school work (and the more teachers perform) the more they will be satisfied.
While student engagement has enjoyed considerable attention in the literature sincethe mid-1990s, its beginnings can substantively be seen a decade previously, seminallyin Alexander Astin’s work on student involvement (Kelly, S., & Price, H. 2014). Following on fromthe student experience and research-led teaching before it, student engagementhas become the latest focus of attention among those aiming to enhance learning andteaching in higher education, headlining meeting agendas and theming conferences incampuses around the world.
It is not difficult to understand why: a sound body of literature has establishedrobust correlations between student engagement or involvement in a subset of educationally purposiveactivities, and positive outcomes of student success and development, includingsatisfaction, persistence, academic achievement and social engagement (Pascarellaand Terenzini, 2005).
Student engagement is increasingly seen as an indicator of successful classroominstruction, and is increasingly valued as an outcome of school improvementactivities. Students are engaged when they are attracted to their work, persistin despite challenges and obstacles, and take visible delight in accomplishingtheir work. Student engagement also refers to a student’s willingness, need,desire and compulsion to participate in, and be successful in the learningprocess.
Student engagement is primarily andhistorically about increasing achievement,positive behaviors, and a sense of belonging inall students. However, student engagement is primarily focused at students in middleschool and high school, where disengagement typically becomes a concern (Willms,Friesen and Milton, 2009).
seem to be the most successful in the field of education. Education is a process which has stages like: input, process of the input, output and outcome. Educational goals change according to new social needs, and so do strategies for engaging students into teaching and learning. The world is in need of well modeled output which has the most necessary skills needed in the market. The world is in need of quality not quantity as such. We are living in the world of information and technology and we can learn from the advertisements (Recruitment) of many companies that competency in ICT (Information and Communication Technology) is now a prerequisite for almost every job. Therefore, teachers are expected to be skillful in the use of ICT in the process of learning. This is now considered as one of the aspects in teachers’ performance.
Several studies argue that the use of new technologies in education is essential for providing opportunities for students to learn to operate in an information age (era). Nowadays integrating ICT in learning is one of the indicators and part of teacher’s performance which will lead to student satisfaction. It is evident as Yelland (2007) argued that traditional educational environment do not seem to be suitable for preparing students to function or be productive in today’s society workplaces. She claims that organizations or schools that do not incorporate the use of new technologies cannot seriously claim to prepare their students for life in the twenty-first century. This argument is supported by many authors who hold that by teaching ICT skills at primary schools the pupils are prepared to face the future developments based on proper understanding.
This thesis is aimed at presenting the conceptualization and the influence of student engagement and teachers’ performance to student satisfaction. On the part of student satisfaction the conceptualization is based on the culmination of concentration, interest, collaboration and enjoyment. This will be done through investigating how Grade X students spend their time in Public senior high schools across the city of Bandung in Indonesia.
but it is also a subject in its own right as a separate discipline. The major objective is that developing skills, knowledge, and understanding in the use of ICT prepares pupils to use such technologies in their everyday lives. ICT tools enable pupils to access, share, analyze, and present information gained from a variety of sources and in many different ways. The use of ICT provides opportunities for pupils to work both collaboratively and independently. As such, the role of ICT within the learning process is not only to enhance the learning experiences of pupils but also to help them develop the skills essential to participate effectively in the world of affairs. It generates avenues for working in groups, developing team spirit, cohesion, and social values.
This is a challenge to our education system and many developed countries have managed to master integration of ICT in students’ learning to the satisfaction of students in order to be equal to the needs of the market out there. Indonesia started to have a plan of integration of ICT in education around 2001. This research paper (Thesis) intents to see relationship between student engagement and teachers’ performance for students’ satisfaction in the process of learning.
Engaging students in their own learning has challengededucators for decades.There is general agreement that engagement in learning is as important forsuccess in school as it is elusive in the vast majority oftraditional, bureaucratic school structures. As a result,researchers have studied and measured the construct ofengagement in many different ways. It is evident that student engagement and teachers’ performance have influence on student satisfaction. Without these variables students are likely to be disengaged and easily drop out of school more especially at senior high school.
documents, allows students to have wider source of informationfor their learning. Students’ hovering over books in the library has given way to reading e-textson a tablet PC or listening to them on an MP3 player(Daniels & Pethel, 2005). Teachers are nomore the only source of knowledge for students. As a result of this technological impact, the roleof teachers has become a facilitator in networked classroom. The teachers suggest and guidestudents to access relevant sources of information in their learning process.
Many Indonesian public senior high schools have installed computers, projectors and internet and sometimes some teachers do not use them in the process of learning of students for various reasons. Some public senior high schools have got proportionally enough computers for their students but the challenge is that some teachers do not integrate ICT in their classes.
Indonesia’s plans to integrate ICT in education are directed towards ingraining students with the ability to harness new technologies for accessing and disseminating information and knowledge, and to harness these as tools for decision-making. The Curriculum Centre believes that this is an important competency in the era of knowledge and information technology. (http://www.unescobkk.org/education/)
It is intended that students will learn to understand when and what kind of knowledge is needed; to find and access information from various sources; and to evaluate, use and share information with others. The Centre defined ICT in relation to students as …in ICT students learn to get information, process and use it to communicate effectively through various media.
ICT is introduced to students in primary school. However, schools introduce ICT according to student needs. A school may add a subject according to the specific needs of students. Schools are likewise encouraged to upload their ICT curriculum on the Internet. ICT is also used for school management. In the non-formal education sector, private computer courses are offered or sometimes, ICT is offered as an extra-curricular subject.
Information and Communication Technology in Society: The student understands the benefits and disadvantages, as well as the challenges in information technology;
Information and Communication: Students put their knowledge, skills and attitudes into practice relating to Information Technology in getting, processing, arranging, distributing, and keeping information.
System and Design: Students apply their knowledge, skills and attitudes in designing information technology systems, solving problems relating to ICT.
B. Problem Identificationand Formulation 1. Problem Identification
An emerging consensus exists in the school reform literatureabout what conditions contribute to student satisfaction. This among many variables includes student engagement and teachers’ performance. Satisfied students are more likely to be committed and continue their studies (as measured by a higher retention rate) than unsatisfied students, who are likely to be less willing to regularly attend classes, and are more likely to quit their studies. However, some students report that they are not satisfied at school and they do not find schooling enjoyable and interesting at senior high schools. In response to this problem I intent or propose to carry out a research to investigate on the most important independent variables namely, student engagement and teachers’ performance for students’ satisfaction. Teachers’ performance will include the use of ICT in the process of learning.
ICT which is aimed at improving the quality of education and making education to be contextual as we are now living in the world of technology. We cannot benefit anything important from this policy without the teachers’ performance (or confidence) and availability of the necessary equipment (Computer labs, computers, internet, etc.).
Here, a teacher plays a pivotal role in the process of teaching and learning. Without teachers’ competency or confidence in integrating ICT in the process of learning students cannot be satisfied. Teachers are gatekeepers of students’ satisfaction in integration of ICT in the process of learning. Hence, knowledge of ICT and skills to use ICT in teaching/learning has gained enormous importance for today’s teachers. Teachers are expected to know to successfully integrate ICT into their subject areas to make learning more meaningful. This knowledge development during pre-service training has gained much importance with the notion that exposure to ICT during this time is helpful in increasing student-teachers’ willingness to integratetechnology with classroom teaching. Teachers are expected to know how to integrate ICT in learning but there are many teachers who still have problems of integrating ICT in learning because they lack skill.Teachers’ performance on integration of ICT in the process of learning is very important. In some schools some teachers still face problems of using ITC’s equipment or tools and this affects student satisfaction as teachers play a pivotal role in students’ satisfaction.
2. Problem Formulation
According to Creswell (2012), Research questions are questions in quantitative or qualitative research that narrows the purpose statement to specific questions that researchers seek to answer. Therefore, the following are the research questions for this study:
1) How is student engagement in the city of Bandung at senior public high schools in Grade X?
3) How is Students’ satisfaction in public senior high schools in the city of Bandung in Grade X?
4) How much is the influence of student engagement in the process of learning to student satisfaction?
5) How much is the influence of teachers’ performance in the process of learning to student satisfaction?
6) How much is the influence of student engagement and teachers’ performance to student satisfaction?
C. Research Objectives
The general objective of this study is to explore and check the influence of student engagement and teachers’ performance to students’ satisfaction in Public Senior High Schools in the city of Bandung in Indonesia.
The specific objectives among others include:
1. To obtain overview of student engagement in public senior High schools in Bandung
2. To obtain overview of teachers’ performance in Public senior High schools in Bandung
3. To obtain overview of Students’ satisfaction in Public senior High schools in Bandung
4. To analyze the effects of the influence of student engagement to student satisfaction
5. To analyze the effects of the influence of teachers’ performance to student satisfaction
6. To analyze the effects of the influence of student engagement and teachers’ performance to student satisfaction
D. Significance of the study
education in Indonesia. They will also help to identify the problems that lead to dissatisfaction of students in the process of learning. Secondly, the results will help in clarifying the importance of student satisfaction, student engagement and teachers’ performance in education.
E. Organising Research
47
CHAPTER III
RESEARCH METHODOLOGY
The purpose of this study is to examine the influence of studentengagement and teachers’ performance to student satisfaction.
A. Population and Sampling Techniques 1. Population
The study will be conducted in Bandung and it will focus on public high schools. According to Gravetter and Wallnau (2007), population is a set of all theindividuals of interest in a particular study and a sample isa set of individualsselected from a population, usually intended to represent the population in a researchstudy.
No School name
Grade X Boys Girls Total 1. SMA Negeri 1 Bandung 161 199 360 2. SMA Negeri 2 Bandung 169 178 347 3. SMA Negeri 3 Bandung 132 192 324 4. SMA Negeri 4 Bandung 140 227 367 5. Sma Negeri 5 Bandung 157 184 341 6. SMA Negeri 6 Bandung 159 197 356 7. SMA Negeri 7 Bandung 126 194 320 8. SMA Negeri 8 Bandung 166 238 404
48
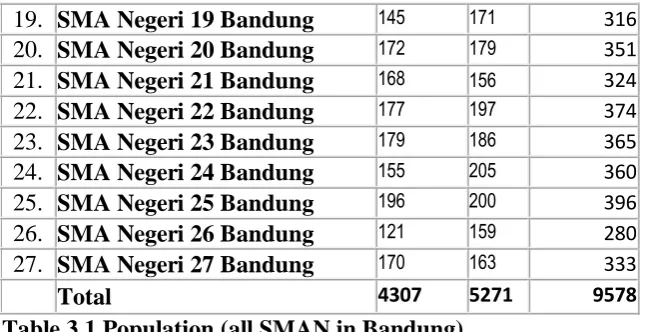
19. SMA Negeri 19 Bandung 145 171 316 20. SMA Negeri 20 Bandung 172 179 351 21. SMA Negeri 21 Bandung 168 156 324 22. SMA Negeri 22 Bandung 177 197 374 23. SMA Negeri 23 Bandung 179 186 365 24. SMA Negeri 24 Bandung 155 205 360 25. SMA Negeri 25 Bandung 196 200 396 26. SMA Negeri 26 Bandung 121 159 280 27. SMA Negeri 27 Bandung 170 163 333
Total 4307 5271 9578
Table 3.1 Population (all SMAN in Bandung)
2. Sampling
There are two categories of sampling: random sampling and non-random sampling. Random sampling is the process of selecting sample that would be representative of the population of interest (Norazman et al, 2007). In contrast, non-random sampling does not provide an equal chance for every member of the population to be selected as sample in a research. Random sampling has been selected to conduct the survey of this research because in random sampling, every member of the population has an equal probability to be chosen to participate in the research. Another reason is that the results of the research would yield a representative sample.
In addition, the formula by Sugiyono (2006) will be used to calculate the sample in the study as below:
n= N N (d2) +1
n= Total sampling N=Total Population
49
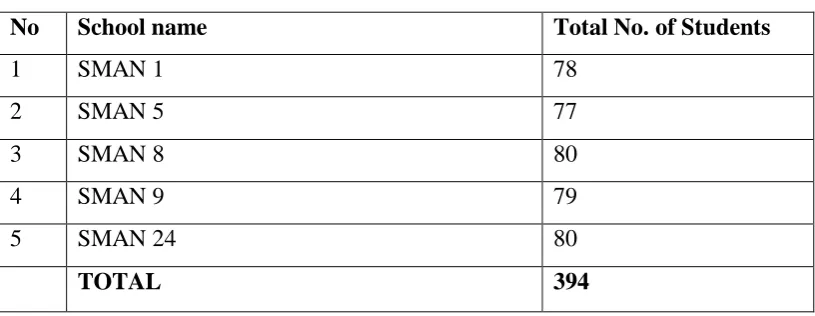
Schools for samplimg
No School name Total No. of Students
1 SMAN 1 78
2 SMAN 5 77
3 SMAN 8 80
4 SMAN 9 79
5 SMAN 24 80
TOTAL 394
Table 3.2 Sampling (5 SMAN in Bandung)
The unit of analysis in this study will include feedback from high school students.
The following methods and techniques will be applied in data collection: Questionnaires will be organized which will focus on getting the whole information about teachers competency in integrating ICTs in education at high school level in Bandung.
B. Research design
The research design is a case study to be conducted in public schools in Bandung (City). The researcher will visit public schools in this region and observe, give questionnaires and interview teachers, students and Principals about the influence of student engagement and teachers’ performance to student satisfaction in their schools. The aim is to find out whether there is an influence of student engagement and teachers’ performance to student satisfaction in their schools. The study will be conducted in a quantitative methodology which will mainly focus on interviews and questionnaires. Teachers’ performance will also include the use of ICT in the process of learning.
50
from the investigation, after analysis is made and conclusions are shared, to prove the hypotheses not false or false. With this stance, the basic procedure of a quantitative design is: making observations about something that is unknown, unexplained, or new by investigating the current theory surrounding the research problem or issue; hypothesizing an explanation for those observations; making a prediction of outcomes based on hypotheses by formulating a plan to test the prediction; collecting and processing data; and verifying the research findings by making final conclusions and presenting the findings in an appropriate form.
C. Operational Definition
1. Student satisfaction (Y)
51
Student Satisfaction indicators 1. Academic advising 2. Social activities 3. Learning experience 4. Student support service 5. Library
6. Course content
7. Quality of instructions 8. Adaptability
2. Student Engagement (X1)
Researchers have recently used the term engagement to refer to the extent to which students identifywith and value schooling outcomes, and participate in academic and non-academic school activities. Itsdefinition usually comprises a
psychological component pertaining to students’ sense of belonging at schooland
acceptance of school values, and a behavioural component pertaining to participation in school activities(Harris, 2008). The psychological component emphasises students’ sense of belongingor attachment to school, which has to do with feelings of being accepted and valued by their peers, and byothers at their school. Another aspect of the psychological component concerns whether or not studentsvalue school success – do they believe that education will benefit them personally and economically(Chen, Gonyea and Kuh, 2008). Students who do not feel they belong at school, or reject school values, areoften referred to in the literature as alienated or disaffected. The participation component of engagementis characterised by factors such as school and class attendance, being prepared for class, completinghomework, attending lessons, and being involved in extra-curricular sports or hobby clubs.
52
degree to which learners are engaged with their educational activities and that engagement is positively linked to a host of desired outcomes, including high grades, student satisfaction, and perseverance. Other studies define engagement in terms of interest, effort, motivation, time-on-task and suggest that there is a causal relationship between engaged time, that is, the period of time in which students are completely focused on and participating in the learning task, and academic achievement (Bulger, et al., 2008).
In this research student engagement has come to refer to how involved or interested students appear to be in their learning and how connected they are to their classes, their institutions, and each other. The following are the indicators of student engagement: thoughts, level of responsibility, participation, motivation, interest, collaboration, and test readiness.
3. Teachers’ Performance (X2)
53
psychological environmentin which organizational goals are pursued. Contextual performance includes notonly behaviors such as helping coworkers or being a reliable member of the organization,but also making suggestions about how to improve work procedures.
In this research, teachers’ performance means teaching activities which contribute to student satisfaction including integration of ICT in learning and these activities should have performative aspects of teaching, leading, testing, accountability, and policymaking.Teachers do not just become reliable members of school but also participate in the improvement of student satisfaction in ICT.
Teaching is a complex activity. Competent teachers apply broad, deep, and integrated sets of knowledge and skills as they plan, implement and revise instructions. Technology proficiency (including technical skills and instructional applications) is but one dimension of teacher competence.
Definition Dimension Indicators & Items
Student
satisfaction
Dill, D (2007)has
described the
application of
acustomer
satisfaction model to
student evaluationof
teacher performance.
He has established a
linkbetween student
evaluation and
student satisfaction.
Student’
satisfactionis defined
by Sean B. Eom,
(2011) as students’
assessments of the
services provided by
Schools, universities
and colleges.
Student as a
customer is the
one who can tell
how far he or she
is satisfied not
teachers.
Academic
Academic advising & instructions
Learning experience
Course content:items 1-8 Social
Social activities
Student support service
Attitude: items 9-11 Library
Library equipment
Quality of instructions
Adaptability: items 12-14 ICT
ICT’s facilities items:15-18
Adaptability
54
Douglas, J.,
McClelland, R.,
Davies, J.
(2007)argued that
satisfaction is an
emotional
factor.Thus,
satisfaction can be
considered as a
reflection of life
experience: it is a
subjective view
based on personal
experience,
individual beliefs
and relationships.
Student
engagement
Stovall (2009)
suggests that
engagement is
defined by a
combination of
students’ time on
task and their
willingness to
participate in
activities.
Krause and Coates
(2008) say that
engagement is the
quality of effort
students themselves
devote to
educationally
purposeful activities
that contribute
directly to desired
outcomes.
It covers student
willingness to do
school work.
It cover the efforts
that students
devote for their
work
All activities
including high
grades, student
satisfaction, and
Affective (Student perception)
Belonging/identification with school
School connectedness: items 22-23
Cognitive
Self-regulation
Relevance of school to future aspirations
Value of learning (goal setting): items 24-26
Behavioral
Attendance (absences, skips)
Participation (Classroom & extracurricular)
Behavioral incidences (office referrals,
suspensions): items 27-28
55
Additionally, Chen,
Gonyea and Kuh
(2008) say that
engagement is the
degree to which
learners are engaged
with their
educational activities
and that engagement
is positively linked
to a host of desired
outcomes, including
high grades, student
satisfaction, and
perseverance.
perseverance Time on task
Homework completion rate
Class grades: items 29-32
Teachers’
Performance
Performance is what
the organization
hires one todo, and
do well (Hanushek
and Rivkin, 2006).
Thus, performance is
not defined by
theaction itself but
by judgemental and
evaluative processes.
Moreover, only
actions which can be
scaled,
i.e.,measured, are
considered to
constitute
performance.
Performance is a
multi-dimensional
concept. On the most
basic level, Lavy, V.
(2009),distinguish
It covers
knowledge, skills,
attitudes, values,
motivations
and beliefs
Contextual
Interesting work
Class discussions
Allotted time
Time to help: items 33-40 Techno-oriented
The use of ICT
Time for practice
56
between task and
contextual
performance.
Murray, J., (2009).
Holds that
performance is not
defined by theaction
itself but by
judgemental and
evaluative processes.
Moreover, only
actions which can be
scaled,
i.e.,measured, are
considered to
constitute
performance
Table 3.3Operational definition (s)
D. Research Instrument
In view of the objective and purpose of the study, questionnaires with students will be organised.Close-ended questions will be formulated for each variable (Student engagement, Teachers’ performance and Student satisfaction) in order to get into the depth of each variable.
57
translated into dimensions, the dimensions are translated into sub-variables and sub-variables are translated into indicators. With measurable indicators can be used as a starting point to make the item instrument in the form of questions or statements that need to be answered by the respondents. Therefore, instrument is usedtoobtain informationfromsubjects in this studyisa questionnairewithanswer choices by usinga form of LikertScalewithfive weighted options.
- To know the level of the Influences of Students’ engagement (X1) in the day-to-day school operations, the Likert Scale questionnaire will be applied as below:
Student engagement
- To know teachers’ performance for student satisfaction (X2)
58
1. Instrument Development Process
Upon completion of data collection tool, then the next step is to test the form of a questionnaire-instrument or questionnaires disseminated throughout respondents to students in the targeted public senior High schools in Bandung city. In a test an instrument is used statistical analysis. Statistical test aims to test the validity and reliability so that it can be justified scientifically. The test validity and reliability are illustrated in the following following:
2. Test Validity of Data
Test Validity describes how the questionnaire will gauge intended variables, so the validity of test is the more appropriate tool of the planned target. Validity value is essential to the value of the correlation function to calculate the used items. The technique used in the total item correlation is consistency between the scores of items that can be seen overall magnitude of correlation coefficient between each item with an overall score, which is the basis of the Pearson Product Moment Correlation.
59
procedures to see whether in the form of questionnaires as a measuring instrument can measure carefully or not.
Validity is a measurement that indicates the validity of research instrument (Arikunto, 2006). To get data of the research, the instrument should be valid one. A test is be valid if the content of the test is consistent with the stated goal for which the test being administrated.
In order to test the validity of the instrument, the formula of Pearson Product Moment (Akdon & Hadi, 2005)will be used:
2 2
2
2
n XY X Y
r
n X X n Y Y
Where:
r : Correlation Coefficient N : Number of Respondents
ΣXY : Number of products X and Y pair scores ΣX : Total score in distribution X
ΣY : Total score in distribution Y
ΣX2 : Total score squares in the distribution of X ΣY2 : Total score of squares in Y distribution
Then the number of T-test calculations with the formula:
2
2
1
r
n
t
r
Where:60
For critical values of the t distribution (Table t), α = 0.05, and degrees of freedom (df = n - 2), the following formula will be followed:
If tcount> ttable means that the instrument is valid.
If tcount<ttable means that the instrument is invalid. Statistical Package for the Social Sciences (SPSS) version 19, which serves to measure the validity of any item questionnaire will be used as a measure of research.
3. Test Reliability of Data
According to Arikunto (2006), reliability is reliable if the result shows constancy. It means if a test is tested in another time or place the result is still constant.
Reliability test is done to obtain the level of accuracy (reliability) of data collection tool (instrument) which is used. To measure the level of reliability of the instrument, the researcher will conduct an analysis of test instruments using the split second (odd-even) and calculate reliability throughout the test Spearman Brown formula premises, namely:
11
2
1
b b
r
r
r
Where:
r11 = Reliability Internal Whole Instrument
rb = Product Moment Correlation between the First and Second Hemisphere
61
4. Measures of Variability
Variability indicates the spread of the scores in a distribution.Range, variance, and standard deviation all indicate the amount of variability in a distributionof scores. This information helps us see how dispersed the responses are to itemson an instrument. Variability also plays an important role in many advanced statisticalcalculations (Creswell, 2012).
5. Results of testing Instrument
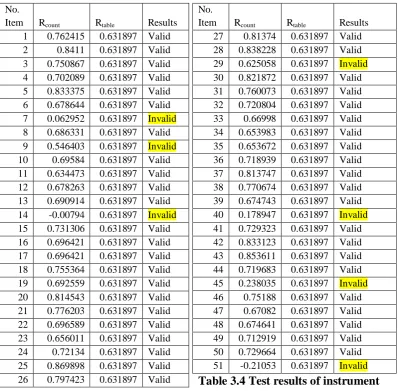
Validity is determined by the value ofthe significanceof each itemwithan item,that is, rcount,comparingthe correlation valuewiththe criticalvalue of rcritical which is0.631897. Whenrcount issmaller thanrcritical(rcount<rcritical) itis concludedthatthe item is notvalid. On the same hand, if rcountis greater thanrcritical(rcount>rcritical) then the itemis valid.
No.
Item Rcount Rtable Results 27 0.81374 0.631897 Valid 28 0.838228 0.631897 Valid 29 0.625058 0.631897 Invalid 30 0.821872 0.631897 Valid 31 0.760073 0.631897 Valid 32 0.720804 0.631897 Valid 33 0.66998 0.631897 Valid 34 0.653983 0.631897 Valid 35 0.653672 0.631897 Valid 36 0.718939 0.631897 Valid 37 0.813747 0.631897 Valid 38 0.770674 0.631897 Valid 39 0.674743 0.631897 Valid 40 0.178947 0.631897 Invalid 41 0.729323 0.631897 Valid 42 0.833123 0.631897 Valid 43 0.853611 0.631897 Valid 44 0.719683 0.631897 Valid 45 0.238035 0.631897 Invalid 46 0.75188 0.631897 Valid 47 0.67082 0.631897 Valid 48 0.674641 0.631897 Valid 49 0.712919 0.631897 Valid 50 0.729664 0.631897 Valid 51 -0.21053 0.631897 Invalid Table 3.4 Test results of instrument No.
[image:33.595.80.479.331.722.2]62
From 51 items (questions) which were given to ten (10) respondents with the intention of testing the instrument (Validity and reliability) seven (7) items did not perform well hence they are invalid and therefore I cannot use them.
Meanwhile, fromthe calculations, the greatest value ofrcounton Student Satisfaction (Y) is .833. Thencheckedwithrtabelwheredf =(n-2) df =10-2=8at the5% levelis0.63. This means that thevariableYquestionnaireaboutStudent satisfaction isreliable, becausercount>rtable.
Student Satisfaction 1. Validity
Reliability Statistics
Cronbach's
Alpha N of Items
.939 24
According to Cronbach’s Alpha these results are reliable since the outcome is 0.939.
Student Engagement 1. Validity
Inter-Item Correlation Matrix
Total
Total 1.000
p25 .870
p26 .797
p27 .814
p28 .838
p29 .625
p30 .822
Inter-Item Correlation Matrix Total
Total 1.000
p1 .762
p2 .841
p3 .751
p4 .702
p5 .833
p6 .679
p7 .063
p8 .686
p9 .546
p10 .696
p11 .634
p12 .678
p13 .691
p14 -.008
p15 .731
p16 .696
p17 .696
p18 .755
p19 .693
p20 .815
p21 .776
p22 .697
p23 .656
63
p31 .760
p32 .721
p33 .670
p34 .654
p35 .654
p36 .719
2. Reliabilitas
Reliability Statistics
Cronbach's
Alpha N of Items
.918 12
According to Cronbach’s Alpha these results are reliable since the outcome is 0.918
Teachers Performance 1. Validity
Inter-Item Correlation Matrix
Total
Total 1.000
p37 .814
p38 .771
p39 .675
64
p41 .729
p42 .833
p43 .854
p44 .720
p45 .238
p46 .752
p47 .671
p48 .675
p49 .713
p50 .730
p51 -.211
2. Reliability
Reliability Statistics
Cronbach's
Alpha N of Items
.889 15
According to Cronbach’s Alpha these results are reliable since the outcome is 0.889
6. Testing analysis
a. Weighted MeansTestScored
This activity isscoringineveryalternative answersgiven bythe respondentsin accordancewith thepredeterminedweights. Any statement inthe thirdvariable hasthe answerwith5criteriawhichstartsfrom1,2,3,4,
and5withprovisionfordeclaration ofcalculation offigures.
Percentageofeachvariableaimstoidentify trends
65
calculated byusing thefollowingformula. General descriptionof eachvariableis describedbyan average scorethat obtained from thefollowing formula:
Description:
X: The average valuesought
X: totalcomposite score(frequency multiplied by theweighingforeachanswer alternativecategory)
N: Number of respondents
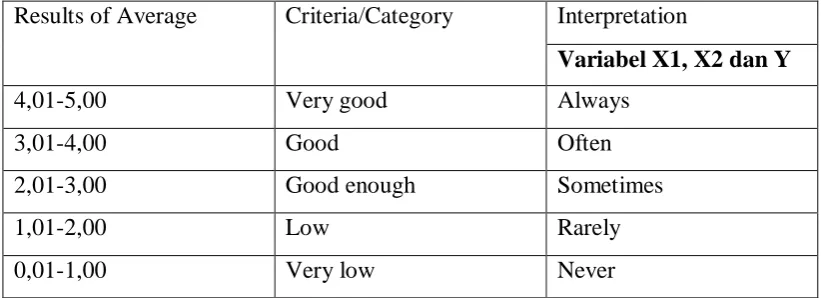
WeightedMeansclusteringcriteriondeterminesScored(WMS)tothe average scoreof eachpossible answer. In average score all respondents are represented with weighted means score. The followingcriteria or table will be used to determine the averages of all items in order to know the category in which they fall:
Results of Average Criteria/Category Interpretation
Variabel X1, X2 dan Y
4,01-5,00 Very good Always
3,01-4,00 Good Often
2,01-3,00 Good enough Sometimes
1,01-2,00 Low Rarely
[image:37.595.78.489.445.594.2]0,01-1,00 Very low Never
Table 3.5WeightedMeans 7. Normality test
66
Description: 2 = Chi-square
f0=frequencyobservations fe=frequencyexpected
To knowwhether data isnormalornot, it can be determinedthetesting criteriaasfollows:
IfX2≥X²table, meaningAbnormalDataDistribution
IfX2<X2table, meaning thatdistribution of data is normal. E. Techniques of Data Collection
These are the tools and approaches used to collect data to answer the research question and hypothesis. More than one technique can be employed; the commonest are questionnaires and interviews. Technique of data collection is the way that can be used by the researcher to collect data (Arikunto, 2006). To collect the data, the researcher will use a questionnaires as an instrument. Questionnaire is a series of questions or exercises of other means of measuring skill, knowledge, intelligence, and capacities of aptitudes or an individual or groups (Arikunto, 2006).
Based on this, data from the field will be collected through questionnaires. The researcher will administer the questionnaires personally. And the researcher will also visit the schools for obtaining the opinions of students
F. Techniques of DataAnalysis
67
and standard deviation in order to test if those data are valid. Data analyzing technique involves three parts, namely, correlative analysis, comparative analysis, and descriptive analysis (Arikunto, 2010). Correlation methods of analysis aim to describe the correlation between the two variables. Correlation analysis attests the relation between two or more variables, but does not measure the causal relation between them. Correlation analysis may also indicate the intensity of the relationship between variables (KOPPA, 2013). Comparative analysis is the item-by-item comparison of two or more processes, qualifications and sets of data, system, products, comparable alternatives or the likes. Comparative analysis is meant to solve the mistakes made by casual inferences mainly on the basis of only small number of cases. The descriptive analysis is utilized in this research. In fact, the descriptive analysis is used if the researcher wants to know how, how far, and so on about the condition. In this research, the descriptive quantitative technique is used to measure the mean and the level of effectiveness of the influence of student engagement and teachers performance for student satisfaction.
In the implementationof thisresearchdata analysis, data processingis donethroughthe help ofthecomputerprogramStatistical Package fortheSocialSciences(SPSS) version19. The analysis techniqueusedin this studyisthe correlationanalysis(Pearson Product Moment) andmultiplecorrelations. This analysiswillbe usedtotestthe influenceof variablesX1andX2to variable Y.This analysisdetermines the effect of Influences of Students’ engagement(X1) and Teachers’ performance (X2) for Student satisfaction(Y) in the public senior high schools in Bandung. The formula ofPearsonProduct Moment(PPM) is shown as below:
Where:
68
Yi : Total scoretotal(all items) n: Number of respondents
x̄
:XAverage � :Y Average: Summation
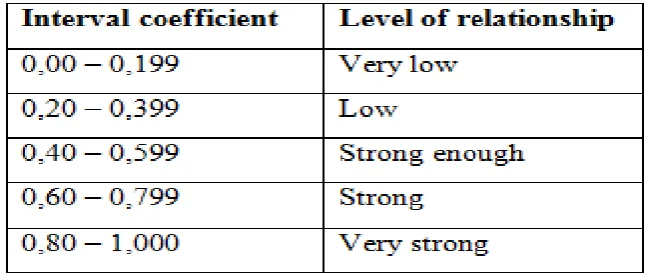
Correlationrwiththe provisions ofPPMisnotmorethanthe value of r(-1 ≤r≤+1). If thevalue of r=-1 meansa perfect negativecorrelation, r=0means nocorrelation. Meanwhile, r=1 means thatthe correlation isverystrong. Meaningthe
valuerwill be consultedwith
[image:40.595.117.443.360.497.2]acorrelationcoefficientvalueinterpretationtabler(Riduwan, 2010).
Table 3.6 Interval coefficient
To measurethe size of theinfluencegiven bythe variableXto variable Y, then, the following formula will be used:
2
100%
KD r
Where:
69
Meanwhile, to test the significance the following formula will be used:
2
2 1 hitung
r n t
r
Where:
tcount : Value of t
r : Correlationcoefficientvalue n : Number of samples
Distribution(Table t) forα=0.05, anddegrees of freedom(df = n-2), thedecisionrule: iftcount>ttable, it means that significantandvice versa.
Determination of the effect ofvariablesX1andX2 tovariable Y is used with the multiplecorrelation formulaasbelow:
1 2 1 2 1 2
1 2
1 2
2 2
. . . . .
. . 2
.
2
.
.
1
X Y X Y X Y X Y X X X X Y
X X
r
r
r
r
r
R
r
70
X1 = Students’ Engagement
X2 = Teachers’ Performance
Y = Student Satisfaction R = Coefficient Correlation
I will use SERVQUALas a way of trying to measure service quality; researchers have developed a methodology known as SERVQUAL – a perceived service quality questionnaire survey methodology. SERVQUAL examines five dimensions of service quality:
Reliability Responsiveness Assurance; Empathy, and
134
CHAPTER V
CONCLUSIONS AND RECOMMENDATIONS
A. CONCLUSIONS
This study “The influence of student engagement and teachers’ performance to student satisfaction in public senior high schools” firstly aimed to
measure the influence student engagement to student satisfaction and teachers performance to student satisfaction. I collected data from five public senior high schools in the city of Bandung. I used excel and SPSS to analyze the data. I chose one school from every region (South, North, West, East and Centre) hence they are five in number.
In conclusion, student engagement was found to be in good enough category. It means that they sometimes take their engagement serious in their learning. This is good enough sign but they still need to improve in order to reach
the highest category. In details students’ engagement gave the following results: The results from respondents gave a total averagewhich is good enough or falls in strong enough categoryand there were questions which were meant to get the idea of how students consider their engagement in as far as affection is concerned. This average means that student engagement with affection as an indicator to student satisfaction falls under good enough category. This means that they sometimes experience these in schools. Therefore affective student perception with the sense of Belonging/identification with school andSchool connectedness is good enough in average and it is strong enough.
135
studies. When we look at their age one can conclude that it is a good sign in their learning process. Therefore cognitive Self-regulation, relevance of school to future aspirations and value of learning (goal setting) is good enough in average in SMAN in Bandung.
The part of students’ behavior is one of the lowest averages ehich falls in
strong enough but with the lowest mark.This has got more to do with the day-to-day activities of the school that concern students. Attendance (absences, skips), Participation (Classroom & extracurricular), Behavioral incidences (office referrals,
suspensions) are but the few examples in this indicator which has influence in student
satisfaction. This average means that student engagement with behavioral part as an indicator to student satisfaction falls under low category. This means that in average they rarely experience these in schools. This can be interpreted as a good sign of a good behavior that students have or portray. Therefore behavioral incidences in this school are low in average. This can mean that few students have
experienced referrals to principal’s office for misbehavior.
The academic element gave average which is good or strongand this
has got more to do with Time on task, Homework completion rate, Class grades. This average means that student engagement with academic part as an indicator to student satisfaction falls under good enough category. This means that in average they sometimes experience these in schools. Therefore academic engagement of students in this school on task, Homework completion rate, Class grades is good enough in average.
All in all student engagement has got average which is good enough. This is strong enough or good enough. As a result, students still need to improve and put their attention to their studies in order to get good results which will see them developing.
When we look at the total average in as far as teachers’ performance in being contextual when they teach is concerned,the average that we got from the
results is good enough. Therefore teachers’ performance in as far as contextual
136
teach falls under good enough category. This means that they (Students) sometimes experience this good performance which is contextual in school. Therefore this indicator which is all about being contextual with the interesting work, class discussions, and allotted time to help students is good enough in average in these schools.
The results gaveaverage which is strong enoughin as far as teachers’ performance in integration of technology in the process of learning is concerned. This has got more to do with how teachers use technological equipment in school. Almost every class has got projectors for slides and libraries also have got good equipment. This average means that teachers’ performance with technology as an indicator to student satisfaction falls under good enough category. This means that in average they sometimes experience this in school. Therefore techno-oriented indicator is good enough in average in these schools (SMAN).
In a nut shell results gave a total average of teachers’ performance as
strong enough in Bandung. This falls in good enough category or strong enough category.
The total average in academic advising and instruction isgood enough tooand this average means that student satisfaction with academic advising and instruction as an indicator to student satisfaction falls under good enough category. This means that they sometimes experience this in school. ThereforeAcademic advising & instructions with Learning experience and Course content is good enough in these schools (SMAN).
Social activities inside and outside the campus have got total average which is good also. This has got more to do with social activities,student support service and attitude. This average means that student satisfaction with social activities
as an indicator to student satisfaction falls under good enough category. This means that in average they sometimes experience or do indulge into social activities in their schools. Thereforesocial activities,student support service and attitudeare good
enough in average.
137
category. This has got more to do with the day-to-day activities of the library of the schools. This average means that student satisfaction with library as an indicator to student satisfaction falls under good enough category but with a small marginal difference category of wow or weak. This means that in average they sometimes find library useful to their education. Therefore library in this school is good enough in average.
Information and Communication Technologies have a total average which is good enough tooand this average means that student satisfaction with ICT part
as an indicator to student satisfaction falls under good enough category. This means that in average they sometimes use ICT’s facilities and they sometimes find them useful to their education these schools. Therefore ICT in these schoolsis good enough in average. We can also conclude that ICT in SMAN in Bandung is good enough.
New students in every school have to undergo the process of adaptability which is all about getting well with the existing system in the campus. In this part the total average is good enoughand this has got more to do with
respect for others and getting the same things from others. This average means that student satisfaction with adaptability part as an indicator to student satisfaction falls under good enough category. This means that in average they sometimes experience these in schools. Therefore adaptability with respect for others and getting the same things from othersis good enough in average. It all about being treated as a human being in school.
138
The findingthat behavioral engagement decreases as students progress from earlier to later grades isconsistent with what has been previously reported by other researchers (Martin, 2009; Yazzie-Mintz, 2010), though behavioral engagement can beoperationalized in several different ways. In Martin’s (2009) study, behavioral engagementwas operationaized as student attentiveness in class.Yazzie-Mintz (2010) operationalizedbehavioral engagement as students’ participation in extra-curricular activities,interactions with other students, and connections with the greater community the schoolis located in. Martin (2009) further operationalized behavioral engagement as management oflearning tasks. Despite the differences in how behavioral engagement has been indexed,the results of the current study are in line with the trend in the literature that as studentsprogress through high school, they experience less behavioral engagement. The average of this indicator was good enough and this means there is still room for improvement on the side of students in order to be satisfied with their studies. All in all results show that student engagement is good enough in these schools but there is still a room for improvement.
There is correlation also between these variables just like between student engagement and student satisfaction. The value of0.338atRSquarecolumnmeansthat thecontribution madebyteachers performance to thesatisfaction ofthe student's is0.338x 100% =33, 8%. While the remaining100% -33, 8% =66, 2% belongs toother factorsthataffectstudent satisfaction,factorsbeyond the influence of teacher’s performance which are not examined in this research.
The results show total average of the influence of teachers’ performance to
student satisfaction is good enough. This includes application or integration of Information and Communication Technologies (ICT) in the process of learning. When I was collecting data I realized that almost every classroom in these schools
has got ICT’s equipment that is used to help students in the process of learning. This is not only promising but also amazing to find classrooms like these. Results
139
interesting for students things seem to be really good because results show that teachers often make classwork interesting for students. This is a good sign on the side of teachers and this call for a big round of applause for teachers for making learning interesting for students. It is also a kind of motivation for them.
Thetablein chapter four is about correlation, showed therelationshipbetween variables (Teachers performance, student engagement and
student satisfaction). Based onthattable we
caninterpretthatPearsoncorrelationvalueof teacher performancetostudent satisfactionis0.581andis in the interval0.4-0.599, which means the relationshipbetweenthevariablesis in the category of strong enough, so doesthe value ofthe Pearsoncorrelationstudent involvementonstudent satisfactionwith avalue of0.530andis in the interval0.4-0.599, which means the relationshipbetweenthevariablesin the category of strong enough. There is a strong enough relationship between these variables.
B. RECOMMENDATIONS
In order to provide further understanding of how various dimensions of studentengagement and teachers’ performance are linked to student satisfaction there are several future directions forresearch. To address gaps in the literature, future research should examine therelationship between the various dimensions and indicators of student engagement and teachers’ performance and student satisfaction over time (e.g., mental health, academic achievement). Such studieswould help build empirical rationales for where to intervene and how to improve studentengagement and teachers’ performance in order to improve students’ satisfaction.
140
sample inorder to permit comparisons between students enrolled in public senior high school.
141
References:
Abbott, C. (2009). ICT: Changing Education, London, Routledge
Abdullah, Firdaus (2006). Measuring service quality in higher education:
MarketingIntelligence & Planning, 24(1), 31-47.
Akbulut, Y. (2009). Investigating underlying components of the ICT indicators measurement scale: the extended version. Journal of Educational
Computing Research, 40(4), 405-427.
Akdon, & Hadi, S. (2005). Aplikasi Statistika dan Metode Penelitian untuk
Administrasi & Manajemen. Bandung: Dewa Ruchi.
Applegate, C., & Daly, A. (2005). The impact of paid work on the academic performance of students: A case study from the University of Canberra. The
Centre for Labour Market Research, 1–12.
Archambault, I., Janosz, M., Fallu, J.-S., & Pagani, L. S. (2009). Student engagement and its relationshipwith early high school dropout. Journal of
Adolescence, 32 (3), 651–670.
Ardichvili, A., Maurer, M., Li, W., Wentling, T.,& Stuedemann, R. (2006). Cultural influences onknowledge sharing through online communitiesof practice. Journal of Knowledge Management,10(1), 94–107.
Areti, V. (2006).Satisfying distance education students of the Hellenic Open
University, E-mentor, 2(14), 1-12.
Bryant, J. L. (2006). Assessing expectations and perceptions of the campus experience: The Noel-Levitz Studen