Doctoral Dissertation
Academic Year 2019
Seaweed metabolomics and its applications
Graduate School of Media and Governance
Keio University
Seaweed metabolomics and its applications
Shahlizah Binti Sahul Hamid
A dissertation for the degree of
Doctor of Philosophy
in the Graduate School of Media and Governance
Systems Biology Program
KEIO UNIVERSITY
2019
I
Seaweed metabolomics and its applications
Abstract
Japan is the highest producer and consumer of seaweed in the world. Seaweed are classified into 3 groups; red, brown, and green algae. A comprehensive profiling of metabolites of seaweed is not readily available in mass spectrometry-based (MS) methods. MS-based methods require only a small amount of sample, but sample pre-treatment is necessary. However, the effects of drying and extraction methods are not well established. In the first part of the study, the effects of different pre-treatment methods were initially evaluated on three Japanese brown algae species. Freeze-drying was able to retain a higher number of high concentrations of metabolites as compared to oven-drying, while extraction methods had no significant effect on the metabolites’ concentrations. The second study then used the freeze-dried method to investigate the metabolites relationship between the various seaweed’ groups collected from Tohuku area; four brown, five red, and two green algae. Two extraction methods were tested. Consequently, the results confirmed that species characterization was the main factor affecting the metabolites profiles, not extraction methods. Particularly, only sugar profiling was able to discriminate between the seaweed’ groups. Mannitol is the main constituent in brown algae, while fructose, sucrose, and glucose are in green algae. For red algae, it mostly depends on the individual species. Finally, the effect of heat on individual species was examined as metabolites profiling is unique in each species. Two parts of Undaria
pinnatifida, Wakame (leaf) and Mekabu (sporophyll), are normally blanched in boiling
water for a certain period before consumption. In order to retain the high metabolites concentrations, Wakame and Mekabu were shown to prefer blanching times of less than 20 and 40 seconds, respectively. These comprehensive metabolites data can be used as a basis for further explorations in other fields of research; namely, pharmaceutical (drug) and nutraceutical (food).
論文題目
海藻のメタボローム解析およびその応用
論文要旨
海藻は陸生植物と比較して特有の代謝経路を保持しており,食品および医薬品 など他の産業にとっても重要である.質量分析法(MS)は核磁気共鳴法よりも少 量の試料しか必要としないが,MS を用いた包括的な海藻メタボローム研究は極 めて少ない.このため本研究では,質量分析計を用いたメタボロミクス解析のた めの前処理法を確立し,海藻における基礎および応用研究に活用した.まず,3 種類の食用褐藻類について異なる前処理方法の影響を評価した.凍結乾燥はオ ーブン乾燥と比較してより多くの物質を高濃度で検出できた.一方,抽出法の違 いは乾燥方法の違いよりも構成される物質濃度に大きな影響を及ぼさなかった. 次に,3 つの海藻グループである褐藻,紅藻,および緑藻について前述の凍結乾 燥法を使用して分析を行うと共に,2 つの抽出法の違いによる影響も確認した. 代謝産物プロファイルは抽出方法よりも種分類群によって特徴付けられていた. 海藻の分類を識別するには糖類のみを用いることが有効であり,マンニトール は褐藻,フルクトース,スクロース,グルコースは緑藻に含まれていることから 各藻類の特徴づけができた.紅藻類の場合は個々の種に糖類の特徴が依存して いた.第三の研究として,ワカメ(Undaria pinnatifida)の 2 つの部位,包葉 部(ワカメ)および胞子体(メカブ)に対する加熱効果を解析した.ワカメの構 成成分濃度は加熱 20 秒以内に劇的に減少したが,メカブは 40 秒後に徐々に減 少していた.この過程で,茶褐色から緑色への色の変化が観察された.多くの構 成成分濃度は加熱時間の増加とともに減少した.これらの研究は食品あるいは 水産関連産業といった様々な産業研究分野における探索に用いることができ, 更なる発展的利用が期待される. キーワード:海藻,代謝産物,質量分析,前処理法,加熱調理Table of Contents
III
Table of Contents
List of Tables ... VI List of Figures ... VII
Chapter 1 ... 1
Introduction 1.1 Background ... 1
1.2 Objectives ... 7
Chapter 2 ... 9
Drying and extraction effects on three edible brown algae for metabolomics 2.1 Introduction ... 9
2.2 Materials and methods ... 11
2.2.1 Sample drying ... 11
2.2.2 Chemicals and reagents ... 12
2.2.3 Sample extractions ... 12
2.2.4 Quadrupole LC-MS/MS mass spectrometry conditions for free sugar analysis ... 13
2.2.5 Capillary electrophoresis-mass spectrometry (CE-MS) analysis of free amino acids, organic acids, and charged metabolites ... 14
2.2.6 Cationic metabolite analysis ... 14
2.2.7 Anionic metabolite analysis ... 15
2.2.8 Metabolite peak and statistical analyzes ... 15
2.3 Results ... 17
2.3.1 Dry weight percentage ... 17
2.3.2 Metabolite profiles of the three brown algae species ... 19
2.3.3 Independent species multivariate analyzes ... 22
2.3.4 Characteristics of Mozuku ... 24
2.3.5 Characteristics of Kombu ... 28
2.3.6 Characteristics of Wakame ... 31
2.3.7 Effects of drying on metabolite concentration ... 34
2.3.8 Effects of extraction solvent on metabolite concentration ... 34
2.4 Discussion ... 35
2.4.1 MS-based metabolomics for seaweed ... 35
2.4.2 Species characteristics of metabolomics ... 36
Chapter 3 ... 38
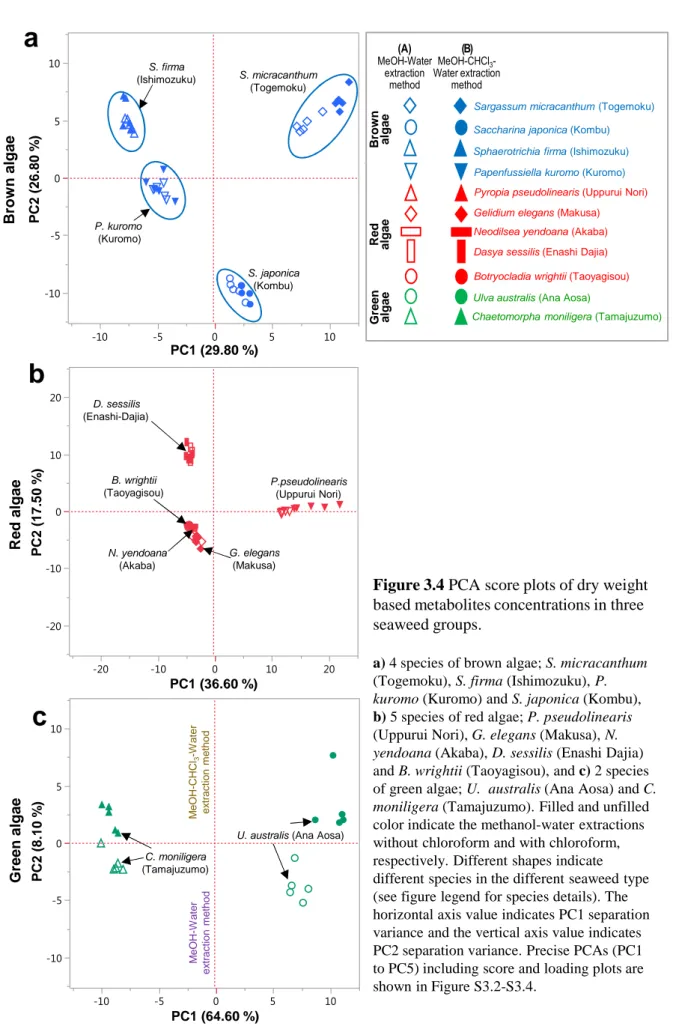
Metabolomics profiling of various seaweed species discriminates between brown, red, and green algae 3.1 Introduction ... 38
3.2 Materials and methods ... 41
3.2.2 Sample preparation by freeze drying ... 44
3.2.3 Chemicals and reagents ... 44
3.2.4 Sample extractions... 44
3.2.5 Free sugar analysis by quadrupole liquid chromatography-tandem mass spectrometry (LC-MS/MS)... 45
3.2.6 CE-MS analysis of free amino acids, organic acids, and charged metabolites ... 46
3.2.7 Cationic metabolite analysis ... 46
3.2.8 Anionic metabolite analysis ... 47
3.2.9 Statistical analysis ... 48
3.3 Results ... 49
3.3.1 Dry weight ... 49
3.3.2 Overview of the metabolite profiles ... 49
3.3.3 Effect of extraction methods ... 53
3.3.4 Metabolite characteristics of three group of seaweed... 56
3.3.5 Metabolites characteristics in brown algae ... 56
3.3.6 Metabolites characteristics in red algae ... 57
3.3.7 Metabolites characteristics in green algae ... 58
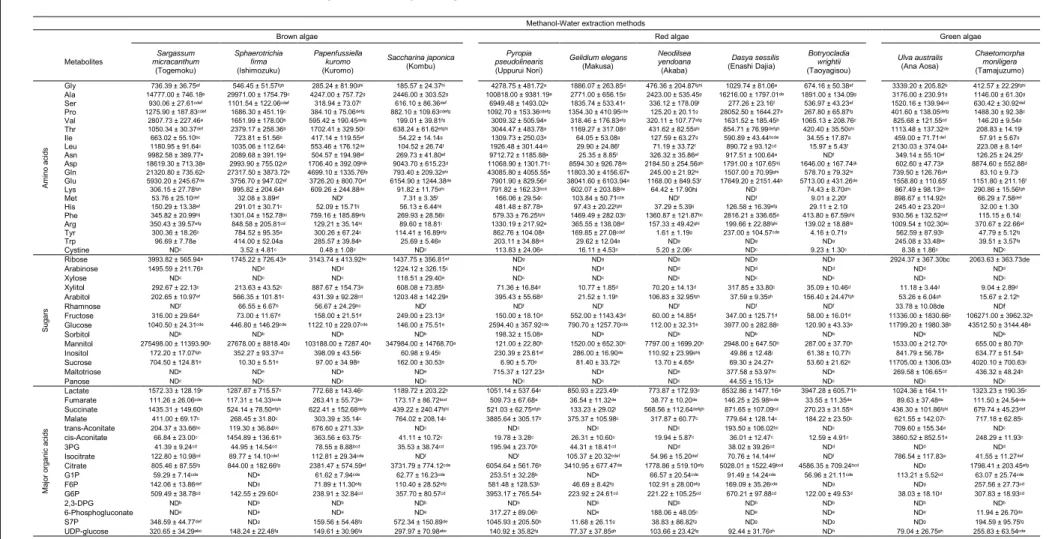
3.3.8 Amino acid and sugar profiling in various seaweed ... 58
3.4 Discussion ... 65
3.4.1 Taxonomic differences of metabolite profiles ... 65
3.4.2 Sugar profiling ... 66
3.4.3 Amino acid profiling ... 67
3.4.4 Effect of the extraction methods on the metabolite profiles ... 68
3.4.5 Metabolite characteristics of each species ... 68
Chapter 4 ... 70
Effect of blanching on the metabolites profiling in Wakame and Mekabu 4.1 Introduction ... 70
4.2 Materials and methods ... 72
4.2.1 Seaweed samples ... 72
4.2.2 Blanching process ... 72
4.2.3 Sample drying ... 72
4.2.4 Color analysis ... 73
4.2.5 Sample selection for metabolome analysis using sensory evaluation ... 78
4.2.6 Chemicals and reagents ... 78
4.2.7 Sample extractions... 79
4.2.8 Free sugar analysis by liquid chromatography-quadrupole mass spectrometry (LC-MS/MS) ... 79
4.2.9 Analysis of free amino acids, organic acids, and charged metabolites by capillary electrophoresis-mass spectrometry (CE-MS) ... 80
4.2.10 Cationic metabolite analysis ... 80
4.2.11 Anionic metabolite analysis ... 81
4.2.12 Peak quantification and statistical analysis ... 81
4.3 Results ... 83
4.3.1 The effect on blanching time on the color of Wakame and Mekabu ... 83
4.3.2 Selection of samples for the metabolome analysis using a sensory test ... 83
4.3.3 Moisture analysis ... 84
4.3.4 Overview of metabolites profiles in Wakame and Mekabu ... 84
4.3.5 Hierarchical clustering analysis and heat map metabolites profiles in Wakame and Mekabu ... 88
Table of Contents
V
4.3.7 Amino acids, sugars and other organic acids components of Wakame and
Mekabu ... 91
4.4 Discussion ... 96
4.4.1 Characteristics of the early blanching process in Wakame and Mekabu ... 96
4.4.2 The best blanching time for Wakame and Mekabu ... 97
4.4.3 Preserving metabolite concentrations ... 97
4.4.4 Metabolite changes in the blanching process ... 98
Chapter 5 ... 100 Concluding remarks 5.1 Main Conclusion ... 100 5.2 Future Direction ... 104 Acknowledgement ... 105 References... 107 Abbreviations ... 120
List of Tables
List of Tables
Table 2.1 Dry weight percentage of the samples after being dried using different drying methods... 18
Table 2.2 Free amino acid concentrations in Mozuku samples after various drying and extractions methods ... 27
Table 2.3 Free amino acid concentrations in Kombu samples after various drying and extractions methods……….……..…..……….. 30
Table 2.4 Free amino acid concentrations in Wakame samples after various drying and extractions methods ... 33
Table 3.1 Sample information; the species name, collection date, location and drying percentage after freeze-drying ... 43
Table 3.2 Amino acids, sugars and major organic acids of 11 seaweeds after methanol-water extraction method ... 63
Table 3.2 Amino acids, sugars and major organic acids of 11 seaweeds after methanol-chloroform-water extraction method ... 64
List of Figures
VII
List of Figures
Figure 1.1 Global commercial seaweed market demand based on end-user application ... 3
Figure 1.2 Research framework ... 8
Figure 2.1 PCA score plot of metabolite concentrations in three brown algae after all drying and extractions methods. ... 20
Figure 2.2 HCA and heat map of dry weight based of metabolite concentrations in all data set . ... 21
Figure 2.3 PCA score plot (PC1-PC2) of metabolites concentrations in three species ... 23
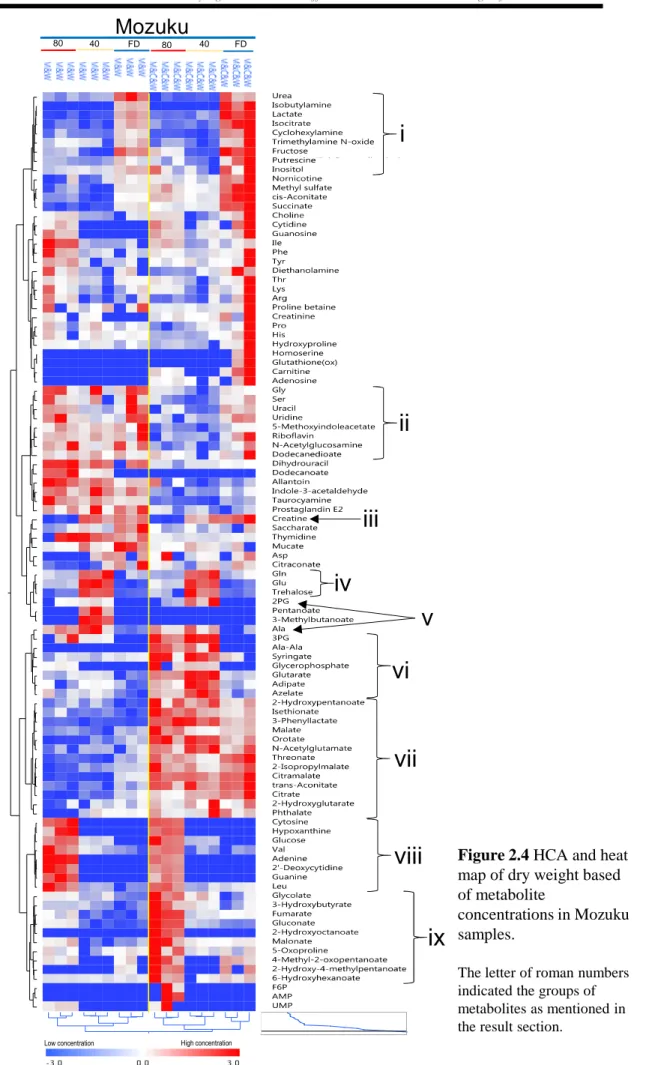
Figure 2.4 HCA and heat map of metabolite concentrations in Mozuku samples. ... 26
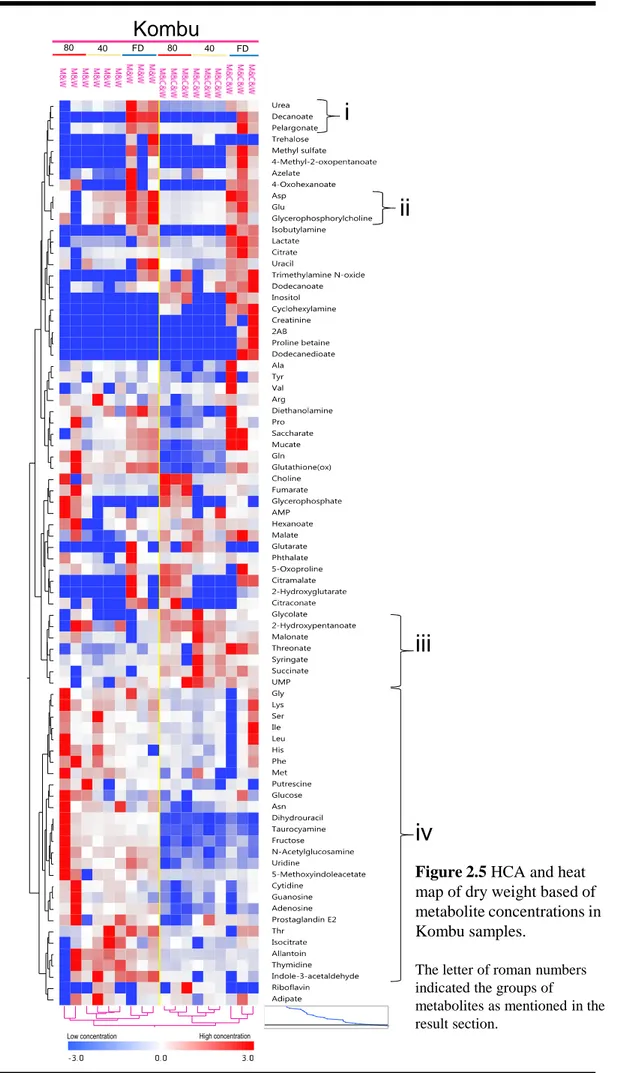
Figure 2.5 HCA and heat map showing metabolite concentrations in Kombu samples. ... 29
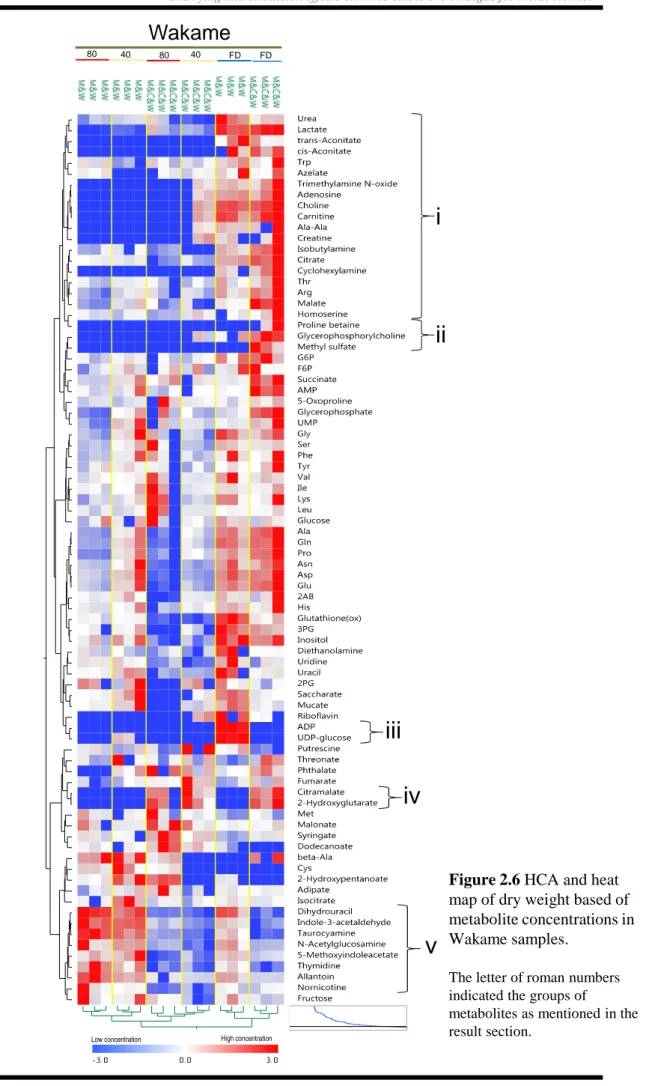
Figure 2.6 HCA and heat map showing of metabolite concentrations in Wakame samples. . 32
Figure 3.1 The photograph of analyzed samples. ... 42
Figure 3.2 PCA score plots of dry weight based metabolites concentrations in all data set of this research. ... 51
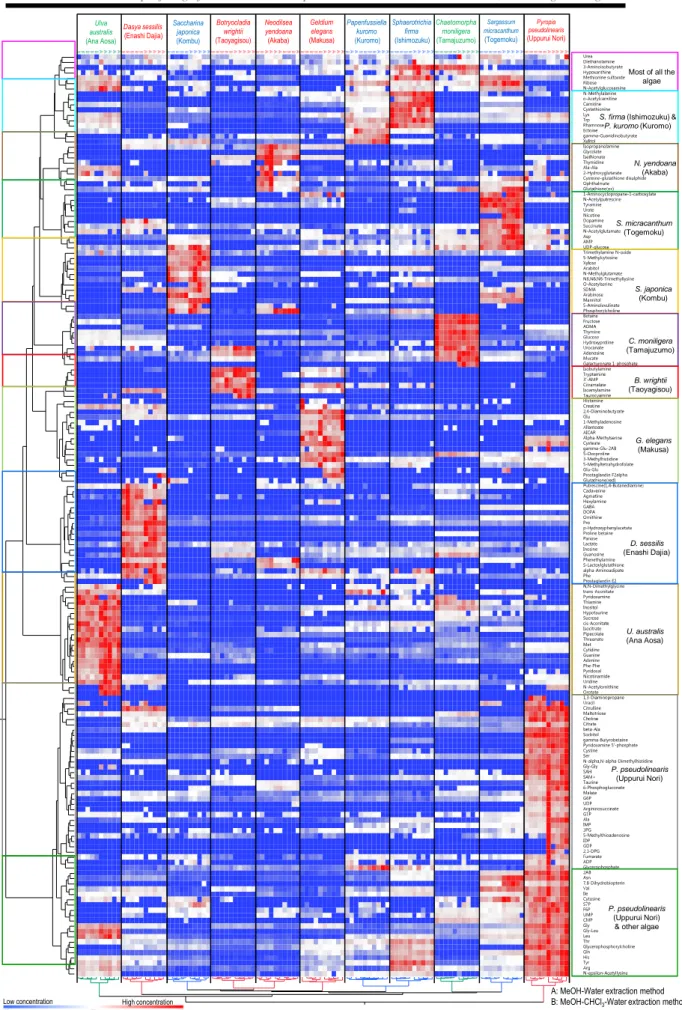
Figure 3.3 HCA and heat map of dry weight based metabolite concentrations in all data set of this research. ... 52
Figure 3.4 PCA score plots of dry weight based metabolites concentrations in three seaweed groups. ... 54
Figure 3.5 PCA score plots of dry weight based metabolites concentrations in all data set after two extraction methods. ... 55
Figure 3.6 HCA and heat map of dry weight based on amino acids concentrations in all species and extraction methods. ... 60
Figure 3.7 HCA and heat map of dry weight based on TCA and glycolysis organic acid concentrations in all species and extraction methods. ... 61
Figure 3.8 HCA and heat map of dry weight based on sugars concentrations in all species and extraction methods ... 62
Figure 4.1a The photograph of Wakame samples after different blanching time. ... 74
Figure 4.1b The photograph of Mekabu samples after different blanching time. ... 75
Figure 4.2a Color analysis of Wakame using ImageJ. ... 76
Figure 4.2b Color analysis of Mekabu using ImageJ. ... 77
Figure 4.3a PCA of Wakame dry weight based metabolite concentrations after blanching. ... 86
List of Figures
Figure 4.4 PCA and heat map of dry weight based metabolite concentrations in the Wakame
sample after blanching. ... 89
Figure 4.5 HCA and heat map of dry weight based metabolite concentrations in Mekabu samples after blanching. ... 90
Figure 4.6a Metabolites changes during the blanching process in amino acids. ... 92
Figure 4.6b Metabolites changes during the blanching process in sugars.. ... 93
Figure 4.6c Metabolites changes during the blanching process in organic acids.. ... 94
Figure 4.6d Metabolites changes during the blanching process in other metabolites. ... 95
1. Introduction
1
Chapter 1
Introduction
1.1Background
Seaweed or marine macroalgae are photosynthetic non-flowering plant-like organisms that are divided into three major groups based on their dominant pigmentation: brown (Phaeophyceae, approximately 1755 species), red (Rhodophyta, approximately 6000 species), and green algae (Chlorophyta, approximately 1500 species) (West et al., 2017; Gury & Guiry, 2018). Among all three seaweed groups, brown algae are phylogenetically distant from red and green algae. It is because brown algae are derived from the secondary endosymbiosis, while red and green algae are derived from the primary endosymbiosis of a prokaryotic photosynthesis (De Clerck et al., 2012; Groisillier et al., 2014). Seaweed is a unique organism as it is neither a plant nor an animal. Seaweed have neither leaves, roots, nor a specialized vascular system compared to terrestrial plants, yet, they nourish themselves by osmosis (Gupta & Abu-Ghannam, 2011).
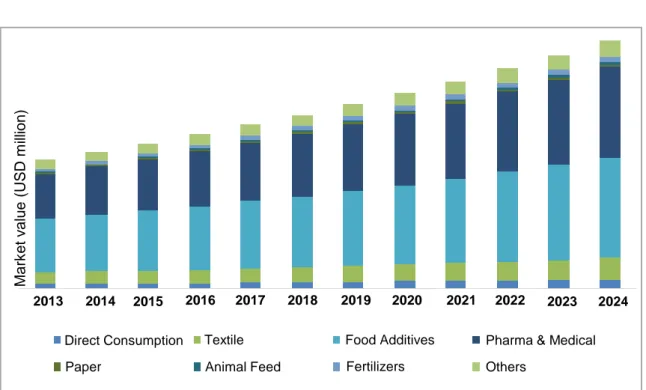
The demand for seaweed is increasing every year. According to Global Market Insight research, the global commercial market size for seaweed in 2016 was estimated at over USD 45 billion and expected to rise by over 8 % in 2024 based on the compound annual growth rate (CAGR) (Pulidindi & Rajpathak, 2017). Seaweed utilization as food in human consumption and food additive are rated as the highest global seaweed demand compared to the other uses of seaweed in the commercial markets such as in paper and textile industry, fertilizer and others (Figure 1.1). China, Japan and Korea are the highest seaweed consumers and producers in the world (Pulidindi & Rajpathak, 2017). Generally, seaweeds are consumed for their high nutritional value, either dried or fresh. Sometimes, seaweed are also used for flavouring purpose as some seaweed have umami
characteristics (Holdt & Kraan, 2011; Roohinejad et al., 2017). The average seaweed consumption in Japan is estimated at 10 gram per person per day (Leri et al., 2019). Okinawa’s population is known to have longevity and good health as a consequence of their seaweed-rich diet (Fitton, 2003). Besides direct consumption, the seaweed-derived hydrocolloid is usually used as a food additive since it contains gelling, thickening and stabilizing agents. As for animal feed, seaweed are able to boost the health, fertility and milk production (Gómez-Ordóñez et al., 2010; Kilinc et al., 2013; Peinado et al., 2014; Rodrigues et al., 2015; Stengel & Connan, 2015; Tanna & Mishra, 2018).
Seaweed industry is one of the primary resources for Japan’s economy besides fisheries (MAFF, 2016). It is estimated that more than 200 species of seaweed are found in Japan. This is because Japan is an island nation comprising of a total of 6852 islands which is surrounded by the Pacific Ocean, the Sea of Okhotsk, the Sea of Japan and the East China Sea. Japan has also a temperate climate, with four distinct seasons, that contributes to the diversity of the seaweed species (MFAJ, 2014). The production of seaweed in Japan was drastically reduced after the Great East Japan Earthquake in 2011. However, it has since reached up to 75 % of the pre-2011 levels (24,799 tones) in 2015 (MAFF, 2016). The high variety of seaweed species in Japan encourages research in seaweed taxonomy and naming of new species of seaweed. However, seaweed metabolomics research is still lacking.
M a rk e t v a lu e ( U S D m ill io n ) Direct Consumption Paper Textile
Animal Feed Fertilizers
Food Additives Pharma & Medical Others
2013 2014 2015 2016 2017 2018 2019 2020 2021 2022 2023 2024
Figure 1.1 The global commercial seaweed market demand based on end-user application.
1. Introduction
Metabolomics is an emerging research area which provides the latest insights in systems biology as it reflects the immediate biological information from genomics and transcriptomics. It is also a tool to advance the understanding of primary and secondary metabolism (Gupta et al., 2014). There are many analytical platforms which could generate extensive metabolites information (Heyman & Dubery, 2016).
Nuclear magnetic resonance (NMR) and mass spectrometry (MS) are the most popular methods for metabolites profiling. Commonly, MS-based analysis is coupled with gas chromatography (GC-MS) or liquid chromatography (LC-MS) or capillary electrophoresis (CE-MS) (Gupta et al., 2014; Gu et al., 2015; de Raad et al., 2016). Although NMR offers precise structural information, it requires a larger sample volume for quantification purposes compared to MS.
Among the MS-based methods, GC-MS is only suitable to analyze volatile metabolites and requires sample derivatisation (Hattab et al., 2007; Goulitquer et al., 2012; Andrade et al., 2013). On the other hand, LC-MS is useful to analyze the metabolites without derivatisation (Bedair & Sumner, 2008; Zhang et al., 2014). However, LC-MS requires chromatographic column for metabolites separation purpose. Generally, non-polar metabolites are separated using reverse-phase column such as C18 and C8, while, for polar metabolites, hydrophilic interaction liquid chromatography (HILIC) column is needed for better separation (Yoshida et al., 2007; Ikegami et al., 2008). Alternatively, CE-MS is a powerful tool to analyze charged metabolites. (Soga & Heiger 2000; Soga et al., 2002; Ramautar et al., 2009; Hirayama et al., 2014; Wakayama et al., 2015).This is because, most of the primary metabolism metabolites such as amino acids, carboxylic acid, sugar phosphate, and nucleic acid are charges; either cation or anion. The separation of metabolites using CE principally depends on the metabolite charge and size. The unit used is mass to charge ratio (m/z) and it is detected using MS. CE-MS only requires a small amount of sample to identify a comprehensive metabolites profile.
However, the extraction process is crucial (Cai & Henion, 1995; Ramautar et al., 2009; Wakayama et al., 2015). Solvent extraction method is the most common method among the extraction methods, especially for MS-based analysis. However, there is not a single solvent which is able to extract all the metabolites simultaneously, thus an optimization process is required (Sekiyama et al., 2010; Kim & Verpoorte, 2010; Ernst
1. Introduction
5
such as chloroform is often used to enhance the extraction of polar and non-polar compound concurrently (Bligh & Dyer, 1959; Kim & Verpoorte, 2010; Ernst et al., 2014).
Seaweed contain various bioactive components such as proteins, minerals, vitamins, soluble dietary fibres, antioxidants, phytochemicals and polyunsaturated fatty acids (Holdt & Kraan, 2011; Gupta & Abu-Ghannam, 2011; Amorim et al., 2012; Brown et al., 2014; Pal et al., 2014; Hamed et al., 2015). Seaweed are also valuable as a renewable economic resource of the oceans as they have different morphological and physiological characteristics compared to terrestrial plants. The reason for this is that seaweed inhabit a harsh aquatic environment and experience a range of ecological diversity. Thus, the chemical components in seaweed vary with species, habitat, salinity, temperature, light intensity and other environmental conditions (Goulitquer et al., 2012; Kumar et al., 2016; Werner et al., 2016; Palanisamy et al., 2018). Besides that, seaweed also experience stress due to the threat from invasive species and pathogens (La Barre et al., 2004; Jamers et al., 2009; Liu & Pang, 2010; Kaaria et al., 2015; Kumar et al., 2016).
Therefore, it is important for us to have a better understanding of seaweed metabolites profiling. Previously, many studies were carried out on seaweed chemical components (Robledo & Freile Pelegrín, 1997; Tabarsa et al., 2012; Date et al., 2012; Rodrigues, et al., 2015; Palanisamy et al., 2018). Nevertheless, only specific species were focused on in those studies. For example, the studies on the whole genome sequence data of red algae, Chondrus crispus (Collén et al., 2013) and brown algae Cladosiphon
okamuranus (Nishitsuji et al., 2016), and Ectocarpus siliculosus (Cock et al., 2010;
Michel et al., 2010; Rousvoal et al., 2011). Other studies only concentrated on specific compounds such as lipids and their derivatives (Thompson, 1996; Sánchez-Machado et al., 2004; Harwood & Guschina, 2009; Brett & Kainz, 2013; Miyashita et al., 2013; Gerasimenko & Logvinov, 2016), as well as mono- and polysaccharides of various seaweed (Percival, 1979; Skriptsova et al., 2010; Wijesekara et al., 2011; Rioux & Turgeon, 2015; Garcia-Vaquero et al., 2017; Robin et al., 2017). However, the comprehensive metabolomics studies for marine macroalgae are still lacking especially in various seaweed groups.
In comparison, there are more than 50,000 terrestrial plant metabolites data in KNApSAck database (http://kanaya.naist.jp/KNApSAcK/) (Nakamura et al., 2014). Whereas, only 1110 seaweed metabolites are contained in Seaweed Metabolites Database
(SWMD; http://www.swmd.co.in/) and most of the data are from one species, the red alga,
1. Introduction
7
1.2Objectives
Seaweed are one of the economically important crops used as food and non-food application. They have various bioactive components that are beneficial for human and other organisms. The harsh living environment and the unique physiology characteristics of seaweed make them of particular interest for further exploration especially in the metabolite components. In comparison to terrestrial plant, the information on seaweed metabolites is limited. Thus, by using metabolomics-based approaches, the comprehensive metabolites from seaweed could be attained.
The aim of this study is to comprehensively profile seaweed metabolites using Japanese seaweed via MS-based methods (CE-MS and LC-MS). This study is divided into two parts: basic research and applied research. The basic research is covered in Chapter 2, while applied research in Chapter 3 and Chapter 4. In Chapter 2, the seaweed pre-treatment methods, drying and extraction, were established using three species of brown algae. In Chapter 3, by using the unified pre-treatment methods, the metabolome profiling of brown, red and green algae were conducted. In Chapter 4, the effect of heat treatment, such as blanching, on the metabolites’ concentration on one specific species,
Undaria pinnatifida, was investigated.Blanching is commonly applied in daily life before
the consumption of seaweed. The overall study framework carried out is illustrated as Figure 1.2.
This study provides an insight into seaweed metabolomics especially using MS-based tools. The comprehensive data generated from this study could be utilized as resource guide to further explore the uses of seaweed in foods and health-related fields, such as in nutraceuticals.
2. Drying and extraction effects on three edible brown algae for metabolomics
9
Chapter 2
Drying and extraction effects on three
edible brown algae for metabolomics
2.1Introduction
The brown algae, which comprise the class Phaeophyceae, are the largest group of multicellular algae with most of its species are edible (Wijesekara et al., 2011; Gupta & Abu-Ghannam, 2011). Brown algae like Cladosiphon okamuranus (Mozuku),
Saccharina japonica (Kombu), and Undaria pinnatifida (Wakame) are commonly
consumed in Asian countries such as Japan and Korea (Fitton, 2003). The nutritional and pharmaceutical benefits of these algae have been extensively studied. They contain fucoxanthin and fucoidan, which form part of a complex of polysaccharides with anticancer properties (Ale & Meyer, 2013; Zorofchian Moghadamtousi et al., 2014). Previous studies have been focusing on the variations in the specific properties of these compounds within and between species and throughout the seasons and geographic regions. Different chemicals used for extraction of metabolites have also been studied (Harnedy & FitzGerald, 2011). However, there are comparatively few studies on the effects of drying on seaweed compounds (Chan et al., 1997). Therefore, it is essential to comprehensively evaluate the effects of various drying and extraction methods on seaweed metabolites.
Drying decreases water activity, delays microbial growth, preserves desirable qualities, and reduces storage volume of seaweed (Gupta & Abu-Ghannam, 2011). Newly harvested wet seaweed must be dried before processing or else their quality will deteriorate quickly. Crude extracts of wet seaweed do not contain the desirable gel (Chan
et al., 1997; Wong & Cheung, 2001). For consumption and long-term storage, seaweed
are sun-dried, freeze-dried, or oven-dried (Chan et al., 1997). The choice of seaweed drying method is significant because it affects the nutritional composition as a whole. In
general, seaweeds are sun-dried by spreading them over a flat surface or by hanging them. In some places, a rotary heating dryer is used (Gupta & Abu-Ghannam, 2011). The oven-dried method uses hot air, which reduces drying time. Previous studies have investigated the effects of oven-drying, at different temperatures, on the nutritional properties of brown algae. The algae were dried at 45 °C (Kaehler & Kennish, 1996), 60 °C (Chan et al., 1997), and 105 °C (Robledo & Freile Pelegrín, 1997). Unlike oven-drying, freeze-drying minimises physical damage, oxidation, and thermal reactions and preserves the characteristic chemical compositions of the seaweed because in freeze-drying, the seaweed are frozen overnight at −80 °C then dried directly by sublimation (Wong & Cheung, 2001). In most of the previous studies on seaweed drying, one specific temperature for different species was used. In consequence, the effects of drying at various temperatures on seaweed metabolite concentrations remain unclear.
Several comprehensive metabolite profiling methods are available in analyzing metabolite species such as NMR and MS-based methods (Gupta et al., 2014; de Raad et al., 2016; Heyman & Dubery, 2016). NMR is a high-throughput method that identifies and quantifies metabolites without destroying them (Lin & Shapiro, 1997; Gupta et al., 2013). Nevertheless, NMR requires larger sample volumes than MS-based methods. In contrast, although MS-based methods work with relatively lower sample concentrations, the metabolites must first be extracted before analysis. Extraction is an essential step in MS analysis and must be performed swiftly in order to stop biochemical reactions in the tissues (Ernst et al., 2014). In previous studies of seaweed metabolite profiles by NMR and MS, the identification of particular groups like lipids and their derivatives was focused upon. These studies put emphasis on the stress-induced production of metabolites such as cyclosporine-like amino acids and halogenated compounds (Goulitquer et al., 2012; Gupta et al., 2014). However, the metabolite profiles of seaweed which are subjected to different drying and extraction treatments have not been comprehensively investigated.
Ordinarily, solvent extraction is used in MS analysis. It is vital, before conducting MS analysis, to optimise solvent selection in order to extract as many metabolites as possible. Unfortunately, no single solvent can extract all metabolites simultaneously. Often, a mixture of solvents is required to be able to extract all metabolites of interest (Ernst et al., 2014). In general, methanol or a solvent mixture containing it is used to
2. Drying and extraction effects on three edible brown algae for metabolomics
11
extract polar compounds. On the other hand, chloroform is used to extract lipophilic (non-polar) compounds and mixtures of polar and non-polar compounds (Van Hal et al., 2014). In this study, the effects of two extraction methods, methanol-water with and without chloroform, were compared to improve the understanding of the metabolite profiles of brown algae.
Comprehensive studies on the effects of drying and extraction on edible brown algae are limited (Buschmann et al., 2017). Therefore, water-soluble metabolite quantification with CE-MS and LC-MS, after freeze-drying or oven-drying at 40 °C or 80 °C, was thoroughly evaluated. Two extractions methods, namely, methanol-water with and without chloroform, were compared. The materials used consisted of Mozuku, Kombu, and Wakame. The multivalent and statistical analyzes derived from this study will increase the understanding of the effects of pre-treatment drying and extraction on metabolite concentration profiles in different brown algae species.
2.2Materials and methods
Three species of blanched brown algae, Cladosiphon okamuranus (Mozuku), Saccharina
japonica (Kombu) and Undaria pinnatifida (Wakame) were purchased at a local
supermarket in Tsuruoka City, Yamagata, Japan in December 2016 because they were abundant at the time this study was commencing. Those three species of seaweed were collected and shipped from Okinawa, Iwate, and Miyagi prefectures (Japan), respectively.
2.2.1 Sample drying
Wakame and Kombu samples were cut to a uniform size (~1 cm2). Mozuku samples were
more brittle than those of Wakame and Kombu and were divided into ~10 g lots. All samples were weighed on an analytical balance (AUW220D; Shimadzu Corp., Kyoto, Japan). They were then either dried or oven-dried, at 40 °C or 80 °C. For freeze-drying, the samples were initially frozen in liquid nitrogen and stored in a −80 °C freezer (MDF-U482-PJ, Panasonic Corp., Kadoma, Osaka, Japan) for 24 h. Before placing the samples in the freeze-dryer, its freeze-trap (Freeze Trap VA-800R, Taitec Corp., Saitama-ken, Japan) was set to −70 °C and <20 Pa. The samples were then moved into the freeze-dryer vessels and maintained at < −55 °C and <50 Pa with a vacuum pump (GLD-137CC
ULVAC, Taitec Corp., Saitama, Japan) for 72 h. The freeze-dryer pressure was then stabilized at <0.5 Pa. The samples were reweighed and stored in a freezer at −80 °C until extraction. The rest of the samples were dried in one of two separate ovens (Program Oven, Panasonic Corp., Kadoma, Osaka, Japan) for 48 h at 40 °C and 80 °C, respectively. After oven-drying, the samples were reweighed. The dry weight percentage of all dried seaweed samples was then calculated.
2.2.2 Chemicals and reagents
All reagents used in this study were either the analytical or the higher-grade types. Standard reagents were purchased and blended in-house for the quantification of each metabolite. To quantify the metabolites accurately, the following internal standards dissolved in methanol were used- Anion: 2-(N-morpholino) ethanesulfonic acid (MES) (No. 349-01623; Dojindo Laboratories, Kumamoto, Japan) and D-camphor-10-sulfonic
acid (CSA) (No. 037-01032; Wako Pure Chemical Industries, Ltd., Osaka, Japan); Cation: L-methionine sulfone (No. 502-76641; Wako Pure Chemical Industries, Ltd.,
Osaka, Japan); Sugar: 13C6-glucose (No. 404624; Sigma-Aldrich Corp., St. Louis, MO,
USA). All of these were prepared as 200 µM stock solutions. In order to correct the CE-MS migration times, 200 µM trimesate (No. 206-03641; Wako Pure Chemical Industries, Ltd., Osaka, Japan) and 3-aminopyrrolidine (No. 404624; Sigma Aldrich Corp., St. Louis, MO, USA) dissolved in Milli-Q water were used.
2.2.3 Sample extractions
Fifty milligram lots of the dried samples were collected in 13-mL disruption tubes and disrupted without solvent at 1,500 rpm for 60 s in a cell disruptor (Shake Master Neo, BMS, Tokyo, Japan) fitted with a 1 cm × 1 cm diameter metal cylinder. Three replicates of powdered samples were then weighed out (~5 mg each) for extraction purposes.
For the methanol-water with chloroform extraction method, the samples were mixed with 500 µL of 200 µM internal standards-methanol solution in a micro-mixer
2. Drying and extraction effects on three edible brown algae for metabolomics
13
(Micromixer E-36, Taitec Corp., Saitama, Japan) for 3 min to which 500 µL chloroform and 200 µL Milli-Q water was added (Wakayama et al., 2015).
For the methanol-water extraction method, the samples were added to 500 µL of 200 µM internal standards-methanol mixture and 500 µL of Milli-Q water (Wakayama
et al., 2010).
For both extraction methods, the samples were subjected to vortex for 3 min then centrifuged at 12,000 × g and 4 °C for 10 min in the MX-307 centrifuge (Tomy Seiko Co. Ltd., Tokyo, Japan). After centrifugation, 300 µL of the aqueous top layer was transferred to ultrafiltration tubes (MW 5000 kDa; HMT, Inc., Tsuruoka, Japan) and centrifuged at 4 °C and 9,100 × g for 3 h. Then 30 µL of the filtrate was transferred to the LC vial for sugar analysis and stored in a freezer at −80 °C. The remaining 100 µL of the filtrate was evaporated at 4 °C in a refrigerated spin dryer (CentriVap Concentrator, Labconco Corp., Kansas City, MO, USA). The evaporated samples were stored at −80 °C until the time for CE-MS analysis. In order to normalise CE-MS migration time, the samples were dissolved in 20 µL of 200 µM trimesate and 3-aminopyrrolidine in Milli-Q water. For the cationic and anionic metabolite determinations, 10 µL aliquots of the solution were transferred to CE-MS sample vials and subjected to CE-MS analyzes.
2.2.4 Quadrupole LC-MS/MS mass spectrometry conditions for free sugar analysis
LC-MS/MS measurements were performed with an Agilent 1100 series column oven (Agilent Technologies, Santa Clara, CA, USA), an LC binary pump, and an autosampler fitted with the API 3000 Quadrupole LC-MS/MS tandem mass spectrophotometer system (Sciex, Framingham, MA, USA). The sample solutions were separated in the HILIC amino column (Asahipak NH2P-4E; 4.6 mm inner diameter × 250 mm length; 5 µm; Showa Denko K.K., Tokyo, Japan). The initial mobile phase was 80 % acetonitrile and 20 % Milli-Q water, and the flow rate was 0.8 mL min−1. The acetonitrile gradient profile was 70 %, 60 %, and 80 % at 23 min, 35 min, and 40 min, respectively. The duration of each sample analysis was 40 min. The temperature of the column oven was set to 30 °C. One-microliter sample of aliquots was injected into the column. The nebuliser, curtain, and collision gas pressures, the ion spray voltage, and the ion source temperature were 15
psi, 11 psi, 8 psi, −4500 V, and 500 °C, respectively. Turbo-spray mode was selected. For MS analysis, the negative ion and MRM modes were selected.
2.2.5 Capillary electrophoresis-mass spectrometry (CE-MS) analysis of free amino acids, organic acids, and charged metabolites
All CE-MS analyzes were performed on an Agilent capillary electrophoresis system consisting of an Agilent G6220A LC-MSD TOF, an Agilent 1100 series isocratic HPLC pump, a G1603A Agilent CE-MS adapter kit, and a G1607A Agilent CE-ESI-MS sprayer kit (Agilent Technologies, Santa Clara, CA, USA).
2.2.6 Cationic metabolite analysis
Cationic metabolites like amino acids and amines were separated with fused-silica capillaries (50 µm inner diameter × 100 cm length) filled with 1 M formic acid as an electrolyte (Soga and Heiger, 1998). To stabilize ESI sprayer ionisation, a sheath liquid
(methanol-water (50 % v/v) containing 0.1 μM Hexakis(2,
2-difluoroethoxy)phosphazene was used. It was delivered at 10 μL min−1 via an isocratic
HPLC pump.
For each analysis, the sample solution was injected at 50 hPa for 5 s (3 nL) and 30 kV. The capillary temperature was maintained at 20 °C, and the temperature of the sample tray was kept at <5 °C. Time-of-flight mass spectrometry (TOF-MS) was conducted in the positive ion mode. The capillary, fragmentor, skimmer, and OCT RF voltages were set at 4,000 V, 75 V, 50 V, and 500 V, respectively. Ionisation was stabilized in MS by maintaining the drying nitrogen gas flow rate at 10 L min−1 and the heater temperature at 300 °C. The nebuliser gas pressure was set to 7 psi (48.2 kPa). Each acquired spectrum was automatically recalibrated with reference masses of sheath liquid
([2MeOH+H2O+H]+, m/z 66.06306) and protonated Hexakis ([M+H]+, m/z 622.02896).
2. Drying and extraction effects on three edible brown algae for metabolomics
15
2.2.7 Anionic metabolite analysis
Anionic metabolites like organic carboxylic acids and sugar phosphates were separated in a cationic polymer coated COSMO (+) capillary (50 µm i.d. × 105 cm lengths) (Nacalai Tesque, Kyoto, Japan) (Soga et al., 2009). The electrolyte used for CE separation was 50 mM ammonium acetate (pH 8.5). New capillaries were first flushed over a 10 min period with running electrolyte, then with 50 mM acetic acid (pH 3.4), and again with the electrolyte. The capillary temperature thermostat was set to 20 °C, and the sample tray was cooled to <5 °C. A mixture of 10 μL min−1 of 5 mM ammonium acetate in 50 % (v/v) methanol-water containing 0.1 μM Hexakis was delivered to the CE interface with an Agilent 1100 series isocratic pump fitted with a 1:100 ratio splitter. This mixture was used as a sheath liquid around the outside of the CE capillary to provide a stable electrical connection between the capillary tip and the grounded electrospray needle.
Sample solutions were injected at 50 hPa for 30 s (30 nL), and −30 kV was applied. Before each injection, the capillary was flushed with 50 mM acetic acid (pH 3.4) for 2 min then with running electrolytes for 5 min. The MS capillary voltage was set to −3,500 V and the fragmentor, skimmer, and Oct RF voltages were set to 100 V, 50 V, and 500 V, respectively. MS ionisation was stabilized by maintaining the drying nitrogen gas flow rate to 10 L min−1 and the heater temperature to 300°C. The nebuliser gas pressure was set to 7 psi (48.2 kPa). Each acquired spectrum was automatically recalibrated with reference masses ([13C isotopic ion of deprotonated acetic acid dimer (2CH
3COOH-H)]−,
m/z 120.03834) and ([Hexakis + deprotonated acetic acid (CH3COOH-H)]−, m/z
680.03554). Exact mass data were acquired at the rate of 1.5 spectra/second over a 50– 1,000 m/z range.
2.2.8 Metabolite peak and statistical analyzes
Raw data for sugars obtained from LC-MS/MS were analyzed with Analyst v. 1.4.2. Cationic and anionic metabolite data derived from CE-TOF-MS were collected using Agilent Mass Hunter v. B06.00 software. Metabolite peaks were analyzed in Masterhands
were then merged using an in-house macro program run in Microsoft Excel v. 2013 (Microsoft Corp, Redmond, WA, USA).
All metabolite concentrations were calculated by dry weight and were analyzed by JMP v. 13.2.1 (SAS Corp., Cary, NC, USA). Tukey-HSD analysis (Tables 2.2–2.4 and S2.10–S2.12), principal component analysis (PCA) (Figure 2.1 and S2.1), and hierarchical clustering analysis (HCA) (Figure 2.2) were performed on all data sets. HCA was performed using Ward’s methods (Murtagh & Legendre, 2014). Two-way clusterisation was performed on metabolite concentrations and sample conditions. To elucidate any trends in metabolite concentrations, HCA was performed according to species and PCA was performed according to species, drying method, and extraction method.
2. Drying and extraction effects on three edible brown algae for metabolomics
17
2.3 Results
2.3.1 Dry weight percentage
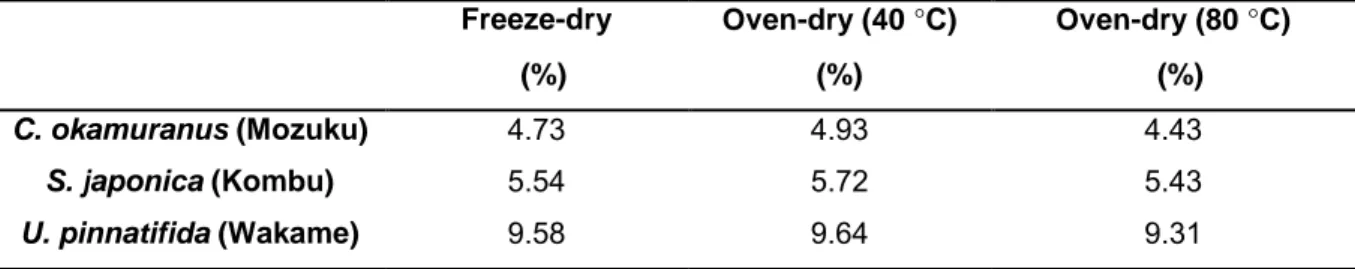
The dry weight percentage of Mozuku, Kombu, and Wakame were determined by freeze-drying and by oven-freeze-drying at 40 °C and 80 °C (Table 2.1). The order of the dry weight percentage was Wakame > Kombu > Mozuku (9 %, 5 %, and 4 %, respectively) and was the same for all three drying methods. The difference in dry weight percentage among the three drying methods was < 1 %.
Table 2.1 Dry weight percentage of the samples after being dried using different drying
methods.
Freeze-dry Oven-dry (40 °C) Oven-dry (80 °C)
(%) (%) (%)
C. okamuranus (Mozuku) 4.73 4.93 4.43
S. japonica (Kombu) 5.54 5.72 5.43
2. Drying and extraction effects on three edible brown algae for metabolomics
19
2.3.2 Metabolite profiles of the three brown algae species
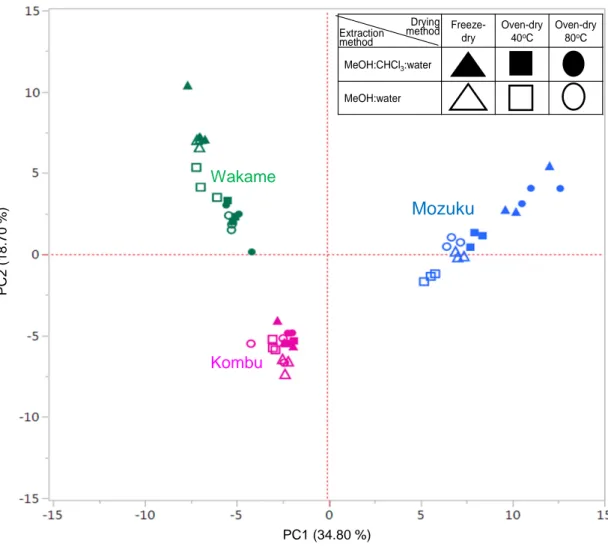
To identify any trends in metabolite composition, multivalent analyzes on all data sets were performed. The PCAs for the three dried and extracted brown algae revealed clear separations of the metabolite components. A variance of 34.8 % was observed in PC1 (Figures 2.1 and S2.1). The metabolite separations in PC1 were species-dependent. The Mozuku samples are located on the positive PC1 plots whereas the Kombu and Wakame samples are located on the negative PC1 plots. Positive PC1 loading plots for the Mozuku samples indicated high contribution rates of metabolites like 2-isopropylmalate, isethionate, and orotate (Figure 2.2, S2.1; Table S2.1). In contrast, negative PC1 loading plots indicated high contribution rates of metabolites like Asp, Glu, and Asn. PC2 represents the drying and extraction methods and revealed no clear separation variance among samples. PC3 revealed a separation between freeze-dried and oven-dried samples at a low 8.74 % variance (Figure S2.1; Table S2.1). PC4 represents separations of the extraction methods at a low variance of 6.21 % (Figure S2.1; Table S2.1). Similar trends were found in the PCA for the different drying methods (Figures S2.2–S2.4; Tables S2.2– S2.4) and for the extraction methods (Figures S2.5–S2.6; Tables S2.5–S2.6). Although the drying and extraction methods differed, the metabolite concentrations depended mainly on the brown algae species.
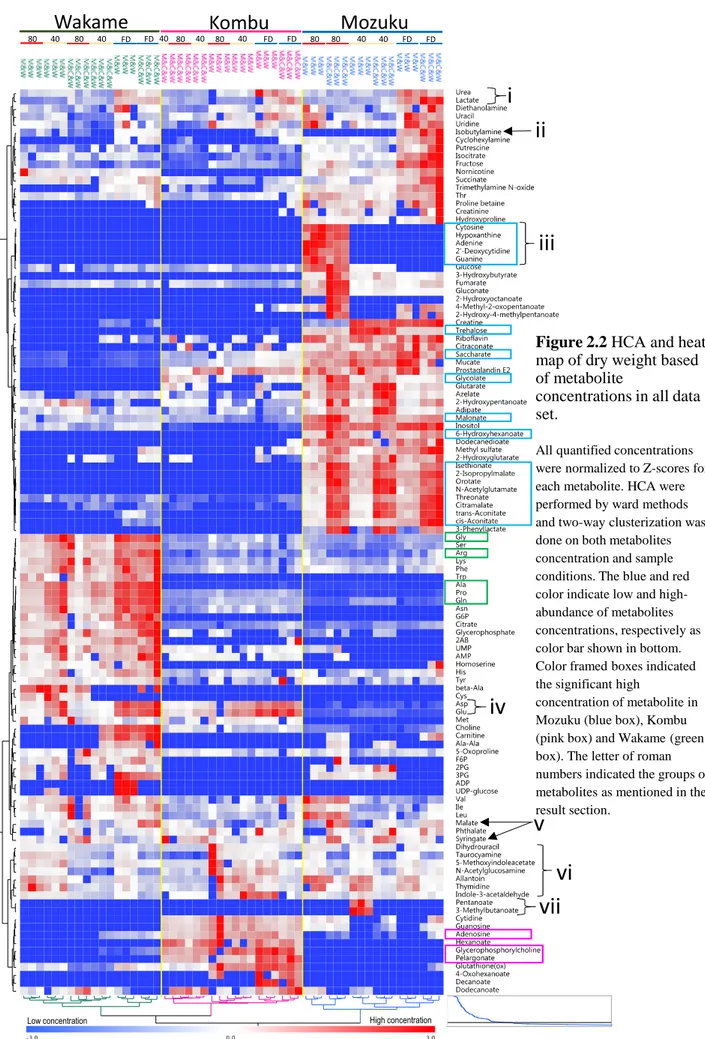
HCA was also performed on the dried and extracted seaweed. A total of 114 metabolites at various concentrations were detected and expressed as a heat map (Figure 2.2). The heat map shows that the relative metabolite distribution and clusterisation were based on metabolite concentrations whereas sample conditions were mainly species-dependent. HCA also demonstrated that Kombu and Wakame were clustered together and Mozuku was separated from them.
Drying methods also affected clusterisation; freeze-drying and oven-drying were clearly grouped. The extraction method using methanol-water with or without chloroform was the third clusterisation factor for seaweed species. More significant numbers of highly concentrated metabolites were found primarily in the Mozuku samples (100/114) followed by the Wakame (82/114) and Kombu (80/114) samples (Figures 2.2, 2.4, 2.5, 2.6; Tablesand Figures S2.10–S2.12).
Mozuku Kombu Wakame PC 2 (1 8 .7 0 % ) PC1 (34.80 %)
Figure 2.1 PCA score plot of metabolite concentrations in three brown algae after all drying and extractions methods.
The blue, pink, and green colored labels indicate Mozuku, Kombu, and Wakame, respectively. Filled and unfilled colors indicate the methanol-water extractions with chloroform or without chloroform, respectively. Triangle, square, and circle shapes indicate freeze-dry, oven-dry at 40°C, and oven-dry at 80°C, respectively. The horizontal axis value indicates PC1 separation variance and the vertical axis value indicates PC2 separation variance. Precise PCAs (PC1 to PC5) are shown in Figure S2.1. PCAs separation variances are shown in Table S2.1.
Freeze-dry Oven-dry 40oC Oven-dry 80oC MeOH:CHCl3:water MeOH:water Drying method Extraction method
Wakame
Kombu
Mozuku
Low concentration High concentration
80 40 FD FD 80 40 40 80 40 80 40 FD FD 80 80 40 40 FD FD
i
ii
iv
iii
vii
vi
v
Figure 2.2 HCA and heat map of dry weight based of metabolite
concentrations in all data set.
All quantified concentrations were normalized to Z-scores for each metabolite. HCA were performed by ward methods and two-way clusterization was done on both metabolites concentration and sample conditions. The blue and red color indicate low and high-abundance of metabolites concentrations, respectively as color bar shown in bottom. Color framed boxes indicated the significant high
concentration of metabolite in Mozuku (blue box), Kombu (pink box) and Wakame (green box). The letter of roman numbers indicated the groups of metabolites as mentioned in the result section.
2. Drying and extraction effects on three edible brown algae for metabolomics
2.3.3 Independent species multivariate analyzes
In order to examine the effects of drying and extraction on each species more closely, multivariate analyzes were performed using PCA (Figures 2.3 and S2.7–S2.9; Tables S2.7–S2.9) and HCA (Figures 2.4–2.6). For PCA, the separation variances of the extraction methods were located in PC1 for Mozuku and Kombu (Figures 2.3a–b) and in PC2 for Wakame (Figure 2.3c).
The results showed that methanol-water extractions with and without chloroform mainly affected the Mozuku and Kombu metabolites. Their PC1 separation variances were 27.7 % and 23.1 %, respectively (See PC1: Figures 2.3a–b and S2.7–S2.8). PC2 for Mozuku and Wakame showed that the separation variance was attributed to the drying methods (25.4 % and 18.7 %, respectively). The positive plots of both PC2 for Mozuku and Wakame were separated by freeze-drying whereas the negative plots were separated by oven-drying (See PC2: Figures 2.3a–b and S2.7–S2.8). Wakame showed a 35.6 % separation variance in PC1 which could be explained primarily by the drying method. The freeze-drying method is located on the positive PC1 whereas the oven-drying method is situated on the negative plot (See PC1: Figures 2.3c and S2.9). PC2 for Wakame indicated that the extraction methods accounted for the separation variances (See PC2: Figures 2.3c and S2.9).
HCA for each seaweed species showed similar tendencies in terms of metabolite concentrations. They were associated with different drying and extraction methods (Figures 2.4–2.6).
M e O H : W a te r e xt ra c t M e O H : C H C l3 : W a te r e xt ra c t P C 2 ( 1 9 .7 0 % ) PC1 (35.60 %)
c
W a k a m e 80 ºC 80 ºC 40 ºC 40 ºC FD FD K o m b u MeOH: Water extract MeOH: CHCl3: Water extract P C 2 ( 1 8 .7 0 % ) PC1 (23.10 %)b
FD FD 40 ºC 80 ºC 80 ºC 40 ºC Freeze-dry Oven-dry 40oC Oven-dry 80oC MeOH:CHCl3:water MeOH:water Drying method Extraction methodFigure 2.3 PCA score plot (PC1-PC2) of metabolites concentrations in three species, namely, a)
Mozuku, b) Kombu, and c) Wakame, respectively.
Dot line circles indicated the group of same conditions. Precise PCAs (PC1 to PC5) are shown in Figure S2.7 to S2.9. PCAs separation variances are shown in Table S2.7 to S2.9. FD 40 ºC 80 ºC PC1 (27.70 %)
a
MeOH: Waterextract MeOH: CHClextract 3: Water
M o z u k u P C 2 ( 2 5 .4 0 % ) FD 80 ºC 40 ºC
2. Drying and extraction effects on three edible brown algae for metabolomics
2.3.4 Characteristics of Mozuku
The overall heat map of the dried and extracted brown algae illustrated that Mozuku contained more metabolites than Kombu or Wakame (Figure 2.2). The following metabolites were found in significantly higher concentrations in Mozuku than in Kombu or Wakame: malanoate, isethionate, 6-hydroxyhexanoate, threonate, citramalate, orotate,
pelargonate, trans-aconitate, cis-aconitate, 2-isopropylmalate, N-acetylglutamate,
gluconate, saccharate, and trehalose (See blue box in Figure 2.2; Table S2.10). In contrast, the Asp content in Mozuku was significantly lower than it was in Kombu or Wakame according to Tukey’s HSD test (Table 2.2).
Drying method also affected the metabolite concentrations in Mozuku. High concentrations of urea, isobutylamine, lactate, isocitrate, cyclohexylamine, trimethylamine-N-oxide, fructose, putrescine, and inositol were detected in freeze-dried Mozuku (Figure 2.4i). On the other hand, only 2PG and Ala were found at high levels in oven-dried Mozuku (Figure 2.4v), which was extracted by either method. 3PG, Ala-Ala, syringate, glycerolphosphate, glutarate, adipate, and azelate were measured at high levels in oven-dried Mozuku extracted by methanol-chloroform-water (Figure 2.4vi). High
concentrations of Gln, Glu, and trehalose were found in Mozuku oven-dried at 40°C
(Figure 2.4iv). High levels of cytosine, hypoxanthine, glucose, Val, adenine, 2′-deoxycytidine, guanine, and Leu were detected in Mozuku oven-dried at 80°C (Figure 2.4viii). However, only low concentrations of creatine were noted in these samples (Figure 2.4iii). Glycolate, 3-hydroxybutyrate, fumarate, gluconate, 2-hydroxyoctanoate, malanoate, 5-oxoproline, 4-methyl-2-oxopentanoate, 2-hydroxy-4-methylpentanoate,
and 6-hydroxyhexanoate were found at high levels in Mozuku oven-dried at 80°C and
subjected to extraction with methanol-chloroform-water (Figure 2.4ix).
Extraction method also affected the metabolite concentrations in the Mozuku
samples. Gly, Ser, uracil, uridine, 5-methoxyindoleacetate, riboflavin, N
-acetylglucosamine, and dodecanedionate were detected at high levels in Mozuku samples subjected to extraction with methanol-water (Figure 2.4ii). Further, 2-hydroxypentanoate,
isethionate, 3-phenyllactate, malate, orotate, N-acetylglutamate, threonate,
2. Drying and extraction effects on three edible brown algae for metabolomics
25
were measured at high concentrations in Mozuku subjected to extraction with methanol-chloroform-water (Figure 2.4vii).
Mozuku
FD FD
80 40 FD 80 40 FD
Low concentration High concentration
i
v
iv
viii
iii
vii
ii
vi
ix
Figure 2.4 HCA and heat map of dry weight based of metabolite
concentrations in Mozuku samples.
The letter of roman numbers indicated the groups of metabolites as mentioned in the result section.
2. Drying and extraction effects on three edible brown algae for metabolomics
27
Table 2.2 Free amino acid concentrations in Mozuku samples after various drying and
extractions methods.
MeOH: CHCl3: H2O MeOH: H2O
Amino Acids Freeze-Dry Oven-Dry 40 °C Oven-Dry 80 °C Freeze-Dry Oven-Dry 40 °C Oven-Dry 80 °C
E s s e n tia ls Am in o Ac id s Histidine 9.81±4.91abc 3.61±1.87c 2.76±0.18c 6.11±0.67bc 6.23±1.78bc 8.14±1.68bc
Isoleucine 7.21±3.38abcd 3.92±2.09cd 10.50±0.64bcd 4.15±1.67d 3.25±0.74d 14.64±1.08abc
Leucine 8.89±1.48cd 6.51±2.46cd 22.63±2.11ab 3.78±0.20d 5.70±0.75cd 24.27±3.50a
Lysine 12.24±5.80bcd 7.44±3.46d 9.72±1.10bcd 9.18±2.80bcd 6.03±1.22d 11.47±4.37bcd
Methionine ND ND ND ND ND ND
Phenylalanine 10.60±3.72cdef 7.07±2.26def 8.65±1.07cdef 5.01±2.72f 6.13±1.08ef 12.21±2.04bcdef Threonine 87.13±20.56a 58.76±6.88abcde 74.85±8.34abc 76.09±1.81abc 60.90±7.28abcde 78.83±6.46ab
Tryptophan ND ND ND ND ND ND Valine 7.94±4.24d 9.20±4.11d 42.65±1.64ab 7.87±3.13d 15.68±3.43bcd 45.34±7.91a No n -E s s e n tia ls Am in o A c id s Alanine 52.26±19.42e 129.39±15.46e 122.06±11.77e 55.70±4.45e 140.99±21.58e 131.37±6.82e Arginine 9.96±5.84d 4.81±2.16d 3.91±0.39d 5.48±2.68d 3.50±0.51d 9.65±2.37d Asparagine ND ND ND ND ND ND Aspartate 26.98±9.73e 13.96±3.94e 29.94±19.76e 29.95±0.36e 28.13±4.88e ND Cysteine ND ND ND ND ND ND
Glutamine 14.06±5.73ghi 40.69±2.89efhgh 9.39±0.78hi 12.51±2.45i 40.56±3.79efgh 13.04±2.46ghi
Glutamate 43.02±6.67f 154.93±7.30f 74.70±7.90f 37.57±2.76f 162.30±6.86f 67.33±3.10f Glycine 31.95±1.55d 17.48±3.77d 26.10±1.26d 38.85±3.84d 30.72±10.63d 38.02±5.25d Proline 13.69±7.71fg 9.08±1.74g 5.75±0.94g 8.83±1.39g 12.36±2.37fg 9.79±4.78g Serine 24.04±5.14c 11.62±1.93c 14.73±3.22c 27.16±9.87c 19.35±10.48c 28.32±6.14c Tyrosine 10.23±6.76ab 6.90±2.68ab 6.59±1.31ab 6.13±2.92ab 4.78±0.93ab 12.44±0.94ab Total Free Amino Acids 370.01 ± 112.64 485.36 ± 65.02 464.94 ± 62.42 334.37 ± 43.73 546.62 ± 78.34 504.86 ± 58.89
The values indicate as mean ±SD (nmol g-1) of dry weight (n = 3). ND, not detected. Different character indicates the significant differences (P<0.05) between each type of sample by Tukey-HSD analysis. Statistical analysis were compared between all data set (species and treatments (Table 2.2–2.4)).
2.3.5 Characteristics of Kombu
Kombu contained significantly higher concentrations of glycerophosphorylcholine, adenosine, and pelargonate (See pink box in Figure 2.2; Table S2.11) than Mozuku and Wakame. Urea, pelargonate, decanoate (Figure 2.5i), Asp, Glu, and glycerophosphorylcholine (Figure 2.5ii) were detected at significantly higher concentrations in freeze-dried Kombu than they were in oven-dried Kombu (Tables 2.3 and S2.11).
High concentrations of dihydrouracil, indole-3-acetaldehyde, taurocyamine, N -acetylglucosamine, 5-methylindolacetate, thymidine, allantoin, nornicotine, Gly, Lys, Ser, Ile, Leu, His, Phe, Met, Asn, Thr, putrescine, glucose, fructose, uridine, cytidine, guanosine, adenosine, prostaglandin E2, and isocitrate were detected in methanol-water-extracted Kombu (Figure 2.5iv). In contrast, methanol-chloroform-water extraction yielded high levels of glycolate, 2-hydroxypentanoate, malanoate, threonate, syringate, succinate, and UMP (Figure 2.5iii).
Kombu
FD FD
80 40 FD 80 40 FD
Low concentration High concentration
i
ii
iv
iii
Figure 2.5 HCA and heat map of dry weight based of metabolite concentrations in Kombu samples.
The letter of roman numbers indicated the groups of
metabolites as mentioned in the result section.
2. Drying and extraction effects on three edible brown algae for metabolomics
Table 2.3 Free amino acid concentrations in Kombu samples after various drying and
extractions methods.
MeOH: CHCl3: H2O MeOH: H2O
Amino Acids Freeze-Dry Oven-Dry 40 °C Oven-Dry 80 °C Freeze-Dry Oven-Dry 40 °C Oven-Dry 80 °C
E s s e n tia ls Am in o Ac id s
Histidine 6.23±1.41c 3.41±1.17c 3.94±0.56c 4.58±0.06c 7.01±1.99abc 7.08±3.23abc
Isoleucine 8.44±3.06abcd 4.76±1.28abcd 4.08±0.57bcd 5.80±0.82abcd 7.13±1.10abcd 6.45±1.87abcd
Leucine 7.51±4.12cd 3.79±1.69d 3.79±0.32d 4.68±1.42cd 5.93±1.02cd 6.80±3.34cd
Lysine 8.22±5.02d 5.00±1.44d 4.56±0.99d 7.79±2.81d 7.95±2.26cd 9.65±2.84bcd
Methionine 1.07±0.33ab 1.49±0.47ab 0.57±0.52ab 1.01±0.12ab 1.53±0.12ab 1.50±0.70ab
Phenylalanine 6.95±2.33f 4.21±1.64f 4.43±0.38f 5.42±0.82f 7.15±1.71def 8.67±2.02cdef
Threonine 42.16±0.27ef 32.64±3.23def 20.68±1.76f 44.56±3.99cdef 41.84±8.32def 23.88±6.70f
Tryptophan ND ND ND ND ND ND Valine 170.72±102.80abcd 90.37±11.41cd 85.18±6.27cd 108.53±13.07cd 109.88±3.96bcd 116.85±33.62d No n -E s s e n tia ls Am in o A c id s Alanine 170.72±102.80e 90.37±11.41e 85.18±6.27e 108.53±13.07e 109.88±3.96e 116.85±33.62e Arginine 5.65±1.40d 5.05±1.29d 3.23±1.09d 4.97±1.88d 5.98±3.01d 5.26±1.33d Asparagine 27.16±4.84de 18.13±3.35de 12.93±4.77de 27.79±11.41de 38.08±16.08cd 41.16±15.11cd Aspartate 357.42±30.46ab 238.91±10.35bcd 212.64±9.45cd 365.37±22.32ab 321.62±1.75abc 281.63±3.32d Cysteine ND ND ND ND ND ND
Glutamine 42.94±3.00efg 30.47±2.91efghi 26.01±0.96fghi 51.26±5.04ef 48.86±3.84ef 60.14±9.95e Glutamate 1134.16±96.30ab 835.96±46.29abcde 724.10±27.91bcde 1198.06±68.02a 1023.43±32.47abcd 913.43±29.98de
Glycine 47.46±12.71d 24.99±1.32d 26.06±5.62d 50.48±20.39d 47.71±3.94d 48.37±23.70d
Proline 71.31±17.92e 56.89±4.87efg 49.12±3.06efg 71.15±4.66e 62.24±1.66ef 68.48±20.16e
Serine 101.21±109.70c 20.81±6.08c 27.24±1.14c 28.72±9.98c 36.64±15.94bc 35.31±9.90bc
Tyrosine 32.43±16.91ab 3.11±0.31b 4.39±0.38ab 6.48±1.98ab 6.15±1.81ab 14.39±0.65ab
Total Free
Amino Acids 2033.26 ± 331.47 1393.46 ± 102.61 1223.55 ± 68.33 1997.43 ± 175.04 1802.78 ± 102.22 1666.37 ± 181.82
The values indicate as mean ±SD (nmol g-1) of dry weight (n = 3). ND, not detected. Different character indicates the significant differences (P < 0.05) between each type of sample by Tukey-HSD analysis. Statistical analysis was compared between all data set (species and treatments (Table 2.2–2.4)).
2. Drying and extraction effects on three edible brown algae for metabolomics
31
2.3.6 Characteristics of Wakame
Wakame contained Gly, Pro, Arg, Ala, and Gln at significantly higher concentrations than Mozuku and Kombu (See green box in Figure 2.2; Table 2.4). All amino acids except for Met and Cys were detected in freeze-dried Wakame samples. Met was found in all oven-dried Wakame sample, but Cys was detected only in Wakame oven-dried at 80 °C and subjected to extraction with methanol-chloroform-water (Figures 2.2 and 2.6; Table 2.4). Relatively higher concentrations of urea, lactate, trans-aconitate, cis-aconitate, Trp, azelate, trimethylamine-N-oxide, adenosine, choline, carnitine, Ala-Ala, creatine, isobutylamine, citrate, cyclohexylamine, Thr, Arg, malate, and homoserine were measured in freeze-dried Wakame than in oven-dried Wakame (Figure 2.6i).
Comparatively higher levels of ADP-glucose and UDP-glucose were found in freeze-dried Wakame extracted by methanol-water (Figure 2.6iii). In contrast, proline betaine, glycerophosphorylcholine, and methyl sulfate were detected at relatively higher concentrations in freeze-dried Wakame subjected to extraction with methanol-chloroform-water (Figure 2.6ii). Methanol-water also extracted high concentrations of
dihydrouracil, indole-3-acetaldehyde, taurocyamine, N-acetylglucosamine,
5-methylindolacetate, thymidine, allantoin, and nornicotine (Figure 2.6v) whereas chloroform-water extracted high levels of citramalate and 2-hydroxyglutarate (Figure 2. 6iv).
Wakame
FD FD
80 40 80 40 FD FD
Low concentration High concentration
i
ii
iii
iv
v
Figure 2.6 HCA and heat map of dry weight based of metabolite concentrations in Wakame samples.
The letter of roman numbers indicated the groups of
metabolites as mentioned in the result section.
2. Drying and extraction effects on three edible brown algae for metabolomics
33
Table 2.4 Free amino acid concentrations in Wakame samples after various drying and
extractions methods.
MeOH: CHCl3: H2O MeOH: H2O
Amino Acids Freeze-Dry Oven-Dry 40 °C Oven-Dry 80 °C Freeze-Dry Oven-Dry 40 °C Oven-Dry 80 °C
E s s e n tia ls Am in o Ac id s
Histidine 6.23±1.41c 3.41±1.17c 3.94±0.56c 4.58±0.06c 7.01±1.99abc 7.08±3.23abc
Isoleucine 8.44±3.06abcd 4.76±1.28abcd 4.08±0.57bcd 5.80±0.82abcd 7.13±1.10abcd 6.45±1.87abcd
Leucine 7.51±4.12cd 3.79±1.69d 3.79±0.32d 4.68±1.42cd 5.93±1.02cd 6.80±3.34cd
Lysine 8.22±5.02d 5.00±1.44d 4.56±0.99d 7.79±2.81d 7.95±2.26cd 9.65±2.84bcd
Methionine 1.07±0.33ab 1.49±0.47ab 0.57±0.52ab 1.01±0.12ab 1.53±0.12ab 1.50±0.70ab
Phenylalanine 6.95±2.33f 4.21±1.64f 4.43±0.38f 5.42±0.82f 7.15±1.71def 8.67±2.02cdef
Threonine 42.16±0.27ef 32.64±3.23def 20.68±1.76f 44.56±3.99cdef 41.84±8.32def 23.88±6.70f
Tryptophan ND ND ND ND ND ND Valine 170.72±102.80abcd 90.37±11.41cd 85.18±6.27cd 108.53±13.07cd 109.88±3.96bcd 116.85±33.62d No n -E s s e n tia ls Am in o A c id s Alanine 170.72±102.80e 90.37±11.41e 85.18±6.27e 108.53±13.07e 109.88±3.96e 116.85±33.62e Arginine 5.65±1.40d 5.05±1.29d 3.23±1.09d 4.97±1.88d 5.98±3.01d 5.26±1.33d Asparagine 27.16±4.84de 18.13±3.35de 12.93±4.77de 27.79±11.41de 38.08±16.08cd 41.16±15.11cd Aspartate 357.42±30.46ab 238.91±10.35bcd 212.64±9.45cd 365.37±22.32ab 321.62±1.75abc 281.63±3.32d Cysteine ND ND ND ND ND ND
Glutamine 42.94±3.00efg 30.47±2.91efghi 26.01±0.96fghi 51.26±5.04ef 48.86±3.84ef 60.14±9.95e
Glutamate 1134.16±96.30ab 835.96±46.29abcde 724.10±27.91bcde 1198.06±68.02a 1023.43±32.47abcd 913.43±29.98de
Glycine 47.46±12.71d 24.99±1.32d 26.06±5.62d 50.48±20.39d 47.71±3.94d 48.37±23.70d
Proline 71.31±17.92e 56.89±4.87efg 49.12±3.06efg 71.15±4.66e 62.24±1.66ef 68.48±20.16e
Serine 101.21±109.70c 20.81±6.08c 27.24±1.14c 28.72±9.98c 36.64±15.94bc 35.31±9.90bc Tyrosine 32.43±16.91ab 3.11±0.31b 4.39±0.38ab 6.48±1.98ab 6.15±1.81ab 14.39±0.65ab Total Free Amino Acids 2033.26 ± 331.47 1393.46 ± 102.61 1223.55 ± 68.33 1997.43 ± 175.04 1802.78 ± 102.22 1666.37 ± 181.82
The values indicate as mean ±SD (nmol g-1) of dry weight (n = 3). ND, not detected. Different character indicates the significant differences (P < 0.05) between each type of sample by Tukey-HSD analysis. Statistical analysis was compared between all data set (species and treatments (Table 2.2–2.4)).
2.3.7 Effects of drying on metabolite concentration
Freeze-drying and oven-drying at 40 °C and 80 °C were compared for all three brown algae species. The characteristics of the metabolite profiles differed with species. The drying methods also contributed to the variation in metabolite concentrations (Figure 2.2). HCA heat map showed that freeze-dried seaweed yielded the highest metabolite concentrations. For example, urea and lactate were detected at higher concentrations in freeze-dried samples of all three species than the oven-dried samples (Figure 2.2i). Asp and Glu were detected at higher concentrations in freeze-dried Kombu and Wakame than in freeze-dried Mozuku (Figure 2.2iv). Isobutylamine was measured at a high concentration only in freeze-dried Mozuku (Figure 2.2ii). However, other metabolites were only found in oven-dried samples. Cytosine, hypoxanthine, adenine, 2′-deoxycytidine, and guanine were only detected in Mozuku oven-dried at 80 °C (Figure 2.2iii) whereas pentanoate and 3-methylbutanoate were only found in Mozuku oven-dried at 40 °C (Figure 2.2vii).
2.3.8 Effects of extraction solvent on metabolite concentration
In this study, extraction was performed with water and with methanol-chloroform-water. HCA heat map shows that dihydrouracil, taurocyamine,
5-methoxyindoleacetate, N-acetylglucosamine, allantoin, thymidine, and
indole-3-acetaldehyde (Figure 2.2vi) were detected at high concentrations in the methanol-water extracts of all three seaweed species. On the other hand, only malate and syringate were detected at high concentrations in the methanol-chloroform-water extracts of the three seaweed species (Figure 2.2v).
Metabolite extraction efficiency was correlated mainly with seaweed species rather than extraction method. Many metabolites at high concentrations were detected in methanol-water extracted from Kombu and Wakame (Figures 2.2, 2.5, and 2.6). For Mozuku, however, high levels of these metabolites were only found in the methanol-chloroform-water extracts (Figures 2.2 and 2.4).