http://mssanz.org.au/modsim09
WTDISP – Adapting a Lagrangian ground sprayer
model using wind tunnel data
Connell, R.J. 1, A. Hewitt 1, T. Wolf 2, and P.C.H. Miller 3 1Lincoln Ventures Ltd, PO Box 133, Lincoln, Christchurch 7640, New Zealand 2Agriculture & Agri-Food Canada, Saskatoon Research Centre, Saskatoon, SK., Canada 3Silsoe Spray Applications Unit, The Arable Group, Wrest Park, Silsoe, Bedford, MK45 4HP,
United Kingdom Email: [email protected]
The ground boom model (AGriculture DISPersion) or AGDISP calculates the deposition of agrichemicals both in the area sprayed and more importantly downwind on neighbouring properties. However modelling the breakup and evaporation of the spray droplet cloud over the first few metres is very difficult. Wind Tunnel Dispersion or WTDISP arose to overcome this difficulty. Measurements of droplet spectra and fluxes were made 2 m downwind of several nozzles in a wind tunnel. WTDISP originated as this source was input into the frame work of the ground boom model AGDISP. AGDISP calculates the deposition by ensemble averaging the droplet paths to the ground and uses a statistical distribution of the likely paths about these averages to calculate the deposition on the ground.
The nozzles selected for the wind tunnel were those used in the field study trials undertaken by Wolf and Caldwell (2001) so that WTDISP could be used with this study as a basis for comparison with AGDISP. Measurements were undertaken at 4.5 m/s wind speed, at 0.1 m vertical intervals from 0.1 m to 0.6 m and at 0.08 m horizontal intervals from the centre of the nozzle at each vertical level, (Hewitt, 2008).
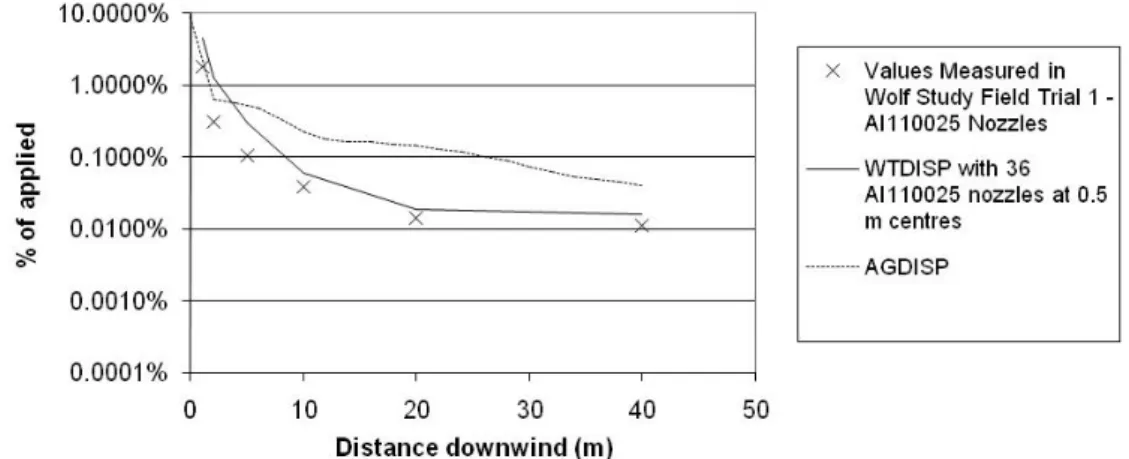
The analysis calculated the total flux at each level, together with the droplet spectra, to input into WTDISP in order to calculate the deposition downwind for one nozzle. This flux was matched to the field situation to give the deposition. Figure 1 shows the result for the first trial of the Wolf & Caldwell (2001) data.
Figure 1. Comparison of WTDISP, AGDisp and field measurements for Trial 1, Wolf and Caldwell (2001).
The results show a considerable improvement for WTDISP over AGDISP for this trial. Overall the 5 trials analysed, WTDISP comparison with field measurements halved the difference between (and also the standard deviation) of the modelled/measured ratio.
The paper below also outlines possible ways to improve the technique to model field and wind tunnel measurements, including turbulence scaling effects, the orientation of the nozzle fan to the wind direction and field measurements. It also discusses the drop size distribution from both models at 2 m downwind leading to improvements to the evaporation/breakup algorithms used in AGDISP and gives recommendations for experiments to improve the model results.
1. INTRODUCTION
Application of agrichemicals can create unacceptable environmental situations due to spray drift onto neighbouring properties and water bodies. There are several ground boom models being developed however these are subject to considerable differences between experimental field measurements and model calculations. In addition, field measurements are subject to considerable variation due to the turbulent process taking place in the atmospheric boundary layer. The model AGDISP (Bilanin et al., 1989) was developed and the ground boom model has been calibrated upon field data from the Spray Drift Task Force, USA, (Teske et al. 2004). However AGDISP generally over predicts results (Teske & Thistle, 2008) compared to Canadian (Wolf & Caldwell, 2001) and New Zealand (Woodward et al., 2008) field data.
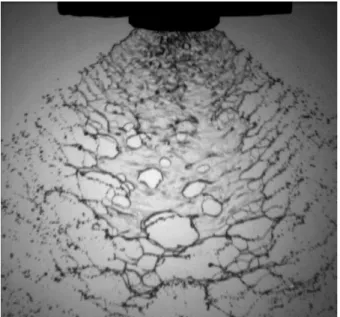
WTDISP was developed from a desire to improve ground boom models as it is difficult to measure the properties of the spray close to the nozzle (Figure 2). Measuring the droplet spectrum can be challenging and the breakup of the sheet of spray from the nozzle is also a difficult problem to model. Even today there is no officially adopted standard to measure the spray spectrum and flux. It is difficult to define where the droplets should be measured with the many situations that are encountered.
Hewitt (2008) measured the droplet spectra and fluxes 2 m downwind of the nozzle in a wind tunnel with wind velocity of 4.5 m/s. WTDISP uses AGDISP algorithms from this point.
Measurements were done for the formulation and nozzles of the field study undertaken in Canada in 2000 (Wolf & Caldwell, 2001). Standard drop size measurements, using a Malvern and PDPA, were also done for input into AGDISP.
This paper outlines the methodology used in the analysis and possible ways to improve the models and measurements.
2. ANALYSIS METHODOLOGY
The following methodology used mass conservation to enable the wind tunnel setup to be compared with the field situation. It is not straight forward as there are differences between these two situations, therefore it is
necessary to explain these differences so that points raised in the discussion, which give directions for future work, become clear.
The wind tunnel measurements of droplet spectrum and flux were done using an Oxford Laser imaging system (Oxford Laser, 2009) with a minimum particle size of about 10 µm. The nozzle was stationary with the spray fan at right angles to the wind direction to simulate the forward movement of the sprayer. This situation differs from the field as the nozzles are moving on a boom behind a tractor with the wind direction often parallel to the orientation of the spray fan. In addition the wind tunnel had a nominally uniform velocity profile across the working section whereas in the field there would usually be a logarithmic profile.
The following methodology assumes that the flux measured in the wind tunnel over a certain period of time is distributed in the field along the path taken by the sprayer for the same period of time. Both AGDISP and WTDISP are used in the two dimensional sense (vertical and horizontal) calculating the spray flux in the air and spray deposition perpendicular to an infinite line in the direction that the sprayer is moving.
The flux inputs to WTDISP were measured 2 m downwind of the nozzle in units of µl/cm2/s and were done at intervals of 0.1 m from 0.1 m to 0.6 m in the vertical and at each of these verticals at 0.08 m intervals horizontally from the centre that was straight downwind of the nozzle. (See the first seven columns of Table 1). WTDISP fluxes are inputted at each height, (Hewitt, 2008). Therefore the first step to obtain the fluxes for WTDISP, was to integrate the total measured flux at each horizontal position for a given vertical height needed over the width of the spray cloud (column 8 of table 1).
Figure 2: Spray ejecting from a flat fan nozzle. (Photo: A
The second step reconciles these measurements with the field situation. WTDISP uses inputs of l/cm2/min at each height together with a spray time period, so the flux is reduced to l/cm2. To compare this with the field data the actual flux l/cm2 for the field situation needed to be input into the model. The driving speed in trial 1 was 3.58 m/s which means the fluxes in column 8 of Table 1 (in µl/cm/s) are distributed over 3.58 m. This gave the result for column 9 of Table 1 (in l/cm2).
At present, WTDISP calculates the deposition for one nozzle only. Therefore to evaluate the deposition for the Canadian trials the results from WTDISP were added together for all 36 nozzles also making allowance for the 0.5 m distance between each nozzle.
3. RESULTS
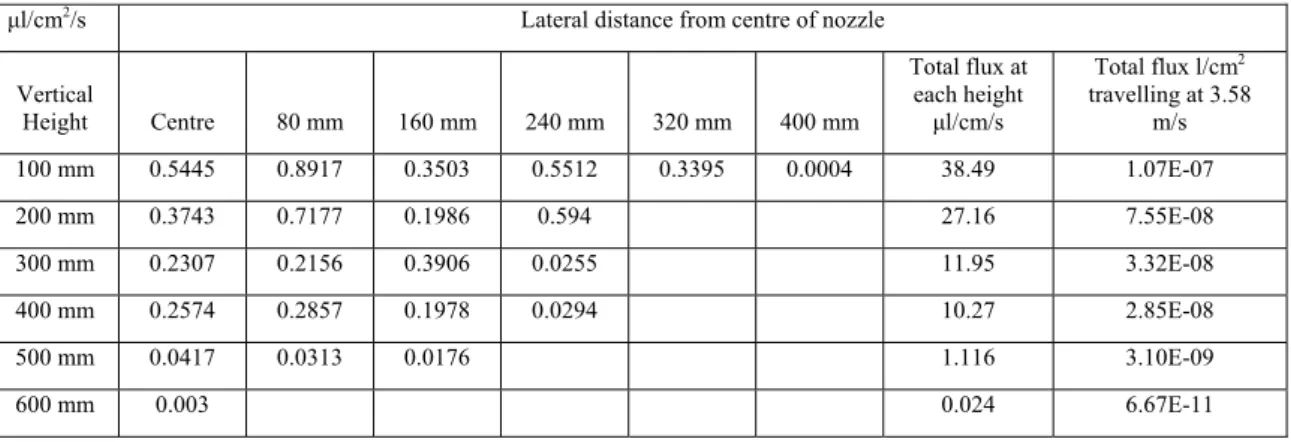
Measurements of flux of the AI110025 nozzle taken in the Silsoe wind tunnel are shown in Table 1. Measurements were taken over a grid (both vertical and laterally) 2 m directly downwind of the nozzle. The last two columns, show i) column 8, the results of total flux for each height from the wind tunnel measurements and ii) Column 9, the total flux for the field situation using the logic explained in the methodology.
Table 1. Flux measurements in Wind Tunnel 2 m downwind of the AI110025VS nozzle at 3.96 bar.
μl/cm2/s Lateral distance from centre of nozzle
Vertical Height Centre 80 mm 160 mm 240 mm 320 mm 400 mm Total flux at each height μl/cm/s Total flux l/cm2 travelling at 3.58 m/s 100 mm 0.5445 0.8917 0.3503 0.5512 0.3395 0.0004 38.49 1.07E-07 200 mm 0.3743 0.7177 0.1986 0.594 27.16 7.55E-08 300 mm 0.2307 0.2156 0.3906 0.0255 11.95 3.32E-08 400 mm 0.2574 0.2857 0.1978 0.0294 10.27 2.85E-08 500 mm 0.0417 0.0313 0.0176 1.116 3.10E-09 600 mm 0.003 0.024 6.67E-11
The values of flux from the last column were input into WTDISP and the model run using a spray interval of 60 seconds. The results for trial 1 are shown in Figure 1.
The analysis only compared 5 of the 21 trials (for 1 of the 4 nozzles) of the Canadian data, as wind tunnel measurements were not undertaken for one of the nozzles and measurements of two nozzles were not undertaken at the field spraying height. The overall results show there is a considerable improvement in the ratio model/measured. These are summarised in Table 2. The improvements are in both ratio and the ratios standard deviation and range.
Table 2. WTDISP and AGDISP Average values, Standard Deviation and Max/Min of the ratio model/measured for the AI110025 nozzles
AI110025 nozzles
WTDISP - mean 2.03 StDev 1.87 max 8.92 min 0.13
AGDISP - mean 3.95 StDev 3.60 max 12.94 min 0.43
A comparison for the 5 trials of the calculated vs. measured for WTDISP is shown in Figure 3.
Figure 4 shows the AGDISP results for the 5 trials. In (Teske & Thistle, 2008), the same plot is given, but for all 21 trials. The results still have the same overall shape but at a more steeper slope with a better fit at lower deposition rates and overestimating at higher deposition rates, which is closer to the points of Figure 3. The adjustment for the AI nozzles was undertaken by changing the factor in the formula for the jet effect from the nozzle which entrains smaller droplets.
The formula is K δ 2 2 jet h h L U 0.88 = v ,
where vh is the velocity of the jet at distance h below the nozzle, Ujet is derived from Bernoulli’s law (equating static and dynamic pressures) and L (= 0.14 m) is the coherent length of the liquid sheet. For the AI nozzles the value of the exponent
2K
2
δ was altered from 0.57 to 2.04. This means the droplets in the AI nozzles reduce speed at a greater rate. The reasons for the change in the coefficient value were not given.
A comparison of Figures 3 and 4 shows that WTDISP has considerably reduced the scatter of the results with a better fit over the whole range compared to the AGDISP comparison that has a better fit at high deposition rates (or close to the application area) but over estimates at low deposition areas (further away from the application area).
4. DISCUSSION
The main reason why WTDISP improved the results compared to AGDISP was that AGDISP under predicted the droplet size distribution at 2 m. This and other factors that may be of importance to improve the models are discussed below.
4.1. Orientation of Nozzle and forward sprayer speed
The spray fan from the nozzle in the wind tunnel is orientated at right angles to the wind direction. This simulates the forward speed of the sprayer but is different to the field situation. In the field, the nozzle orientation generally varies between about 70 degrees from the wind direction when the speed of the wind is about twice the forward sprayer speed, to 20 degrees from the wind direction if the forward sprayer speed is twice the wind speed. The change in orientation may change the drop size distribution and fluxes, therefore the results will have errors because of this factor. Further experimental work in the wind tunnel will be able to show whether changing the wind angle is significant.
The forward sprayer speed, which changes the orientation, also changes the drift (Miller and Smith, 1997) and (van de Zande et al. 2005). It is likely that the drift is increased due to turbulence effects from the spraying equipment and vehicle. To assess these effects from these field studies requires computational fluid dynamic (CFD) modelling to enable effect of the forward speed of the sprayer to be implemented in a model.
4.2. Droplet size Spectra
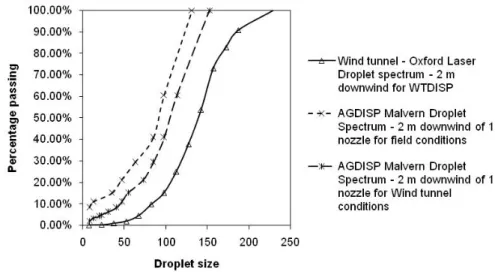
The most important aspect of the difference between the results of the WTDISP and AGDISP models was the difference in the droplet size spectrum calculated by AGDISP. Figure 5 shows that, at 2 m downwind of 1 nozzle (using the same conditions as the wind tunnel, about 23 C and 80 % humidity and 4.5 m/s), AGDISP predicts smaller droplets than measured in the wind tunnel.
Figure 3. Comparison of modelled deposition verses field deposition
for the WTDISP results with the Wolf experimental data (5 trials) (Solid line is modelled = Field and dashed lines are model = 10 times field and vice versa).
Figure 4. Comparison of modelled verses field for the AGDISP results
Figure 5: Field Trial 1, AI110025 nozzle droplet spectrum at 2 m downwind i) Wind tunnel ii) AGDISP
field conditions iii) AGDISP wind tunnel conditions. Initial Droplet Spectrum Dv0.5 = 583 µm, Dv0.1 = 275 µm and Dv0.9 = 983 µm at 396 KPa (percentage passing is percentage of droplets smaller).
This effect occurred for all three nozzles (that had wind tunnel measurements) of the four nozzles. Therefore AGDISP overestimates the change in droplet size that occurs. Evaporation is the only factor in the model that can change the droplet sizes. However it is possible that other processes are occurring in this area that is less than 2 m from the nozzle. These effects lead to the development of WTDISP. Further work is necessary in this area to measure droplet spectra over a range of humiditys and distances and also forward sprayer speeds so the evaporation algorithm in AGDISP ground boom module can be improved in the area less than 2 m from the nozzle. Figure 5 also shows that the field conditions reduce the size of the droplets from the wind tunnel conditions. Therefore wind tunnel measurements in lower humidity conditions would be useful. Measurements at different wind speeds would also be useful to improve the model.
4.3. Turbulence Scaling Effects
The structure of the air flow in a wind tunnel is laminar up to a Reynolds Number of 5 x 10⁵. In this case the Reynolds Number was 5.7 x 10⁵ which means the air flow would be slightly turbulent with a turbulence intensity of probably about 0.01 compared to a typical value between 0.1 and 0.2 in an atmospheric boundary layer.
The air flow in the field is fully turbulent as the Reynolds number of the boundary layer is in the order of 107 to 108. In air such boundary layers turbulent structures occur. These are known as sweeps and bursts and Hogstrom and Bergstrom (1996) show that sweeps and bursts occur about 30 % of the time each, with 40 % of the time with no organized structure. For their grass site (5 cm in height, which is closest to the Canadian experimental conditions) a burst would take about 4 seconds, at an angle of 20 degrees and extend up to 20 m in height. A sweep would occur for a similar length of time. This means that compared to the wind tunnel, during a burst the spray particles will be thrust into the atmosphere and during a sweep swept towards the ground. Therefore the expected fluctuations in deposition and also spray flux measured in the field would be greater than compared to the wind tunnel.
However as the measurements in the wind tunnel are only 2 m downwind of the nozzle, this effect could be small as the AGDISP algorithm allows for typical atmospheric turbulence downwind of this point. This effect could be investigated with CFD modelling.
4.4. Field Measurements verses increase in wind velocity
Detailed inspection of the field data shows that in almost all the trials the deposition drops off with increase in wind speeds above 25 kph as shown in Figure 6. (We are not sure what caused the drop from 15 to 15 kph but this did not show up in other trials). This is contrary to the results from the models that show the deposition will increase with increase of wind speed as shown in Figure 7, especially at higher wind speeds.
The ratios of modelled to measured are generally less than five for wind speeds of less than 25 kph but are about 10 to 15 for wind speed greater than this.
There are several possibilities for this occurrence. Firstly the stability of the air could be a factor. With unstable air the turbulence is
increased, leading to greater dispersion (dilution) of the spray cloud. As a result more particles could be uplifted to deposit further downwind outside the range measured. Analysis shows that the stability ratio generally changed from about -0.5 to -0.7 or unstable at low wind speeds to -0.1 or close to neutral for higher wind speeds.
This means that there was less thermal turbulence with increase in wind speed and therefore this effect is not the reason for the drop off in deposition at higher wind speeds. However with higher wind speeds the mechanical turbulence would increase, causing the drop off in deposition. This could be investigated with CFD modelling.
The second possibility is that the efficiency of the ground deposition collectors, in this case 15 cm diameter Petri plates, decrease in winds over 20 to 25 km/h. Detailed CFD analysis work taking into consideration the surface of the ground would be needed in this case. Also
analysis of the data with other ground boom spray drift models would be useful.
4.5. WTDISP results with adjustment for height using AGDISP
The wind tunnel test runs for two of the other nozzles, the TT11005 and AI11004 nozzles could not be used as they were undertaken at 600 mm instead of the field spraying height of 900mm. Therefore the results for these nozzles were adjusted from 600 mm to 900 mm using AGDISP to estimate how WTDISP would predict the deposition. The results are shown in Table 3.
Table 3. WTDISP and AGDISP: Ratio model/measured for the TT11005 nozzles and the AI11004 nozzles, average values, standard deviation, and maximum and minimum.
TT11005 nozzles
mean StDev max Min
WTDISP - 9.69 7.85 32.46 2.20
AGDISP 8.54 8.78 37.54 0.43
AI11004 nozzles
WTDISP 3.09 3.20 12.75 0.60
AGDISP 4.42 5.47 31.19 0.14
Figure 6 AI110025 nozzle - Measured data - change in deposition at
various distances downwind of the spray block.
Figure 7 AI110025 nozzle – AGDISP Model Runs - change in
The results show an improvement for the AI11004 nozzles but do not show an improvement for the TT11005 nozzles. However for the TT11005 nozzles the adjustment meant that some of the values that WTDISP predicted near the spray block were well over 100 % of applied, so this result is not good. Therefore it is best that these nozzles be tested in the wind tunnel at the correct height to show the actual improvement. In this case AGDISP over estimated the evaporation by a much greater amount than for the AI nozzles. The evaporation and breakup characteristics between AI nozzles that have considerably more air inside them and ordinary nozzles needs to be investigated.
5. CONCLUSIONS
The analysis shows that the WTDISP methodology improves the model results for the Canadian data. The main reason for the improvement was the better droplet spectrum at 2m downwind measured in the wind tunnel which effectively improved the inputs for AGDISP to model the deposition downwind. This was clearly seen by the difference the droplet spectrum measured in the wind tunnel and calculated by AGDISP. AGDISP overestimated the evaporation and therefore overestimated the spray drift. Further work is also necessary to obtain droplet spectra for a range of field conditions. Also needing investigation are the effects on the droplet spectra and spray deposition from nozzle orientation; forward speed and turbulence from the spray equipment.
Differences in the turbulence characteristics between the field conditions and wind tunnel conditions need to be investigated using CFD models. It is thought that the different characteristics not may affect deposition greatly as the AGDISP algorithms are used to calculate deposition further than 2 m downwind.
The field measurements of deposition show a drop off in high wind velocities, which is contrary to the increase predicted by the AGDISP model. This was shown not to be a result of changes in the stability of the air, and has been postulated to possibly be either increased mechanic turbulence with higher wind speeds or the result of the reduced collection efficiency of the Petri plates in higher wind speeds.
Further wind tunnel tests are needed at the correct spray height to validate the other trials. There is scope to investigate the breakup and evaporation of AI nozzles as these results indicate that the evaporation rate may be greater for the AI nozzles than the standard nozzles.
References:
Bilanin, A.J., Teske, M.E., Barry, J.W. and Ekblad, R.B., 1989. AGDISP: The Aircraft Spray Dispersion Model, Code Development and Experimental Validation. American Society of Agricultural Engineers, 32(1): 327-334.
Gunn, R. and Kinzer, G.D., 1949. The Terminal Velocity of Fall for Water Droplets in Stagnant Air. Journal of Meteorology (now Journal of Atmospheric Sciences), 6(4): 243-248.
Hewitt, A. J., 2008, A developmental drift model for ground applications. In Aspects of Applied Biology 84, International Advances in Pesticide Application, pp. 73 - 82.
Hogstrom, U. and Bergstrom, H., 1996. Organised Turbulent Structures in the Near-Neutral Atmospheric Surface Layer. Journal of Atmospheric Sciences, 53(17): 2452-2464.
Miller, P.C.H. and Smith, R.W., 1997. The effect of forward speed on the drift from boom sprayers., Proceedings Brighton Crop Protection Conference - Weeds, pp. 399-406.
Oxford Laser, 2009, Spray Droplet and Particle Size Measurement, downloaded from http://www.oxfordlasers.com/imaging/particle_sizing May 2009.
Teske, M.E., Birchfield, N.B. and Bird, S.L., 2004. Development and validation of a mechanistic ground sprayer model, 2004 American Society of Agricultural Engineers/Canadian Society of Agricultural Engineering International Meeting, Ottawa, Canada.
Teske, M. and Thistle, H., 2008. The EPA Ground Sprayer Deposition Model, 8th Annual Pesticide Stewardship Conference - Stewardship Strategies and Tools Asheville, NC, USA.
Wolf, T.M. and Caldwell, B.C., 2001. Development of a Canadian spray drift model for the determination of buffer zone distances. In Expert Committee on Weeds - Comité d'experts en malherbologie (ECW-CEM), Proceedings of the 2001 National Meeting, Québec City. Sainte-Anne-de-Bellevue, Québec: ECW-CEM. Eds. D Bernier, D R A Campbell and D Cloutier, pp. 60.
van de Zande, J. C., Stallinga, H., Michielsen, J. M. G. P., and van Velde, P. (2005). Effect of sprayer speed on sprayer drift. Annual Review of Agricultural Engineering, 4(1), 129-142.
Woodward, S.J.R., Connell, R.J., Zabkiewisz, J.A., Steele, K.D. and Praat, J.P., 2008. EVALUATION OF THE AGDISP GROUND BOOM SPRAY DRIFT MODEL. NZ Plant Protection, 61: 164-168